FreshRSS

πŸ”’
❌ Secure Planet Training Courses Updated For 2019 - Click Here
There are new available articles, click to refresh the page.
Before yesterdayYour RSS feeds

Researchers Uncover 'LLMjacking' Scheme Targeting Cloud-Hosted AI Models

Cybersecurity researchers have discovered a novel attack that employs stolen cloud credentials to target cloud-hosted large language model (LLM) services with the goal of selling access to other threat actors. The attack technique has been codenamed LLMjacking by the Sysdig Threat Research Team. "Once initial access was obtained, they exfiltrated cloud credentials and gained

North Korea's Lazarus Group Deploys New Kaolin RAT via Fake Job Lures

The North Korea-linked threat actor known as Lazarus Group employed its time-tested fabricated job lures to deliver a new remote access trojan called Kaolin RAT as part of attacks targeting specific individuals in the Asia region in summer 2023. The malware could, "aside from standard RAT functionality, change the last write timestamp of a selected file and load any received DLL

Toolkit - The Essential Toolkit For Reversing, Malware Analysis, And Cracking

By: Zion3R


This tool compilation is carefully crafted with the purpose of being useful both for the beginners and veterans from the malware analysis world. It has also proven useful for people trying their luck at the cracking underworld.

It's the ideal complement to be used with the manuals from the site, and to play with the numbered theories mirror.


Advantages

To be clear, this pack is thought to be the most complete and robust in existence. Some of the pros are:

  1. It contains all the basic (and not so basic) tools that you might need in a real life scenario, be it a simple or a complex one.

  2. The pack is integrated with an Universal Updater made by us from scratch. Thanks to that, we get to mantain all the tools in an automated fashion.

  3. It's really easy to expand and modify: you just have to update the file bin\updater\tools.ini to integrate the tools you use to the updater, and then add the links for your tools to bin\sendto\sendto, so they appear in the context menus.

  4. The installer sets up everything we might need automatically - everything, from the dependencies to the environment variables, and it can even add a scheduled task to update the whole pack of tools weekly.

Installation

  1. You can simply download the stable versions from the release section, where you can also find the installer.

  2. Once downloaded, you can update the tools with the Universal Updater that we specifically developed for that sole purpose.
    You will find the binary in the folder bin\updater\updater.exe.

Tool set

This toolkit is composed by 98 apps that cover everything we might need to perform reverse engineering and binary/malware analysis.
Every tool has been downloaded from their original/official websites, but we still recommend you to use them with caution, specially those tools whose official pages are forum threads. Always exercise common sense.
You can check the complete list of tools here.

About contributions

Pull Requests are welcome. If you'd want to propose big changes, you should first create an Issue about it, so we all can analyze and discuss it. The tools are compressed with 7-zip, and the format used for nomenclature is {name} - {version}.7z


Dormakaba Locks Used in Millions of Hotel Rooms Could Be Cracked in Seconds

Security vulnerabilities discovered in Dormakaba's Saflok electronic RFID locks used in hotels could be weaponized by threat actors to forge keycards and stealthily slip into locked rooms. The shortcomings have been collectively named Unsaflok by researchers Lennert Wouters, Ian Carroll, rqu, BusesCanFly, Sam Curry, sshell, and Will Caruana. They were reported to the Zurich-based

Noia - Simple Mobile Applications Sandbox File Browser Tool

By: Zion3R


Noia is a web-based tool whose main aim is to ease the process of browsing mobile applications sandbox and directly previewing SQLite databases, images, and more. Powered by frida.re.

Please note that I'm not a programmer, but I'm probably above the median in code-savyness. Try it out, open an issue if you find any problems. PRs are welcome.


Installation & Usage

npm install -g noia
noia

Features

  • Explore third-party applications files and directories. Noia shows you details including the access permissions, file type and much more.

  • View custom binary files. Directly preview SQLite databases, images, and more.

  • Search application by name.

  • Search files and directories by name.

  • Navigate to a custom directory using the ctrl+g shortcut.

  • Download the application files and directories for further analysis.

  • Basic iOS support

and more


Setup

Desktop requirements:

  • node.js LTS and npm
  • Any decent modern desktop browser

Noia is available on npm, so just type the following command to install it and run it:

npm install -g noia
noia

Device setup:

Noia is powered by frida.re, thus requires Frida to run.

Rooted Device

See: * https://frida.re/docs/android/ * https://frida.re/docs/ios/

Non-rooted Device

  • https://koz.io/using-frida-on-android-without-root/
  • https://github.com/sensepost/objection/wiki/Patching-Android-Applications
  • https://nowsecure.com/blog/2020/01/02/how-to-conduct-jailed-testing-with-frida/

Security Warning

This tool is not secure and may include some security vulnerabilities so make sure to isolate the webpage from potential hackers.

LICENCE

MIT


Mhf - Mobile Helper Framework - A Tool That Automates The Process Of Identifying The Framework/Technology Used To Create A Mobile Application

By: Zion3R


Mobile Helper Framework is a tool that automates the process of identifying the framework/technology used to create a mobile application. Additionally, it assists in finding sensitive information or provides suggestions for working with the identified platform.


How work?

The tool searches for files associated with the technologies used in mobile application development, such as configuration files, resource files, and source code files.


Example

Cordova

Search files:

index.html
cordova.js
cordova_plugins.js

React Native Android & iOS

Search file

Andorid files:

libreactnativejni.so
index.android.bundle

iOS files:

main.jsbundle

Installation

❗A minimum of Java 8 is required to run Apktool.

pip install -r requirements.txt


Usage

python3 mhf.py app.apk|ipa|aab


Examples
python3 mobile_helper_framework.py file.apk

[+] App was written in React Native

Do you want analizy the application (y/n) y

Output directory already exists. Skipping decompilation.

Beauty the react code? (y/n) n

Search any info? (y/n) y

==>>Searching possible internal IPs in the file

results.........

==>>Searching possible emails in the file

results.........

==>>Searching possible interesting words in the file

results.........

==>>Searching Private Keys in the file

results.........

==>>Searching high confidential secrets

results.........

==>>Searching possible sensitive URLs in js files

results.........

==>>Searching possible endpoints in js files results.........

Features

This tool uses Apktool for decompilation of Android applications.

This tool renames the .ipa file of iOS applications to .zip and extracts the contents.

Feature Note Cordova React Native Native JavaScript Flutter Xamarin
JavaScript beautifier Use this for the first few occasions to see better results. βœ… βœ… βœ…
Identifying multiple sensitive information IPs, Private Keys, API Keys, Emails, URLs βœ… βœ… βœ… ❌
Cryptographic Functions βœ… βœ… βœ… ❌ ❌
Endpoint extractor βœ… βœ… βœ… ❌ ❌
Automatically detects if the code has been beautified. ❌ ❌ ❌
Extracts automatically apk of devices/emulator ❌ ❌ ❌ ❌ ❌
Patching apk βœ…
Extract an APK from a bundle file. βœ… βœ… βœ… βœ… βœ…
Detect if JS files are encrypted ❌ ❌
Detect if the resources are compressed. ❌ Hermesβœ… ❌ ❌ XALZβœ…
Detect if the app is split ❌ ❌ ❌ ❌ ❌

What is patching apk: This tool uses Reflutter, a framework that assists with reverse engineering of Flutter apps using a patched version of the Flutter library.

More information: https://github.com/Impact-I/reFlutter


Split APKs is a technique used by Android to reduce the size of an application and allow users to download and use only the necessary parts of the application.

Instead of downloading a complete application in a single APK file, Split APKs divide the application into several smaller APK files, each of which contains only a part of the application such as resources, code libraries, assets, and configuration files.

adb shell pm path com.package
package:/data/app/com.package-NW8ZbgI5VPzvSZ1NgMa4CQ==/base.apk
package:/data/app/com.package-NW8ZbgI5VPzvSZ1NgMa4CQ==/split_config.arm64_v8a.apk
package:/data/app/com.package-NW8ZbgI5VPzvSZ1NgMa4CQ==/split_config.en.apk
package:/data/app/com.package-NW8ZbgI5VPzvSZ1NgMa4CQ==/split_config.xxhdpi.apk

For example, in Flutter if the application is a Split it's necessary patch split_config.arm64_v8a.apk, this file contains libflutter.so


Credits
  • This tool use a secrets-patterns-db repositorty created by mazen160
  • This tool use a regular expresion created by Gerben_Javado for extract endpoints
  • This tools use reflutter for flutter actions

Changelog

0.5
  • Public release
  • Bug fixes

0.4
  • Added plugins information in Cordova apps
  • Added Xamarin actions
  • Added NativeScript actions
  • Bug fixes

0.3
  • Added NativeScript app detection
  • Added signing option when the apk extracted of aab file is not signed

0.2
  • Fixed issues with commands on Linux.

0.1
  • Initial version release.

License
  • This work is licensed under a Creative Commons Attribution 4.0 International License.

Autors

Cesar Calderon Marco Almaguer


Ivanti Pulse Secure Found Using 11-Year-Old Linux Version and Outdated Libraries

A reverse engineering of the firmware running on Ivanti Pulse Secure appliances has revealed numerous weaknesses, once again underscoring the challenge of securing software supply chains. Eclypsiusm, which acquired firmware version 9.1.18.2-24467.1 as part of the process, said the base operating system used by the Utah-based software company for the device is CentOS 6.4. "Pulse Secure runs an 11

Bread - BIOS Reverse Engineering And Advanced Debugging

By: Zion3R


BREAD (BIOS Reverse Engineering & Advanced Debugging) is an 'injectable' real-mode x86 debugger that can debug arbitrary real-mode code (on real HW) from another PC via serial cable.

Introduction

BREAD emerged from many failed attempts to reverse engineer legacy BIOS. Given that the vast majority -- if not all -- BIOS analysis is done statically using disassemblers, understanding the BIOS becomes extremely difficult, since there's no way to know the value of registers or memory in a given piece of code.

Despite this, BREAD can also debug arbitrary code in real-mode, such as bootable code or DOS programs too.


How it works?

This debugger is divided into two parts: the debugger (written entirely in assembly and running on the hardware being debugged) and the bridge, written in C and running on Linux.

The debugger is the injectable code, written in 16-bit real-mode, and can be placed within the BIOS ROM or any other real-mode code. When executed, it sets up the appropriate interrupt handlers, puts the processor in single-step mode, and waits for commands on the serial port.

The bridge, on the other hand, is the link between the debugger and GDB. The bridge communicates with GDB via TCP and forwards the requests/responses to the debugger through the serial port. The idea behind the bridge is to remove the complexity of GDB packets and establish a simpler protocol for communicating with the machine. In addition, the simpler protocol enables the final code size to be smaller, making it easier for the debugger to be injectable into various different environments.

As shown in the following diagram:

    +---------+ simple packets +----------+   GDB packets  +---------+                                       
| |--------------->| |--------------->| |
| dbg | | bridge | | gdb |
|(real HW)|<---------------| (Linux) |<---------------| (Linux) |
+---------+ serial +----------+ TCP +---------+

Features

By implementing the GDB stub, BREAD has many features out-of-the-box. The following commands are supported:

  • Read memory (via x, dump, find, and relateds)
  • Write memory (via set, restore, and relateds)
  • Read and write registers
  • Single-Step (si, stepi) and continue (c, continue)
  • Breakpoints (b, break)1
  • Hardware Watchpoints (watch and its siblings)2

Limitations

How many? Yes. Since the code being debugged is unaware that it is being debugged, it can interfere with the debugger in several ways, to name a few:

  • Protected-mode jump: If the debugged code switches to protected-mode, the structures for interrupt handlers, etc. are altered and the debugger will no longer be invoked at that point in the code. However, it is possible that a jump back to real mode (restoring the full previous state) will allow the debugger to work again.

  • IDT changes: If for any reason the debugged code changes the IDT or its base address, the debugger handlers will not be properly invoked.

  • Stack: BREAD uses a stack and assumes it exists! It should not be inserted into locations where the stack has not yet been configured.

For BIOS debugging, there are other limitations such as: it is not possible to debug the BIOS code from the very beggining (bootblock), as a minimum setup (such as RAM) is required for BREAD to function correctly. However, it is possible to perform a "warm-reboot" by setting CS:EIP to F000:FFF0. In this scenario, the BIOS initialization can be followed again, as BREAD is already properly loaded. Please note that the "code-path" of BIOS initialization during a warm-reboot may be different from a cold-reboot and the execution flow may not be exactly the same.

Building

Building only requires GNU Make, a C compiler (such as GCC, Clang, or TCC), NASM, and a Linux machine.

The debugger has two modes of operation: polling (default) and interrupt-based:

Polling mode

Polling mode is the simplest approach and should work well in a variety of environments. However, due the polling nature, there is a high CPU usage:

Building

$ git clone https://github.com/Theldus/BREAD.git
$ cd BREAD/
$ make

Interrupt-based mode

The interrupt-based mode optimizes CPU utilization by utilizing UART interrupts to receive new data, instead of constantly polling for it. This results in the CPU remaining in a 'halt' state until receiving commands from the debugger, and thus, preventing it from consuming 100% of the CPU's resources. However, as interrupts are not always enabled, this mode is not set as the default option:

Building

$ git clone https://github.com/Theldus/BREAD.git
$ cd BREAD/
$ make UART_POLLING=no

Usage

Using BREAD only requires a serial cable (and yes, your motherboard has a COM header, check the manual) and injecting the code at the appropriate location.

To inject, minimal changes must be made in dbg.asm (the debugger's src). The code's 'ORG' must be changed and also how the code should return (look for ">> CHANGE_HERE <<" in the code for places that need to be changed).

For BIOS (e.g., AMI Legacy):

Using an AMI legacy as an example, where the debugger module will be placed in the place of the BIOS logo (0x108200 or FFFF:8210) and the following instructions in the ROM have been replaced with a far call to the module:

...
00017EF2 06 push es
00017EF3 1E push ds
00017EF4 07 pop es
00017EF5 8BD8 mov bx,ax -┐ replaced by: call 0xFFFF:0x8210 (dbg.bin)
00017EF7 B8024F mov ax,0x4f02 -β”˜
00017EFA CD10 int 0x10
00017EFC 07 pop es
00017EFD C3 ret
...

the following patch is sufficient:

diff --git a/dbg.asm b/dbg.asm
index caedb70..88024d3 100644
--- a/dbg.asm
+++ b/dbg.asm
@@ -21,7 +21,7 @@
; SOFTWARE.

[BITS 16]
-[ORG 0x0000] ; >> CHANGE_HERE <<
+[ORG 0x8210] ; >> CHANGE_HERE <<

%include "constants.inc"

@@ -140,8 +140,8 @@ _start:

; >> CHANGE_HERE <<
; Overwritten BIOS instructions below (if any)
- nop
- nop
+ mov ax, 0x4F02
+ int 0x10
nop
nop

It is important to note that if you have altered a few instructions within your ROM to invoke the debugger code, they must be restored prior to returning from the debugger.

The reason for replacing these two instructions is that they are executed just prior to the BIOS displaying the logo on the screen, which is now the debugger, ensuring a few key points:

  • The logo module (which is the debugger) has already been loaded into memory
  • Video interrupts from the BIOS already work
  • The code around it indicates that the stack already exists

Finding a good location to call the debugger (where the BIOS has already initialized enough, but not too late) can be challenging, but it is possible.

After this, dbg.bin is ready to be inserted into the correct position in the ROM.

For DOS

Debugging DOS programs with BREAD is a bit tricky, but possible:

1. Edit dbg.asm so that DOS understands it as a valid DOS program:

  • Set the ORG to 0x100
  • Leave the useful code away from the beginning of the file (times)
  • Set the program output (int 0x20)

The following patch addresses this:

diff --git a/dbg.asm b/dbg.asm
index caedb70..b042d35 100644
--- a/dbg.asm
+++ b/dbg.asm
@@ -21,7 +21,10 @@
; SOFTWARE.

[BITS 16]
-[ORG 0x0000] ; >> CHANGE_HERE <<
+[ORG 0x100]
+
+times 40*1024 db 0x90 ; keep some distance,
+ ; 40kB should be enough

%include "constants.inc"

@@ -140,7 +143,7 @@ _start:

; >> CHANGE_HERE <<
; Overwritten BIOS instructions below (if any)
- nop
+ int 0x20 ; DOS interrupt to exit process
nop

2. Create a minimal bootable DOS environment and run

Create a bootable FreeDOS (or DOS) floppy image containing just the kernel and the terminal: KERNEL.SYS and COMMAND.COM. Also add to this floppy image the program to be debugged and the DBG.COM (dbg.bin).

The following steps should be taken after creating the image:

  • Boot it with bridge already opened (refer to the next section for instructions).
  • Execute DBG.COM.
  • Once execution stops, use GDB to add any desired breakpoints and watchpoints relative to the next process you want to debug. Then, allow the DBG.COM process to continue until it finishes.
  • Run the process that you want to debug. The previously-configured breakpoints and watchpoints should trigger as expected.

It is important to note that DOS does not erase the process image after it exits. As a result, the debugger can be configured like any other DOS program and the appropriate breakpoints can be set. The beginning of the debugger is filled with NOPs, so it is anticipated that the new process will not overwrite the debugger's memory, allowing it to continue functioning even after it appears to be "finished". This allows BREaD to debug other programs, including DOS itself.

Bridge

Bridge is the glue between the debugger and GDB and can be used in different ways, whether on real hardware or virtual machine.

Its parameters are:

Usage: ./bridge [options]
Options:
-s Enable serial through socket, instead of device
-d <path> Replaces the default device path (/dev/ttyUSB0)
(does not work if -s is enabled)
-p <port> Serial port (as socket), default: 2345
-g <port> GDB port, default: 1234
-h This help

If no options are passed the default behavior is:
./bridge -d /dev/ttyUSB0 -g 1234

Minimal recommended usages:
./bridge -s (socket mode, serial on 2345 and GDB on 1234)
./bridge (device mode, serial on /dev/ttyUSB0 and GDB on 1234)

Real hardware

To use it on real hardware, just invoke it without parameters. Optionally, you can change the device path with the -d parameter:

Execution flow:
  1. Connect serial cable to PC
  2. Run bridge (./bridge or ./bridge -d /path/to/device)
  3. Turn on the PC to be debugged
  4. Wait for the message: Single-stepped, you can now connect GDB! and then launch GDB: gdb.

Virtual machine

For use in a virtual machine, the execution order changes slightly:

Execution flow:
  1. Run bridge (./bridge or ./bridge -d /path/to/device)
  2. Open the VM3 (such as: make bochs or make qemu)
  3. Wait for the message: Single-stepped, you can now connect GDB! and then launch GDB: gdb.

In both cases, be sure to run GDB inside the BRIDGE root folder, as there are auxiliary files in this folder for GDB to work properly in 16-bit.

Contributing

BREAD is always open to the community and willing to accept contributions, whether with issues, documentation, testing, new features, bugfixes, typos, and etc. Welcome aboard.

License and Authors

BREAD is licensed under MIT License. Written by Davidson Francis and (hopefully) other contributors.

Footnotes

  1. Breakpoints are implemented as hardware breakpoints and therefore have a limited number of available breakpoints. In the current implementation, only 1 active breakpoint at a time! ↩

  2. Hardware watchpoints (like breakpoints) are also only supported one at a time. ↩

  3. Please note that debug registers do not work by default on VMs. For bochs, it needs to be compiled with the --enable-x86-debugger=yes flag. For Qemu, it needs to run with KVM enabled: --enable-kvm (make qemu already does this). ↩


Sekiryu - Comprehensive Toolkit For Ghidra Headless

By: Zion3R


This Ghidra Toolkit is a comprehensive suite of tools designed to streamline and automate various tasks associated with running Ghidra in Headless mode. This toolkit provides a wide range of scripts that can be executed both inside and alongside Ghidra, enabling users to perform tasks such as Vulnerability Hunting, Pseudo-code Commenting with ChatGPT and Reporting with Data Visualization on the analyzed codebase. It allows user to load and save their own script and interract with the built-in API of the script.


Key Features

  • Headless Mode Automation: The toolkit enables users to seamlessly launch and run Ghidra in Headless mode, allowing for automated and batch processing of code analysis tasks.

  • Script Repository/Management: The toolkit includes a repository of pre-built scripts that can be executed within Ghidra. These scripts cover a variety of functionalities, empowering users to perform diverse analysis and manipulation tasks. It allows users to load and save their own scripts, providing flexibility and customization options for their specific analysis requirements. Users can easily manage and organize their script collection.

  • Flexible Input Options: Users can utilize the toolkit to analyze individual files or entire folders containing multiple files. This flexibility enables efficient analysis of both small-scale and large-scale codebases.

Available scripts

  • Vulnerability Hunting with pattern recognition: Leverage the toolkit's scripts to identify potential vulnerabilities within the codebase being analyzed. This helps security researchers and developers uncover security weaknesses and proactively address them.
  • Vulnerability Hunting with SemGrep: Thanks to the security Researcher 0xdea and the rule-set they created, we can use simple rules and SemGrep to detect vulnerabilities in C/C++ pseudo code (their github: https://github.com/0xdea/semgrep-rules)
  • Automatic Pseudo Code Generating: Automatically generate pseudo code within Ghidra's Headless mode. This feature assists in understanding and documenting the code logic without manual intervention.
  • Pseudo-code Commenting with ChatGPT: Enhance the readability and understanding of the codebase by utilizing ChatGPT to generate human-like comments for pseudo-code snippets. This feature assists in documenting and explaining the code logic.
  • Reporting and Data Visualization: Generate comprehensive reports with visualizations to summarize and present the analysis results effectively. The toolkit provides data visualization capabilities to aid in identifying patterns, dependencies, and anomalies in the codebase.

Pre-requisites

Before using this project, make sure you have the following software installed:

Installation

  • Install the pre-requisites mentionned above.
  • Download Sekiryu release directly from Github or use: pip install sekiryu.

Usage

In order to use the script you can simply run it against a binary with the options that you want to execute.

  • sekiryu [-F FILE][OPTIONS]

Please note that performing a binary analysis with Ghidra (or any other product) is a relatively slow process. Thus, expect the binary analysis to take several minutes depending on the host performance. If you run Sekiryu against a very large application or a large amount of binary files, be prepared to WAIT

Demos

API

In order to use it the User must import xmlrpc in their script and call the function like for example: proxy.send_data

Functions

  • send_data() - Allows user to send data to the server. ("data" is a Dictionnary)
  • recv_data() - Allows user to receive data from the server. ("data" is a Dictionnary)
  • request_GPT() - Allows user to send string data via ChatGPT API.

Use your own scripts

Scripts are saved in the folder /modules/scripts/ you can simply copy your script there. In the ghidra_pilot.py file you can find the following function which is responsible to run a headless ghidra script:

def exec_headless(file, script):
"""
Execute the headless analysis of ghidra
"""
path = ghidra_path + 'analyzeHeadless'
# Setting variables
tmp_folder = "/tmp/out"
os.mkdir(tmp_folder)
cmd = ' ' + tmp_folder + ' TMP_DIR -import'+ ' '+ file + ' '+ "-postscript "+ script +" -deleteProject"

# Running ghidra with specified file and script
try:
p = subprocess.run([str(path + cmd)], shell=True, capture_output=True)
os.rmdir(tmp_folder)

except KeyError as e:
print(e)
os.rmdir(tmp_folder)

The usage is pretty straight forward, you can create your own script then just add a function in the ghidra_pilot.py such as:

def yourfunction(file):
try:
# Setting script
script = "modules/scripts/your_script.py"

# Start the exec_headless function in a new thread
thread = threading.Thread(target=exec_headless, args=(file, script))
thread.start()
thread.join()
except Exception as e:
print(str(e))

The file cli.py is responsible for the command-line-interface and allows you to add argument and command associated like this:

analysis_parser.add_argument('[-ShortCMD]', '[--LongCMD]', help="Your Help Message", action="store_true")

Contributions

  • Scripts/SCRIPTS/SCRIIIIIPTS: This tool is designed to be a toolkit allowing user to save and run their own script easily, obviously if you can contribue in any sort of script (anything that is interesting will be approved !)
  • Optimization: Any kind of optimization are welcomed and will almost automically be approved and deployed every release, some nice things could be: improve parallel tasking, code cleaning and overall improvement.
  • Malware analysis: It's a big part, which i'm not familiar with. Any malware analyst willing to contribute can suggest idea, script, or even commit code directly in the project.
  • Reporting: I ain't no data visualization engineer, if anyone is willing to improve/contribue on this part, it'll be very nice.

Warning

The xmlrpc.server module is not secure against maliciously constructed data. If you need to parse 
untrusted or unauthenticated data see XML vulnerabilities.

Special thanks

A lot of people encouraged me to push further on this tool and improve it. Without you all this project wouldn't have been
the same so it's time for a proper shout-out:
- @JeanBedoul @McProustinet @MilCashh @Aspeak @mrjay @Esbee|sandboxescaper @Rosen @Cyb3rops @RussianPanda @Dr4k0nia
- @Inversecos @Vs1m @djinn @corelanc0d3r @ramishaath @chompie1337
Thanks for your feedback, support, encouragement, test, ideas, time and care.

For more information about Bushido Security, please visit our website: https://www.bushido-sec.com/.


Tiny_Tracer - A Pin Tool For Tracing API Calls Etc

By: Zion3R


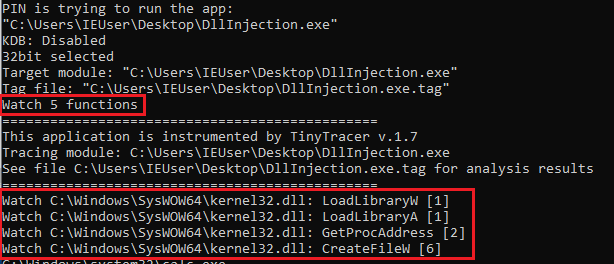
A Pin Tool for tracing:


Bypasses the anti-tracing check based on RDTSC.

Generates a report in a .tag format (which can be loaded into other analysis tools):

RVA;traced event

i.e.

345c2;section: .text
58069;called: C:\Windows\SysWOW64\kernel32.dll.IsProcessorFeaturePresent
3976d;called: C:\Windows\SysWOW64\kernel32.dll.LoadLibraryExW
3983c;called: C:\Windows\SysWOW64\kernel32.dll.GetProcAddress
3999d;called: C:\Windows\SysWOW64\KernelBase.dll.InitializeCriticalSectionEx
398ac;called: C:\Windows\SysWOW64\KernelBase.dll.FlsAlloc
3995d;called: C:\Windows\SysWOW64\KernelBase.dll.FlsSetValue
49275;called: C:\Windows\SysWOW64\kernel32.dll.LoadLibraryExW
4934b;called: C:\Windows\SysWOW64\kernel32.dll.GetProcAddress
...

How to build

On Windows

To compile the prepared project you need to use Visual Studio >= 2012. It was tested with Intel Pin 3.28.
Clone this repo into \source\tools that is inside your Pin root directory. Open the project in Visual Studio and build. Detailed description available here.
To build with Intel Pin < 3.26 on Windows, use the appropriate legacy Visual Studio project.

On Linux

For now the support for Linux is experimental. Yet it is possible to build and use Tiny Tracer on Linux as well. Please refer tiny_runner.sh for more information. Detailed description available here.

Usage

ο“– Details about the usage you will find on the project's Wiki.

WARNINGS

  • In order for Pin to work correctly, Kernel Debugging must be DISABLED.
  • In install32_64 you can find a utility that checks if Kernel Debugger is disabled (kdb_check.exe, source), and it is used by the Tiny Tracer's .bat scripts. This utilty sometimes gets flagged as a malware by Windows Defender (it is a known false positive). If you encounter this issue, you may need to exclude the installation directory from Windows Defender scans.
  • Since the version 3.20 Pin has dropped a support for old versions of Windows. If you need to use the tool on Windows < 8, try to compile it with Pin 3.19.


Questions? Ideas? Join Discussions!


KoodousFinder - A Simple Tool To Allows Users To Search For And Analyze Android Apps For Potential Security Threats And Vulnerabilities

By: Zion3R


A simple tool to allows users to search for and analyze android apps for potential security threats and vulnerabilities


Account and API Key

Create a Koodous account and get your api key https://koodous.com/settings/developers

Install

$ pip install koodousfinder

Arguments

Param description
-h, --help 'Show this help message and exit'
--package-name "General search for APKs"`
--app-name Name of the app to search for

Examples

koodous.py --package-name "app: Brata AND package: com.brata"
koodous.py --package-name "package: com.google.android.videos AND trusted: true"
koodous.py --package-name "com.metasploit"
python3 koodous.py --app-name "WhatsApp MOD"


Modifiers for advanced search

Attribute Modifier Description
Hash hash: Performs the search depending on the automatically inserted hash. The admitted hashes are sha1, sha256 and md5.
App name app: Searches for the specified app name. If it is a compound name, it can be searched enclosed in quotes, for example: app: "Whatsapp premium".
Package name. package: Searches the package name to see if it contains the indicated string, for example: package: com.whatsapp.
Name of the developer or company. developer: Searches whether the company or developer field includes the indicated string, for example: developer: "WhatsApp Inc.".
Certificate certificate: Searches the apps by their certificate. For example: cert: 60BBF1896747E313B240EE2A54679BB0CE4A5023 or certificate: 38A0F7D505FE18FEC64FBF343ECAAAF310DBD799.

More information: https://docs.koodous.com/apks.html.
#TODO

  • Discord Integration
  • Rulesets view


Apk.Sh - Makes Reverse Engineering Android Apps Easier, Automating Some Repetitive Tasks Like Pulling, Decoding, Rebuilding And Patching An APK


apk.sh is a Bash script that makes reverse engineering Android apps easier, automating some repetitive tasks like pulling, decoding, rebuilding and patching an APK.


Features

apk.sh basically uses apktool to disassemble, decode and rebuild resources and some bash to automate the frida gadget injection process. It also supports app bundles/split APKs.

  • 
    Patching APKs to load frida-gadget.so on start.
  • 
    Support for app bundles/split APKs.
  • 
    Disassembling resources to nearly original form with apktool.
  • ο”©
    Rebuilding decoded resources back to binary APK/JAR with apktool.
  • ️
    Code signing the apk with apksigner.
  • ο–₯️
    Multiple arch support (arm, arm64, x86, x86_64).
  • ο“΅
    No rooted Android device needed.

Getting started

Pulling an APK from a device is simple as running ./apk.sh pull <package_name>

Decoding an APK is simple as running ./apk.sh decode <apk_name>

Rebuilding an APK is simple as running ./apk.sh build <apk_dir>

apk.sh pull

apk.sh pull pull an APK from a device. It supports app bundles/split APKs, which means that split APKs will be joined in a single APK (this is useful for patching). If the package is an app bundle/split APK, apk.sh will combine the APKs into a single APK, fixing all public resource identifiers.

apk.sh patch

apk.sh patch patch an APK to load frida-gadget.so on start.

frida-gadget.so is a Frida's shared library meant to be loaded by programs to be instrumented (when the Injected mode of operation isn’t suitable). By simply loading the library it will allow you to interact with it using existing Frida-based tools like frida-trace. It also supports a fully autonomous approach where it can run scripts off the filesystem without any outside communication.

Patching an APK is simple as running ./apk.sh patch <apk_name> --arch arm.

You can calso specify a Frida gadget configuration in a json ./apk.sh patch <apk_name> --arch arm --gadget-conf <config.json>


Frida's Gadget configurations

In the default interaction, Frida Gadget exposes a frida-server compatible interface, listening on localhost:27042 by default. In order to achieve early instrumentation Frida let Gadget’s constructor function block until you either attach() to the process, or call resume() after going through the usual spawn() -> attach() -> ...apply instrumentation... steps.

If you don’t want this blocking behavior and want to let the program boot right up, or you’d prefer it listening on a different interface or port, you can customize this through a json configuration file.

The default configuration is:

{
"interaction": {
"type": "listen",
"address": "127.0.0.1",
"port": 27042,
"on_port_conflict": "fail",
"on_load": "wait"
}
}

You can pass the gadget configuration file to apk.sh with the --gadget-conf option.

Script interaction

A typically suggested configuration might be:

{
"interaction": {
"type": "script",
"path": "/data/local/tmp/script.js",
"on_change":"reload"
}
}

script.js could be something like:

var android_log_write = new NativeFunction(
Module.getExportByName(null, '__android_log_write'),
'int',
['int', 'pointer', 'pointer']
);

var tag = Memory.allocUtf8String("[frida-script][ax]");

var work = function() {
setTimeout(function() {
android_log_write(3, tag, Memory.allocUtf8String("ping @ " + Date.now()));
work();
}, 1000);
}

work();

android_log_write(3, tag, Memory.allocUtf8String(">--(O.o)-<"));

adb push script.js /data/local/tmp

./apk.sh patch <apk_name> --arch arm --gadget-conf <config.json>

adb install file.gadget.apk

Note

Add the following code to print to logcat the console.log output of any script from the frida codeshare when using the Script interaction type.

// print to logcat the console.log output
// see: https://github.com/frida/frida/issues/382
var android_log_write = new NativeFunction(
Module.getExportByName(null, '__android_log_write'),
'int',
['int', 'pointer', 'pointer']
);
var tag = Memory.allocUtf8String("[frida-script][ax]");
console.log = function(str) {
android_log_write(3, tag, Memory.allocUtf8String(str));
}

Requirements

  • apktool
  • apksigner
  • unxz
  • zipalign
  • aapt
  • adb

Usage

SYNOPSIS

apk.sh [SUBCOMMAND] [APK FILE|APK DIR|PKG NAME] [FLAGS]
apk.sh pull [PKG NAME] [FLAGS]
apk.sh decode [APK FILE] [FLAGS]
apk.sh build [APK DIR] [FLAGS]
apk.sh patch [APK FILE] [FLAGS]
apk.sh rename [APK FILE] [PKG NAME] [FLAGS]

SUBCOMMANDS

pull	Pull an apk from device/emulator.
decode Decode an apk.
build Re-build an apk.
patch Patch an apk.
rename Rename the apk package.

FLAGS

-a, --arch <arch> Specify the target architecture, mandatory when patching.

-g, --gadget-conf <json_file> Specify a frida-gadget configuration file, optional when patching.

-n, --net Add a permissive network security config when building, optional. It can be used with patch, pull and rename also.

-s, --safe Do not decode resources when decoding (i.e. apktool -r). Cannot be used when patching.

-d, --no-dis Do not disassemble dex, optional when decoding (i.e. apktool -s). Cannot be used when patching.


Links of Interest

https://frida.re/docs/gadget/

https://lief-project.github.io/doc/latest/tutorials/09_frida_lief.html

https://koz.io/using-frida-on-android-without-root/

https://github.com/sensepost/objection/

https://github.com/NickstaDB/patch-apk/

https://neo-geo2.gitbook.io/adventures-on-security/frida-scripting-guide/frida-scripting-guide


How to Build a Research Lab for Reverse Engineering β€” 4 Ways

Malware analysis is an essential part of security researcher's work. But working with malicious samples can be dangerous β€” it requires specialized tools to record their activity, and a secure environment to prevent unintended damage. However, manual lab setup and configuration can prove to be a laborious and time-consuming process. In this article, we'll look at 4 ways to create a reverse

Fuzzable - Framework For Automating Fuzzable Target Discovery With Static Analysis


Framework for Automating Fuzzable Target Discovery with Static Analysis.

Introduction

Vulnerability researchers conducting security assessments on software will often harness the capabilities of coverage-guided fuzzing through powerful tools like AFL++ and libFuzzer. This is important as it automates the bughunting process and reveals exploitable conditions in targets quickly. However, when encountering large and complex codebases or closed-source binaries, researchers have to painstakingly dedicate time to manually audit and reverse engineer them to identify functions where fuzzing-based exploration can be useful.

Fuzzable is a framework that integrates both with C/C++ source code and binaries to assist vulnerability researchers in identifying function targets that are viable for fuzzing. This is done by applying several static analysis-based heuristics to pinpoint risky behaviors in the software and the functions that executes them. Researchers can then utilize the framework to generate basic harness templates, which can then be used to hunt for vulnerabilities, or to be integrated as part of a continuous fuzzing pipeline, such as Google's oss-fuzz project.

In addition to running as a standalone tool, Fuzzable is also integrated as a plugin for the Binary Ninja disassembler, with support for other disassembly backends being developed.

Check out the original blog post detailing the tool here, which highlights the technical specifications of the static analysis heuristics and how this tool came about. This tool is also featured at Black Hat Arsenal USA 2022.


Features

  • Supports analyzing binaries (with Angr and Binary Ninja) and source code artifacts (with tree-sitter).
  • Run static analysis both as a standalone CLI tool or a Binary Ninja plugin.
  • Harness generation to ramp up on creating fuzzing campaigns quickly.

Installation

Some binary targets may require some sanitizing (ie. signature matching, or identifying functions from inlining), and therefore fuzzable primarily uses Binary Ninja as a disassembly backend because of it's ability to effectively solve these problems. Therefore, it can be utilized both as a standalone tool and plugin.

Since Binary Ninja isn't accessible to all and there may be a demand to utilize for security assessments and potentially scaling up in the cloud, an angr fallback backend is also supported. I anticipate to incorporate other disassemblers down the road as well (priority: Ghidra).

Command Line (Standalone)

If you have Binary Ninja Commercial, be sure to install the API for standalone headless usage:

$ python3 /Applications/Binary\ Ninja.app/Contents/Resources/scripts/install_api.py

Install with pip:

$ pip install fuzzable

Manual/Development Build

We use poetry for dependency management and building. To do a manual build, clone the repository with the third-party modules:

$ git clone --recursive https://github.com/ex0dus-0x/fuzzable

To install manually:

$ cd fuzzable/

# without poetry
$ pip install .

# with poetry
$ poetry install

# with poetry for a development virtualenv
$ poetry shell

You can now analyze binaries and/or source code with the tool!

# analyzing a single shared object library binary
$ fuzzable analyze examples/binaries/libbasic.so

# analyzing a single C source file
$ fuzzable analyze examples/source/libbasic.c

# analyzing a workspace with multiple C/C++ files and headers
$ fuzzable analyze examples/source/source_bundle/

Binary Ninja Plugin

fuzzable can be easily installed through the Binary Ninja plugin marketplace by going to Binary Ninja > Manage Plugins and searching for it. Here is an example of the fuzzable plugin running, accuracy identifying targets for fuzzing and further vulnerability assessment:

Usage

fuzzable comes with various options to help better tune your analysis. More will be supported in future plans and any feature requests made.

Static Analysis Heuristics

To determine fuzzability, fuzzable utilize several heuristics to determine which targets are the most viable to target for dynamic analysis. These heuristics are all weighted differently using the scikit-criteria library, which utilizes multi-criteria decision analysis to determine the best candidates. These metrics and are there weights can be seen here:

Heuristic Description Weight
Fuzz Friendly Name Symbol name implies behavior that ingests file/buffer input 0.3
Risky Sinks Arguments that flow into risky calls (ie memcpy) 0.3
Natural Loops Number of loops detected with the dominance frontier 0.05
Cyclomatic Complexity Complexity of function target based on edges + nodes 0.05
Coverage Depth Number of callees the target traverses into 0.3

As mentioned, check out the technical blog post for a more in-depth look into why and how these metrics are utilized.

Many metrics were largely inspired by Vincenzo Iozzo's original work in 0-knowledge fuzzing.

Every targets you want to analyze is diverse, and fuzzable will not be able to account for every edge case behavior in the program target. Thus, it may be important during analysis to tune these weights appropriately to see if different results make more sense for your use case. To tune these weights in the CLI, simply specify the --score-weights argument:

$ fuzzable analyze <TARGET> --score-weights=0.2,0.2,0.2,0.2,0.2

Analysis Filtering

By default, fuzzable will filter out function targets based on the following criteria:

  • Top-level entry calls - functions that aren't called by any other calls in the target. These are ideal entry points that have potentially very high coverage.
  • Static calls - (source only) functions that are static and aren't exposed through headers.
  • Imports - (binary only) other library dependencies being used by the target's implementations.

To see calls that got filtered out by fuzzable, set the --list_ignored flag:

$ fuzzable analyze --list-ignored <TARGET>

In Binary Ninja, you can turn this setting in Settings > Fuzzable > List Ignored Calls.

In the case that fuzzable falsely filters out important calls that should be analyzed, it is recommended to use --include-* arguments to include them during the run:

# include ALL non top-level calls that were filtered out
$ fuzzable analyze --include-nontop <TARGET>

# include specific symbols that were filtered out
$ fuzzable analyze --include-sym <SYM> <TARGET>

In Binary Ninja, this is supported through Settings > Fuzzable > Include non-top level calls and Symbols to Exclude.

Harness Generation

Now that you have found your ideal candidates to fuzz, fuzzable will also help you generate fuzzing harnesses that are (almost) ready to instrument and compile for use with either a file-based fuzzer (ie. AFL++, Honggfuzz) or in-memory fuzzer (libFuzzer). To do so in the CLI:

If this target is a source codebase, the generic source template will be used.

If the target is a binary, the generic black-box template will be used, which ideally can be used with a fuzzing emulation mode like AFL-QEMU. A copy of the binary will also be created as a shared object if the symbol isn't exported directly to be dlopened using LIEF.

At the moment, this feature is quite rudimentary, as it simply will create a standalone C++ harness populated with the appropriate parameters, and will not auto-generate code that is needed for any runtime behaviors (ie. instantiating and freeing structures). However, the templates created for fuzzable should get still get you running quickly. Here are some ambitious features I would like to implement down the road:

  • Full harness synthesis - harnesses will work directly with absolutely no manual changes needed.
  • Synthesis from potential unit tests using the DeepState framework (Source only).
  • Immediate deployment to a managed continuous fuzzing fleet.

Exporting Reports

fuzzable supports generating reports in various formats. The current ones that are supported are JSON, CSV and Markdown. This can be useful if you are utilizing this as part of automation where you would like to ingest the output in a serializable format.

In the CLI, simply pass the --export argument with a filename with the appropriate extension:

$ fuzzable analyze --export=report.json <TARGET>

In Binary Ninja, go to Plugins > Fuzzable > Export Fuzzability Report > ... and select the format you want to export to and the path you want to write it to.

Contributing

This tool will be continuously developed, and any help from external mantainers are appreciated!

  • Create an issue for feature requests or bugs that you have come across.
  • Submit a pull request for fixes and enhancements that you would like to see contributed to this tool.

License

Fuzzable is licensed under the MIT License.


Unblob - Extract Files From Any Kind Of Container Formats


unblob is an accurate, fast, and easy-to-use extraction suite. It parses unknown binary blobs for more than 30 different archive, compression, and file-system formats, extracts their content recursively, and carves out unknown chunks that have not been accounted for.

Unblob is free to use, licensed with the MIT license. It has a Command Line Interface and can be used as a Python library.
This turns unblob into the perfect companion for extracting, analyzing, and reverse engineering firmware images.

See more at https://unblob.org.

Demo

Extract files from any kind of container formats (1)


Parrot 5.1 - Security GNU/Linux Distribution Designed with Cloud Pentesting and IoT Security in Mind

Parrot OS 5.1 is officially released. We're proud to say that the new version of Parrot OS 5.1 is available for download; this new version includes a lot of improvements and updates that makes the distribution more performing and more secure.

How do I get Parrot OS?

You can download Parrot OS by clicking here and, as always, we invite you to never trust third part and unofficial sources.

If you need any help or in case the direct downloads don't work for you, we also provide official Torrent files, which can circumvent firewalls and network restrictions in most cases.

How do I upgrade from a previous version?

First of all, we always suggest to update your version for being sure that is stable and functional. You can upgrade an existing system via APT using one of the following commands:

  • sudo parrot-upgrade

or

  • sudo apt update && sudo apt full-upgrade

Even if we recommend to always update your version, it is also recommended to do a backup and re-install the latest version to have a cleaner and more reliable user experience, especially if you upgrade from a very old version of parrot.

What's new in Parrot OS 5.1

New kernel 5.18.

You can find all the infos about the new Kernel 5.18 by clickig on this link.

Updated docker containers

Our docker offering has been revamped! We now provide our dedicated parrot.run image registry along with the default docker.io one.

All our images are now natively multiarch, and support amd64 and arm64 architectures.

Our containers offering was updated as well, and we are committed to further improve it.

Run docker run --rm -ti --network host -v $PWD/work:/work parrot.run/core and give our containers a try without having to install the system, or visit our Docker images page to explore the other containers we offer.

Updated backports.

Several packages were updated and backported, like the new Golang 1.19 or Libreoffice 7.4. This is part of our commitment to provide the latest version of every most important software while choosing a stable LTS release model.

To make sure to have all the latest packages installed from our backports channel, use the following commands:

  • sudo apt update
  • sudo apt full-upgrade -t parrot-backports

System updates

The system has received important updates to some opf its key packages, like parrot-menu, which now provides additional launchers to our newly imported tools; or parrot-core, which now provides a new firefox profile with improved security hardening, plus some minor bugfixes to our zshrc configuration.

Firefox profile overhault

As mentioned earlier, our Firefox profile has received a major update that significantly improves the overall privacy and security.

Our bookmarks collection has been revamped, and now includes new resources, including OSINT services, new learning sources and other useful resources for hackers, developers, students and security researchers.

We have also boosted our effort to avoid Mozilla telemetry and bring DuckDuckGo back as the default search engine, while we are exploring other alternatives for the future.

Tools updates

Most of our tools have received major version updates, especially our reverse engineering tools, like rizin and rizin-cutter.

Important updates involved metasploit, exploitdb and other popular tools as well.

New AnonSurf 4.0

The new AnonSurf 4 represents a major upgrade for our popular anonymity tool.

Anonsurf is our in-house anonymity solution that routes all the system traffic through TOR automatically without having to set up proxy settings for each individua program, and preventing traffic leaking in most cases.

The new version provides significant fixes and reliability updates, fully supports debian systems without the old resolvconf setup, has a new user interface with improved system tray icon and settings dialog window, and offers a better overall user experience.

Parrot IoT improvements

Our IoT version now implements significant performance improvements for the various Raspberry Pi boards, and finally includes Wi-Fi support for the Raspberry Pi 400 board.

The Parrot IoT offering has also been expanded, and it now offers Home and Security editions as well, with a full MATE desktop environment exactly like the desktop counterpart.

Architect Edition improvements

Our popular Architect Edition now implements some minor bugfixes and is more reliable than ever.

The Architect Edition is a special edition of Parrot that enables the user to install a barebone Parrot Core system, and then offers a selection of additional modules to further customize the system.

You can use Parrot Architect to install other desktop environments like KDE, GNOME or XFCE, or to install a specific selection of tools.

New infrastructure powered by Parrot and Kubernetes

The Architect Edition is also used internally by the Parrot Engineering Team to install Parrot Server Edition on all the servers that power our infrastructure, which is officially 100% powered by Parrot and Kubernetes.

This is a major change in the way we handle our infrastructure, which enables us to implement better autoscaling, easier management, smaller attack surface and an overall better network, with the improved scalability and security we were looking for.


BeatRev - POC For Frustrating/Defeating Malware Analysts


BeatRev Version 2

Disclaimer/Liability

The work that follows is a POC to enable malware to "key" itself to a particular victim in order to frustrate efforts of malware analysts.

I assume no responsibility for malicious use of any ideas or code contained within this project. I provide this research to further educate infosec professionals and provide additional training/food for thought for Malware Analysts, Reverse Engineers, and Blue Teamers at large.


TLDR

The first time the malware runs on a victim it AES encrypts the actual payload(an RDLL) using environmental data from that victim. Each subsequent time the malware is ran it gathers that same environmental info, AES decrypts the payload stored as a byte array within the malware, and runs it. If it fails to decrypt/the payload fails to run, the malware deletes itself. Protection against reverse engineers and malware analysts.


Updated 6 JUNE 2022


I didn't feel finished with this project so I went back and did a fairly substantial re-write. The original research and tradecraft may be found Here.

Major changes are as follows:

  1. I have released all source code
  2. I integrated Stephen Fewer's ReflectiveDLL into the project to replace Stage2
  3. I formatted some of the byte arrays in this project into string format and parse them with UuidFromStringA. This Repo was used as a template. This was done to lower entropy of Stage0 and Stage1
  4. Stage0 has had a fair bit of AV evasion built into it. Thanks to Cerbersec's Project Ares for inspiration
  5. The builder application to produce Stage0 has been included

There are quite a few different things that could be taken from the source code of this project for use elsewhere. Hopefully it will be useful for someone.

Problems with Original Release and Mitigations

There were a few shortcomings with the original release of BeatRev that I decided to try and address.

Stage2 was previously a standalone executable that was stored as the alternate data stream(ADS) of Stage1. In order to acheive the AES encryption-by-victim and subsequent decryption and execution, each time Stage1 was ran it would read the ADS, decrypt it, write back to the ADS, call CreateProcess, and then re-encrypt Stage2 and write it back to disk in the ADS. This was a lot of I/O operations and the CreateProcess call of course wasn't great.

I happened to come upon Steven Fewer's research concerning Reflective DLL's and it seemed like a good fit. Stage2 is now an RDLL; our malware/shellcode runner/whatever we want to protect can be ported to RDLL format and stored as a byte array within Stage1 that is then decrypted on runtime and executed by Stage1. This removes all of the I/O operations and the CreateProcess call from Version1 and is a welcome change.

Stage1 did not have any real kind of AV evasion measures programmed in; this was intentional, as it is extra work and wasn't really the point of this research. During the re-write I took it as an added challenge and added API-hashing to remove functions from the Import Address Table of Stage1. This has helped with detection and Stage1 has a 4/66 detection rate on VirusTotal. I was comfortable uploading Stage1 given that is is already keyed to the original box it was ran on and the file signature constantly changes because of the AES encryption that happens.

I recently started paying attention to entropy as a means to detect malware; to try and lower the otherwise very high entropy that a giant AES encrypted binary blob gives an executable I looked into integrating shellcode stored as UUID's. Because the binary is stored in string representation, there is lower overall entropy in the executable. Using this technique The entropy of Stage0 is now ~6.8 and Stage1 ~4.5 (on a max scale of 8).

Finally it is a giant chore to integrate and produce a complete Stage0 due to all of the pieces that must be manipulated. To make this easier I made a builder application that will ingest a Stage0.c template file, a Stage1 stub, a Stage2 stub, and a raw shellcode file (this was build around Stage2 being a shellcode runner containing CobaltStrike shellcode) and produce a compiled Stage0 payload for use on target.

Technical Details

The Reflective DLL code from Stephen Fewer contains some Visual Studio compiler-specific instructions; I'm sure it is possible to port the technique over to MingW but I do not have the skills to do so. The main problem here is that the CobaltStrike shellcode (stageless is ~265K) needs to go inside the RDLL and be compiled. To get around this and integrate it nicely with the rest of the process I wrote my Stage2 RDLL to contain a global variable chunk of memory that is the size of the CS shellcode; this ~265K chunk of memory has a small placeholder in it that can be located in the compiled binary. The code in src/Stage2 has this added already.

Once compiled, this Stage2stub is transfered to kali where a binary patch may be performed to stick the real CS shellcode into the place in memory that it belongs. This produces the complete Stage2.

To avoid the I/O and CreateProcess fiasco previously described, the complete Stage2 must also be patched into the compiled Stage1 by Stage0; this is necessary in order to allow Stage2 to be encrypted once on-target in addition to preventing Stage2 from being stored separately on disk. The same concept previously described for Stage2 is conducted by Stage0 on target in order to assemble the final Stage1 payload. It should be noted that the memmem function is used in order to locate the placeholder within each stub; this function is no available on Windows, so a custom implementation was used. Thanks to Foxik384 for his code.

In order to perform a binary patch, we must allocate the required memory up front; this has a compounding effect, as Stage1 must now be big enough to also contain Stage2. With the added step of converting Stage2 to a UUID string, Stage2 balloons in size as does Stage1 in order to hold it. A stage2 RDLL with a compiled size of ~290K results in a Stage0 payload of ~1.38M, and a Stage1 payload of ~700K.

The builder application only supports creating x64 EXE's. However with a little more work in theory you could make Stage0 a DLL, as well as Stage1, and have the whole lifecycle exist as a DLL hijack instead of a standalone executable.

Instructions

These instructions will get you on your way to using this POC.

  1. Compile Builder using gcc -o builder src/Builder/BeatRevV2Builder.c
  2. Modify sc_length variable in src/Stage2/dll/src/ReflectiveDLL.c to match the length of raw shellcode file used with builder ( I have included fakesc.bin for example)
  3. Compile Stage2 (in visual studio, ReflectiveDLL project uses some VS compiler-specific instructions)
  4. Move compiled stage2stub.dll back to kali, modify src/Stage1/newstage1.c and define stage2size as the size of stage2stub
  5. Compile stage1stub using x86_64-w64-mingw32-gcc newstage1.c -o stage1stub.exe -s -DUNICODE -Os -L /usr/x86_64-w64-mingw32/lib -l:librpcrt4.a
  6. Run builder using syntax: ./builder src/Stage0/newstage0_exe.c x64 stage1stub.exe stage2stub.dll shellcode.bin
  7. Builder will produce dropper.exe. This is a formatted and compiled Stage0 payload for use on target.

BeatRev Original Release

Introduction

About 6 months ago it occured to me that while I had learned and done a lot with malware concerning AV/EDR evasion, I had spent very little time concerned with trying to evade or defeat reverse engineering/malware analysis. This was for a few good reasons:

  1. I don't know anything about malware analysis or reverse engineering
  2. When you are talking about legal, sanctioned Red Team work there isn't really a need to try and frustrate or defeat a reverse engineer because the activity should have been deconflicted long before it reaches that stage.

Nonetheless it was an interesting thought experiment and I had a few colleagues who DO know about malware analysis that I could bounce ideas off of. It seemed a challenge of a whole different magnitude compared to AV/EDR evasion and one I decided to take a stab at.

Premise

My initial premise was that the malware, on the first time of being ran, would somehow "key" itself to that victim machine; any subsequent attempts to run it would evaluate something in the target environment and compare it for a match in the malware. If those two factors matched, it executes as expected. If they do not (as in the case where the sample had been transfered to a malware analysts sandbox), the malware deletes itself (Once again heavily leaning on the work of LloydLabs and his delete-self-poc).

This "key" must be something "unique" to the victim computer. Ideally it will be a combination of several pieces of information, and then further obfuscated. As an example, we could gather the hostname of the computer as well as the amount of RAM installed; these two values can then be concatenated (e.g. Client018192MB) and then hashed using a user-defined function to produce a number (e.g. 5343823956).

There are a ton of choices in what information to gather, but thought should be given as to what values a Blue Teamer could easily spoof; a MAC address for example may seem like an attractive "unique" identifier for a victim, however MAC addresses can easily be set manually in order for a Reverse Engineer to match their sandbox to the original victim. Ideally the values chosen and enumerated will be one that are difficult for a reverse engineer to replicate in their environment.

With some self-deletion magic, the malware could read itself into a buffer, locate a placeholder variable and replace it with this number, delete itself, and then write the modified malware back to disk in the same location. Combined with an if/else statement in Main, the next time the malware runs it will detect that it has been ran previously and then go gather the hostname and amount of RAM again in order to produce the hashed number. This would then be evaluated against the number stored in the malware during the first run (5343823956). If it matches (as is the case if the malware is running on the same machine as it originally did), it executes as expected however if a different value is returned it will again call the self-delete function in order to remove itself from disk and protect the author from the malware analyst.

This seemed like a fine idea in theory until I spoke with a colleague who has real malware analysis and reverse engineering experience. I was told that a reverse engineer would be able to observe the conditional statement in the malware (if ValueFromFirstRun != GetHostnameAndRAM()), and seeing as the expected value is hard-coded on one side of the conditional statement, simply modify the registers to contain the expected value thus completely bypassing the entire protection mechanism.

This new knowledge completely derailed the thought experiment and seeing as I didn't really have a use for a capability like this in the first place, this is where the project stopped for ~6 months.

Overview

This project resurfaced a few times over the intervening 6 months but each time was little more than a passing thought, as I had gained no new knowledge of reversing/malware analysis and again had no need for such a capability. A few days ago the idea rose again and while still neither of those factors have really changed, I guess I had a little bit more knowledge under my belt and couldn't let go of the idea this time.

With the aforementioned problem regarding hard-coding values in mind, I ultimately decided to go for a multi-stage design. I will refer to them as Stage0, Stage1, and Stage2.

Stage0: Setup. Ran on initial infection and deleted afterwards

Stage1: Runner. Ran each subsequent time the malware executes

Stage2: Payload. The malware you care about protecting. Spawns a process and injects shellcode in order to return a Beacon.

Lifecycle

Stage0

Stage0 is the fresh executable delivered to target by the attacker. It contains Stage1 and Stage2 as AES encrypted byte arrays; this is done to protect the malware in transit, or should a defender somehow get their hands on a copy of Stage0 (which shouldn't happen). The AES Key and IV are contained within Stage0 so in reality this won't protect Stage1 or Stage2 from a competent Blue Teamer.

Stage0 performs the following actions:

  1. Sandbox evasion.
  2. Delete itself from disk. It is still running in memory.
  3. Decrypts Stage1 using stored AES Key/IV and writes to disk in place of Stage0.
  4. Gathers the processor name and the Microsoft ProductID.
  5. Hashes this value and then pads it to fit a 16 byte AES key length. This value reversed serves as the AES IV.
  6. Decrypts Stage2 using stored AES Key/IV.
  7. Encrypts Stage2 using new victim-specific AES Key/IV.
  8. Writes Stage2 to disk as an alternate data stream of Stage1.

At the conclusion of this sequence of events, Stage0 exits. Because it was deleted from disk in step 2 and is no longer running in memory, Stage0 is effectively gone; Without prior knowledge of this technique the rest of the malware lifecycle will be a whole lot more confusing than it already is.

In step 4 the processor name and Microsoft ProductID are gathered; the ProductID is retreived from the Registry, and this value can be manually modified which presents and easy opportunity for a Blue Teamer to match their sandbox to the target environment. Depending on what environmental information is gathered this can become easier or more difficult.

Stage1

Stage1 was dropped by Stage0 and exists in the same exact location as Stage0 did (to include the name). Stage2 is stored as an ADS of Stage1. When the attacker/persistence subsequently executes the malware, they are executing Stage1.

Stage1 performs the following actions:

  1. Sandbox evasion.
  2. Gathers the processor name and the Microsoft ProductID.
  3. Hashes this value and then pads it to fit a 16 byte AES key length. This value reversed serves as the AES IV.
  4. Reads Stage2 from Stage1's ADS into memory.
  5. Decrypts Stage2 using the victim-specific AES Key/IV.
  6. Checks first two bytes of decryted Stage2 buffer; if not MZ (unsuccessful decryption), delete Stage1/Stage2, exit.
  7. Writes decrypted Stage2 back to disk as ADS of Stage1
  8. Calls CreateProcess on Stage2. If this fails (unsuccessful decryption), delete Stage1/Stage2, exit.
  9. Sleeps 5 seconds to allow Stage2 to execute + exit so it can be overwritten.
  10. Encrypts Stage2 using victim-specific AES Key/IV
  11. Writes encrypted Stage2 back to disk as ADS of Stage1.

Note that Stage2 MUST exit in order for it to be overwritten; the self-deletion trick does not appear to work on files that are already ADS's, as the self-deletion technique relies on renaming the primary data stream of the executable. Stage2 will ideally be an inject or spawn+inject executable.

There are two points that Stage1 could detect that it is not being ran from the same victim and delete itself/Stage2 in order to protect the threat actor. The first is the check for the executable header after decrypting Stage2 using the gathered environmental information; in theory this step could be bypassed by a reverse engineer, but it is a first good check. The second protection point is the result of the CreateProcess call- if it fails because Stage2 was not properly decrypted, the malware is similiary deleted. The result of this call could also be modified to prevent deletion by the reverse engineer, however this doesn't change the fact that Stage2 is encrypted and inaccessible.

Stage2

Stage2 is the meat and potatoes of the malware chain; It is a fully fledged shellcode runner/piece of malware itself. By encrypting and protecting it in the way that we have, the actions of the end state malware are much better obfuscated and protected from reverse engineers and malware analysts. During development I used one of my existing shellcode runners containing CobaltStrike shellcode, but this could be anything the attacker wants to run and protect.

Impact, Mitigation, and Further Work

So what is actually accomplished with a malware lifecycle like this? There are a few interesting quirks to talk about.

Alternate data streams are a feature unique to NTFS file systems; this means that most ways of transfering the malware after initial infection will strip and lose Stage2 because it is an ADS of Stage1. Special care would have to be given in order to transfer the sample in order to preserve Stage2, as without it a lot of reverse engineers and malware analysts are going to be very confused as to what is happening. RAR archives are able to preserve ADS's and tools like 7Z and Peazip can extract files and their ADS's.

As previously mentioned, by the time malware using this lifecycle hits a Blue Teamer it should be at Stage1; Stage0 has come and gone, and Stage2 is already encrypted with the environmental information gathered by stage 0. Not knowing that Stage0 even existed will add considerable uncertainty to understanding the lifecycle and decrypting Stage2.

In theory (because again I have no reversing experience), Stage1 should be able to be reversed (after the Blue Teamers rolls through a few copies of it because it keeps deleting itself) and the information that Stage1 gathers from the target system should be able to be identified. Provided a well-orchestrated response, Blue Team should be able to identify the victim that the malware came from and go and gather that information from it and feed it into the program so that it may be transformed appropriately into the AES Key/IV that decrypts Stage2. There are a lot "ifs" in there however related to the relative skill of the reverse engineer as well as the victim machine being available for that information to be recovered.

Application Whitelisting would significantly frustrate this lifecycle. Stage0/Stage1 may be able to be side loaded as a DLL, however I suspect that Stage2 as an ADS would present some issues. I do not have an environment to test malware against AWL nor have I bothered porting this all to DLL format so I cannot say. I am sure there are creative ways around these issues.

I am also fairly confident that there are smarter ways to run Stage2 than dropping to disk and calling CreateProcess; Either manually mapping the executable or using a tool like Donut to turn it into shellcode seem like reasonable ideas.

Code and binary

During development I created a Builder application that Stage1 and Stage2 may be fed to in order to produce a functional Stage0; this will not be provided however I will be providing most of the source code for stage1 as it is the piece that would be most visible to a Blue Teamer. Stage0 will be excluded as an exercise for the reader, and stage2 is whatever standalone executable you want to run+protect. This POC may be further researched at the effort and discretion of able readers.

I will be providing a compiled copy of this malware as Dropper64.exe. Dropper64.exe is compiled for x64. Dropper64.exe is Stage0; it contains Stage1 and Stage2. On execution, Stage1 and Stage2 will drop to disk but will NOT automatically execute, you must run Dropper64.exe(now Stage1) again. Stage2 is an x64 version of calc.exe. I am including this for any Blue Teamers who want to take a look at this, but keep in mind in an incident response scenario 99& of the time you will be getting Stage1/Stage2, Stage0 will be gone.

Conclusion

This was an interesting pet project that ate up a long weekend. I'm sure it would be a lot more advanced/more complete if I had experience in a debugger and disassembler, but you do the best with what you have. I am eager to hear from Blue Teamers and other Malware Devs what they think. I am sure I have over-complicatedly re-invented the wheel here given what actual APT's are doing, but I learned a few things along the way. Thank you for reading!


Mitmproxy2Swagger - Automagically Reverse-Engineer REST APIs Via Capturing Traffic


A tool for automatically converting mitmproxy captures to OpenAPI 3.0 specifications. This means that you can automatically reverse-engineer REST APIs by just running the apps and capturing the traffic.


Installation

First you will need python3 and pip3.

$ pip install mitmproxy2swagger 
# ... or ...
$ pip3 install mitmproxy2swagger

Then clone the repo and run mitmproxy2swagger as per examples below.

Usage

Mitmproxy

To create a specification by inspecting HTTP traffic you will need to:

  1. Capture the traffic by using the mitmproxy tool. I personally recommend using mitmweb, which is a web interface built-in to mitmproxy.

    $ mitmweb
    Web server listening at http://127.0.0.1:8081/
    Proxy server listening at http://*:9999
    ...

    IMPORTANT

    To configure your client to use the proxy exposed by mitm proxy, please consult the mitmproxy documentation for more information.

  2. Save the traffic to a flow file.

    In mitmweb you can do this by using the "File" menu and selecting "Save":

  3. Run the first pass of mitmproxy2swagger:

    $ mitmproxy2swagger -i <path_to_mitmptoxy_flow> -o <path_to_output_schema> -p <api_prefix>

    Please note that you can use an existing schema, in which case the existing schema will be extended with the new data. You can also run it a few times with different flow captures, the captured data will be safely merged.

    <api_prefix> is the base url of the API you wish to reverse-engineer. You will need to obtain it by observing the requests being made in mitmproxy.

    For example if an app has made requests like these:

    https://api.example.com/v1/login
    https://api.example.com/v1/users/2
    https://api.example.com/v1/users/2/profile

    The likely prefix is https://api.example.com/v1.

  4. Running the first pass should have created a section in the schema file like this:

    x-path-templates:
    # Remove the ignore: prefix to generate an endpoint with its URL
    # Lines that are closer to the top take precedence, the matching is greedy
    - ignore:/addresses
    - ignore:/basket
    - ignore:/basket/add
    - ignore:/basket/checkouts
    - ignore:/basket/coupons/attach/{id}
    - ignore:/basket/coupons/attach/104754

    You should edit the schema file with a text editor and remove the ignore: prefix from the paths you wish to be generated. You can also adjust the parameters appearing in the paths.

  5. Run the second pass of mitmproxy2swagger:

    $ mitmproxy2swagger -i <path_to_mitmptoxy_flow> -o <path_to_output_schema> -p <api_prefix> [--examples]

    Run the command a second time (with the same schema file). It will pick up the edited lines and generate endpoint descriptions.

    Please note that mitmproxy2swagger will not overwrite existing endpoint descriptions, if you want to overwrite them, you can delete them before running the second pass.

    Passing --examples will add example data to requests and responses. Take caution when using this option, as it may add sensitive data (tokens, passwords, personal information etc.) to the schema.

HAR

  1. Capture and export the traffic from the browser DevTools.

    In the browser DevTools, go to the Network tab and click the "Export HAR" button.

  2. Continue the same way you would do with the mitmproxy dump. mitmproxy2swagger will automatically detect the HAR file and process it.

Example output

See the examples. You will find a generated schema there and an html file with the generated documentation (via redoc-cli).

See the generated html file here.


BinAbsInspector - Vulnerability Scanner For Binaries


BinAbsInspector (Binary Abstract Inspector) is a static analyzer for automated reverse engineering and scanning vulnerabilities in binaries, which is a long-term research project incubated at Keenlab. It is based on abstract interpretation with the support from Ghidra. It works on Ghidra's Pcode instead of assembly. Currently it supports binaries on x86,x64, armv7 and aarch64.


Installation

  • Install Ghidra according to Ghidra's documentation
  • Install Z3 (tested version: 4.8.15)
  • Note that generally there are two parts for Z3 library: one is Java package, the other one is native library. The Java package is already included in "/lib" directory, but we suggest that you replace it with your own Java package for version compatibility.
    • For Windows, download a pre-built package from here, extract the zip file and add a PATH environment variable pointing to z3-${version}-win/bin
    • For Linux, install with package manager is NOT recommended, there are two options:
      1. You can download suitable pre-build package from here, extract the zip file and copy z3-${version}-win/bin/*.so to /usr/local/lib/
      2. or you can build and install z3 according to Building Z3 using make and GCC/Clang
    • For MacOS, it is similar to Linux.
  • Download the extension zip file from release page
  • Install the extension according to Ghidra Extension Notes

Building

Build the extension by yourself, if you want to develop a new feature, please refer to development guide.

  • Install Ghidra and Z3
  • Install Gradle 7.x (tested version: 7.4)
  • Pull the repository
  • Run gradle buildExtension under repository root
  • The extension will be generated at dist/${GhidraVersion}_${date}_BinAbsInspector.zip

Usage

You can run BinAbsInspector in headless mode, GUI mode, or with docker.

  • With Ghidra headless mode.
$GHIDRA_INSTALL_DIR/support/analyzeHeadless <projectPath> <projectName> -import <file> -postScript BinAbsInspector "@@<scriptParams>"

<projectPath> -- Ghidra project path.
<projectName> -- Ghidra project name.
<scriptParams> -- The argument for our analyzer, provides following options:

Parameter Description
[-K <kElement>] KSet size limit K
[-callStringK <callStringMaxLen>] Call string maximum length K
[-Z3Timeout <timeout>] Z3 timeout
[-timeout <timeout>] Analysis timeout
[-entry <address>] Entry address
[-externalMap <file>] External function model config
[-json] Output in json format
[-disableZ3] Disable Z3
[-all] Enable all checkers
[-debug] Enable debugging log output
[-check "<cweNo1>[;<cweNo2>...]"] Enable specific checkers
  • With Ghidra GUI

    1. Run Ghidra and import the target binary into a project
    2. Analyze the binary with default settings
    3. When the analysis is done, open Window -> Script Manager and find BinAbsInspector.java
    4. Double-click on BinAbsInspector.java entry, set the parameters in configuration window and click OK
    5. When the analysis is done, you can see the CWE reports in console window, double-click the addresses from the report can jump to corresponding address
  • With Docker

git clone git@github.com:KeenSecurityLab/BinAbsInspector.git
cd BinAbsInspector
docker build . -t bai
docker run -v $(pwd):/data/workspace bai "@@<script parameters>" -import <file>

Implemented Checkers

So far BinAbsInspector supports following checkers:

  • CWE78 (OS Command Injection)
  • CWE119 (Buffer Overflow (generic case))
  • CWE125 (Buffer Overflow (Out-of-bounds Read))
  • CWE134 (Use of Externally-Controlled Format string)
  • CWE190 (Integer overflow or wraparound)
  • CWE367 (Time-of-check Time-of-use (TOCTOU))
  • CWE415 (Double free)
  • CWE416 (Use After Free)
  • CWE426 (Untrusted Search Path)
  • CWE467 (Use of sizeof() on a pointer type)
  • CWE476 (NULL Pointer Dereference)
  • CWE676 (Use of Potentially Dangerous Function)
  • CWE787 (Buffer Overflow (Out-of-bounds Write))

Project Structure

The structure of this project is as follows, please refer to technical details for more details.

β”œβ”€β”€ main
β”‚ β”œβ”€β”€ java
β”‚ β”‚ └── com
β”‚ β”‚ └── bai
β”‚ β”‚ β”œβ”€β”€ checkers checker implementatiom
β”‚ β”‚ β”œβ”€β”€ env
β”‚ β”‚ β”‚ β”œβ”€β”€ funcs function modeling
β”‚ β”‚ β”‚ β”‚ β”œβ”€β”€ externalfuncs external function modeling
β”‚ β”‚ β”‚ β”‚ └── stdfuncs cpp std modeling
β”‚ β”‚ β”‚ └── region memory modeling
β”‚ β”‚ β”œβ”€β”€ solver analyze core and grpah module
β”‚ β”‚ └── util utilities
β”‚ └── resources
└── test

You can also build the javadoc with gradle javadoc, the API documentation will be generated in ./build/docs/javadoc.

Acknowledgement

We employ Ghidra as our foundation and frequently leverage JImmutable Collections for better performance.
Here we would like to thank them for their great help!


Frida-Ios-Hook - A Tool That Helps You Easy Trace Classes, Functions, And Modify The Return Values Of Methods On iOS Platform


A tool that helps you can easy using frida. It support script for trace classes, functions, and modify the return values of methods on iOS platform.


For Android platform: frida-android-hook


For Intercept Api was encrypted on iOS application: frida-ios-interceprt-api

Env OS Support

OS Supported Noted
MacOS
βœ…
main
Linux
βœ…
sub
Windows
βœ…
sub

Compatible with

iOS Frida Supported
13.2.3 14.2.13
βœ…
14.4.2 14.2.13
βœ…
14.4.2 15.0.18
βœ…

Feature

Running with python3.x

Support both spawn & attach script to process.

[+] Options:

-p(--package) Identifier of application ex: com.apple.AppStore
-n(--name) Name of application ex: AppStore
-s(--script) Using script format script.js
-c(--check-version) Check for the newest version
-u(--upadte) Update to the newest version

[*] Dump decrypt IPA:

-d, --dump Dump decrypt application.ipa
-o OUTPUT_IPA, --output=OUTPUT_IPA
Specify name of the decrypted IPA

[*] Dump memory of Application:

--dump-memory Dump memory of application

[*] HexByte Scan IPA:
--hexbyte-scan Scan or Patch IPA with byte patterns
--pattern=PATTERN Pattern for hexbytescan
--address=ADDRESS Address for hexbytescan
-t TASK, --task=TASK
Task for hexbytescan

[*] Information:

--list-devices List All Devices
--list-apps List The Installed apps
--list -appinfo List Info of Apps on Itunes
--list-scripts List All Scripts
--logcat Show system log of device
--shell Get the shell of connect device

[*] Quick method:

-m(--method) Support commonly used methods
app-static(-n)
bypass-jb(-p)
bypass-ssl(-p)
i-url-req(-n)
i-crypto(-p)

ο“œ
ChangeLog

Version: 3.6

	[+] Add:

[-] New option Show system log of device `--logcat`

[-] New option Get the shell of connect device `--shell`

[-] Add CHANGELOG.md


[+] Change:

[-] Update README.md

[-] Using `hook.json` to load configuration for the tool

[-] Optimize core `hook.py`

[+] Fix

See Full ChangeLog

Install

	[+] Latest version

https://github.com/noobpk/frida-ios-hook/releases

[+] Develop version

git clone -b dev https://github.com/noobpk/frida-ios-hook

Build

1. cd frida-ios-hook/
2. pip3 install -r requirements.txt
3. python3 setup.py
4. cd frida-ios-hook

Usage

See Full Usage as Wiki

If you run the script but it doesn't work, you can try the following: frida -U -f package -l script.js

ο“Ί
Demo Feature

Title Link
Frida iOS Hook | Basic Usage | Install - List devices - List apps - List scripts - Logcat - Shell https://youtu.be/xSndHgTdv4w
Frida iOS Hook | Basic Usage | Dump Decrypt IPA - Dump Memory App - Hexbyte-Scan IPA https://youtu.be/AUsJ9_gnWAI
Frida iOS Hook | Basic Usage | App Static - Bypass Jailbreak - Bypass SSL - Intercept URL + Crypto https://youtu.be/nWhKDSzArf8

Frida-Script

Updated some frida scripts to help you with the pentest ios app. Filter script using spawn(S) or attach(A)

N Spawn/Attach Script Name Script Description Script Version
1 S backtrace.js Backtrace 1.0
2 S bypass-flutter-ssl.js Flutter bypass ssl pinning 1.0
3 S bypass-jailbreak-1.js Basic bypass jailbreak detection 1.0
4 S bypass-ssl-ios13.js iOS 13 bypass ssl pinning 1.0
5 S dump-ios-url-scheme.js Dump iOS url scheme when "openURL" is called 1.0
6 S dump-ui.js Dump the current on-screen User Interface structure 1.0
7 S+A find-all-classes-methods.js Dump all methods inside all classes 1.0
8 S+A find-all-classes.js Dump all classes used by the app 1.0
9 S+A find-app-classes-methods.js Dump all methods inside classes owned by the app only 1.0
10 S+A find-app-classes.js Dump classes owned by the app only 1.0
11 S+A find-specific-method.js Find a specific method in all classes 1.0
12 S+A flutter_trace_function.js iOS flutter trace function 1.0
13 S+A hook-all-methods-of-all-classes-app-only.js Hook all the methods of all the classes owned by the app 1.0
14 S+A hook-all-methods-of-specific-class.js Hook all the methods of a particular class 1.0
15 S+A hook-specific-method-of-class.js Hook a particular method of a specific class 1.0
16 S+A intercept-nslog.js Intercept calls to Apple's NSLog logging function 1.0
17 S+A ios-app-static-analysis.js iOS app static analysis 1.0
18 S ios-biometric-bypass.js iOS Biometric Bypass 1.0
19 S+A ios-intercept-crypto-2.js iOS Intercepts Crypto Operations 2 1.0
20 S+A ios-intercept-crypto.js iOS Intercepts Crypto Operations 1.0
21 S+A ios-list-apps.js iOS List Application 1.0
22 S+A ios-url-scheme-fuzzing.js iOS URL Scheme Fuzzing 1.0
23 S+A pasteboard-monitoring.js Monitor usage of pasteboard. Useful to show lack of secure attribute on sensitive fields allowing data copying. 1.0
24 S+A raptor_frida_ios_autoIntercept.js Raptor frida ios auto intercept 1.0
25 S+A raptor_frida_ios_bypass1.js Raptor frida ios bypass 1 1.0
26 S+A raptor_frida_ios_bypass2.js Raptor frida ios bypass 2 1.0
27 S+A raptor_frida_ios_call.js Raptor frida ios call 1.0
28 S+A raptor_frida_ios_debug.js Raptor frida ios debug 1.0
29 S+A raptor_frida_ios_enum.js Raptor frida ios enum 1.0
30 S+A raptor_frida_ios_lowlevel1.js Raptor frida ios low level 1 1.0
31 S+A raptor_frida_ios_lowlevel2.js Raptor frida ios low level 2 1.0
32 S+A raptor_frida_ios_stalker.js Raptor frida ios stalker 1.0
33 S+A raptor_frida_ios_touchid.js Raptor frida ios touchid 1.0
34 S+A raptor_frida_ios_trace.js Raptor frida ios trace 1.0
35 S+A read-nsuserdefaults.js Show contents of NSUserDefaults 1.0
36 S+A read-plist-file.js Show contents of a Plist file 1.0
37 S replace-exported-method.js Replace a module's exported function 1.0
38 S+A show-all-methods-of-specific-class.js Dump all methods of a particular class 1.0
39 S+A show-argument-type-count-and-return-value-type.js Show argument type & count and type of return value for a function in a class 1.0
40 S+A show-instance-variables-for-specific-class.js Show all instance variables of a particular class 1.0
41 S+A show-modify-function-arguments.js Show and modify arguments of a function inside a class 1.0
42 S+A show-modify-method-return-value.js Show and modify return value of a particular method inside a class 1.0
43 S+A show_binarycookies.js Show contents of Cookies.binarycookies file 1.0

Hexbytescan-Task

N Task Name Task Description
1 openssl_hook.json OpenSSL 1.0.2 certificate pinning hook on arm64
2 openssl_1_1_0_hook.json OpenSSL 1.1.0 certifiate pinning hook for arm64, it modifies cmp instruction in tls_process_server_certificate method
3 openssl_hook_v2.json OpenSSL 1.0.2 certificate pinning hook on arm64, improved pattern, possibly for different compiler version or slighlty updated OpenSSL, use if first version does not find patch location. These hooks patch call to ssl_verify_cert_chain in ssl3_get_server_certificate.

Disclaimer

Because I am not a developer, so my coding skills might not be the best. Therefore, if this tool have any issue or not working for you, create an issue and i will try to fix it. Any suggestions for new feature and discussions are welcome!


DroidDetective - A Machine Learning Malware Analysis Framework For Android Apps


A machine learning malware analysis framework for Android apps.

DroidDetective is a Python tool for analysing Android applications (APKs) for potential malware related behaviour and configurations. When provided with a path to an application (APK file) Droid Detective will make a prediction (using it's ML model) of if the application is malicious. Features and qualities of Droid Detective include:

  • Analysing which of ~330 permissions are specified in the application's AndroidManifest.xml file.
  • Analysing the number of standard and proprietary permissions in use in the application's AndroidManifest.xml file.
  • Using a RandomForest machine learning classifier, trained off the above data, from ~14 malware families and ~100 Google Play Store applications.

Getting Started

Installation

All DroidDetective dependencies can be installed manually or via the requirements file, with

pip install -r REQUIREMENTS.txt

DroidDetective has been tested on both Windows 10 and Ubuntu 18.0 LTS.

Usage

DroidDetective can be run by providing the Python file with an APK as a command line parameter, such as:

python DroidDetective.py myAndroidApp.apk

If an apk_malware.model file is not present, then the tooling will first train the model and will require a training set of APKs in both a folder at the root of the project called malware and another called normal. Once run successfully a result will be printed onto the CLI on if the model has identified the APK to be malicious or benign. An example of this output can be seen below:

>> Analysed file 'com.android.camera2.apk', identified as not malware.

An additional parameter can be provided to DroidDetective.py as a Json file to save the results to. If this Json file already exists the results of this run will be appended to the Json file.

python DroidDetective.py myAndroidApp.apk output.json

An example of this output Json is as follows:

{
"com.android.camera2": false,
}

Data Science | The ML Model

DroidDetective is a Python tool for analyzing Android applications (APKs) for potential malware related behaviour. This works by training a Random Forest classifier on information derived from both known malware APKs and standard APKs available on the Android app store. This tooling comes pre-trained, however, the model can be re-trained on a new dataset at any time.

This model currently uses permissions from an APKs AndroidManifest.xml file as a feature set. This works by creating a dictionary of each standard Android permission and setting the feature to 1 if the permission is present in the APK. Similarly, a feature is added for the amount of permissions in use in the manifest and for the amount of unidentified permissions found in the manifest.

The pre-trained model was trained off approximately 14 malware families (each with one or more APK files), located from ashisdb's repository, and approximately 100 normal applications located from the Google Play Store.

The below denotes the statistics for this ML model:

Accuracy: 0.9310344827586207
Recall: 0.9166666666666666
Precision: 0.9166666666666666
F-Measure: 0.9166666666666666

The top 10 highest weighted features (i.e. Android permissions) used by this model, for identifying malware, can be seen below:

❌