![]()
PortEx is a Java library for static malware analysis of Portable Executable files. Its focus is on PE malformation robustness, and anomaly detection. PortEx is written in Java and Scala, and targeted at Java applications.
For more information have a look at PortEx Wiki and the Documentation
PortexAnalyzer CLI is a command line tool that runs the library PortEx under the hood. If you are looking for a readily compiled command line PE scanner to analyse files with it, download it from here PortexAnalyzer.jar
The GUI version is available here: PortexAnalyzerGUI
You can include PortEx to your project by adding the following Maven dependency:
<dependency>
   <groupId>com.github.katjahahn</groupId>
   <artifactId>portex_2.12</artifactId>
   <version>4.0.0</version>
</dependency>
To use a local build, add the library as follows:
<dependency>
   <groupId>com.github.katjahahn</groupId>
   <artifactId>portex_2.12</artifactId>
   <version>4.0.0</version>
   <scope>system</scope>
   <systemPath>$PORTEXDIR/target/scala-2.12/portex_2.12-4.0.0.jar</systemPath>
</dependency>
Add the dependency as follows in your build.sbt
libraryDependencies += "com.github.katjahahn" % "portex_2.12" % "4.0.0"
PortEx is build with sbt
To simply compile the project invoke:
$ sbt compile
To create a jar:
$ sbt package
To compile a fat jar that can be used as command line tool, type:
$ sbt assembly
You can create an eclipse project by using the sbteclipse plugin. Add the following line to project/plugins.sbt:
addSbtPlugin("com.typesafe.sbteclipse" % "sbteclipse-plugin" % "2.4.0")
Generate the project files for Eclipse:
$ sbt eclipse
Import the project to Eclipse via the Import Wizard.
I develop PortEx and PortexAnalyzer as a hobby in my freetime. If you like it, please consider buying me a coffee: https://ko-fi.com/struppigel
Karsten Hahn
Twitter: @Struppigel
Mastodon: struppigel@infosec.exchange
Youtube: MalwareAnalysisForHedgehogs

Pinacolada looks for typical IEEE 802.11 attacks and then informs you about them as quickly as possible. All this with the help of Hak5's WiFi Coconut, which allows it to listen for threats on all 14 channels in the 2.4GHz range simultaneously.
| Attack | Type | Status |
|---|---|---|
| Deauthentication | DoS | ✅ |
| Disassociation | DoS | ✅ |
| Authentication | DoS | ✅ |
| EvilTwin | MiTM | |
| KARMA | MiTM | |
pip install flask
brew install wireshark
pip install flask
apt install tshark
For both operating systems install the WiFi Coconut's userspace
# Download Pinacolada
git clone https://github.com/90N45-d3v/Pinacolada
cd Pinacolada

# Start Pinacolada
python main.py
Pinacolada will be accessible from your browser at 127.0.0.1:8888.
The default password is CoconutsAreYummy.
After you have logged in, you can see a dashboard on the start page and you should change the password in the settings tab.
If configured, Pinacolada will alert you to attacks via E-Mail. In order to send you an E-Mail, however, an E-Mail account for Pinacolada must be specified in the settings tab. To find the necessary information such as SMTP server and SMTP port, search the internet for your mail provider and how their SMTP servers are configured + how to use them. Here are some information about known providers:
| Provider | SMTP Server | SMTP Port (TLS) |
|---|---|---|
| Gmail | smtp.gmail.com | 587 |
| Outlook | smtp.office365.com | 587 |
| GoDaddy | smtpout.secureserver.net | 587 |
Since I don't own a WiFi Coconut myself, I have to simulate their traffic. So if you encounter any problems, don't hesitate to contact me and open an issue.
Security has two difficult tasks: designing smart ways of getting new information, and keeping track of findings to improve remediation efforts. With Faraday, you may focus on discovering vulnerabilities while we help you with the rest. Just use it in your terminal and get your work organized on the run. Faraday was made to let you take advantage of the available tools in the community in a truly multiuser way.
Faraday aggregates and normalizes the data you load, allowing exploring it into different visualizations that are useful to managers and analysts alike.

To read about the latest features check out the release notes!
The easiest way to get faraday up and running is using our docker-compose
$ wget https://raw.githubusercontent.com/infobyte/faraday/master/docker-compose.yaml
$ docker-compose up
If you want to customize, you can find an example config over here Link
You need to have a Postgres running first.
 $ docker run \
     -v $HOME/.faraday:/home/faraday/.faraday \
     -p 5985:5985 \
     -e PGSQL_USER='postgres_user' \
     -e PGSQL_HOST='postgres_ip' \
     -e PGSQL_PASSWD='postgres_password' \
     -e PGSQL_DBNAME='postgres_db_name' \
faradaysec/faraday:latest$ pip3 install faradaysec
$ faraday-manage initdb
$ faraday-serverYou can find the installers on our releases page
$ sudo apt install faraday-server_amd64.deb
# Add your user to the faraday group
$ faraday-manage initdb
$ sudo systemctl start faraday-server
Add your user to the faraday group and then run
If you want to run directly from this repo, this is the recommended way:
$ pip3 install virtualenv
$ virtualenv faraday_venv
$ source faraday_venv/bin/activate
$ git clone git@github.com:infobyte/faraday.git
$ pip3 install .
$ faraday-manage initdb
$ faraday-server
Check out our documentation for detailed information on how to install Faraday in all of our supported platforms
For more information about the installation, check out our Installation Wiki.
In your browser now you can go to http://localhost:5985 and login with "faraday" as username, and the password given by the installation process
Learn about Faraday holistic approach and rethink vulnerability management.
Setup Bandit and OWASP ZAP in your pipeline
Setup Bandit, OWASP ZAP and SonarQube in your pipeline
Faraday-cli is our command line client, providing easy access to the console tools, work in faraday directly from the terminal!
This is a great way to automate scans, integrate it to CI/CD pipeline or just get metrics from a workspace
$ pip3 install faraday-cliCheck our faraday-cli repo
Check out the documentation here.

Faraday Agents Dispatcher is a tool that gives Faraday the ability to run scanners or tools remotely from the platform and get the results.
Connect you favorite tools through our plugins. Right now there are more than 80+ supported tools, among which you will find:

Missing your favorite one? Create a Pull Request!
There are two Plugin types:
Console plugins which interpret the output of the tools you execute.
$ faraday-cli tool run \"nmap www.exampledomain.com\"
💻 Processing Nmap command
Starting Nmap 7.80 ( https://nmap.org ) at 2021-02-22 14:13 -03
Nmap scan report for www.exampledomain.com (10.196.205.130)
Host is up (0.17s latency).
rDNS record for 10.196.205.130: 10.196.205.130.bc.example.com
Not shown: 996 filtered ports
PORT     STATE  SERVICE
80/tcp   open   http
443/tcp  open   https
2222/tcp open   EtherNetIP-1
3306/tcp closed mysql
Nmap done: 1 IP address (1 host up) scanned in 11.12 seconds
⬆ Sending data to workspace: test
✔ Done
Report plugins which allows you to import previously generated artifacts like XMLs, JSONs.
faraday-cli tool report burp.xmlCreating custom plugins is super easy, Read more about Plugins.
You can access directly to our API, check out the documentation here.

Faraday was built from within the security community, to make vulnerability management easier and enhance our work. What IDEs are to programming, Faraday is to pentesting.
Offensive security had two difficult tasks: designing smart ways of getting new information, and keeping track of findings to improve further work.
This new update brings: New scanning, reporting and UI experience
Get your work organized and focus on what you do best. With Faradaycommunity, you may focus on pentesting while we help you with the rest..
Check out the documentation here.
The easiest way to get faraday up and running is using our docker-compose
# Docker-compose

    $ wget https://raw.githubusercontent.com/infobyte/faraday/master/docker-compose.yaml
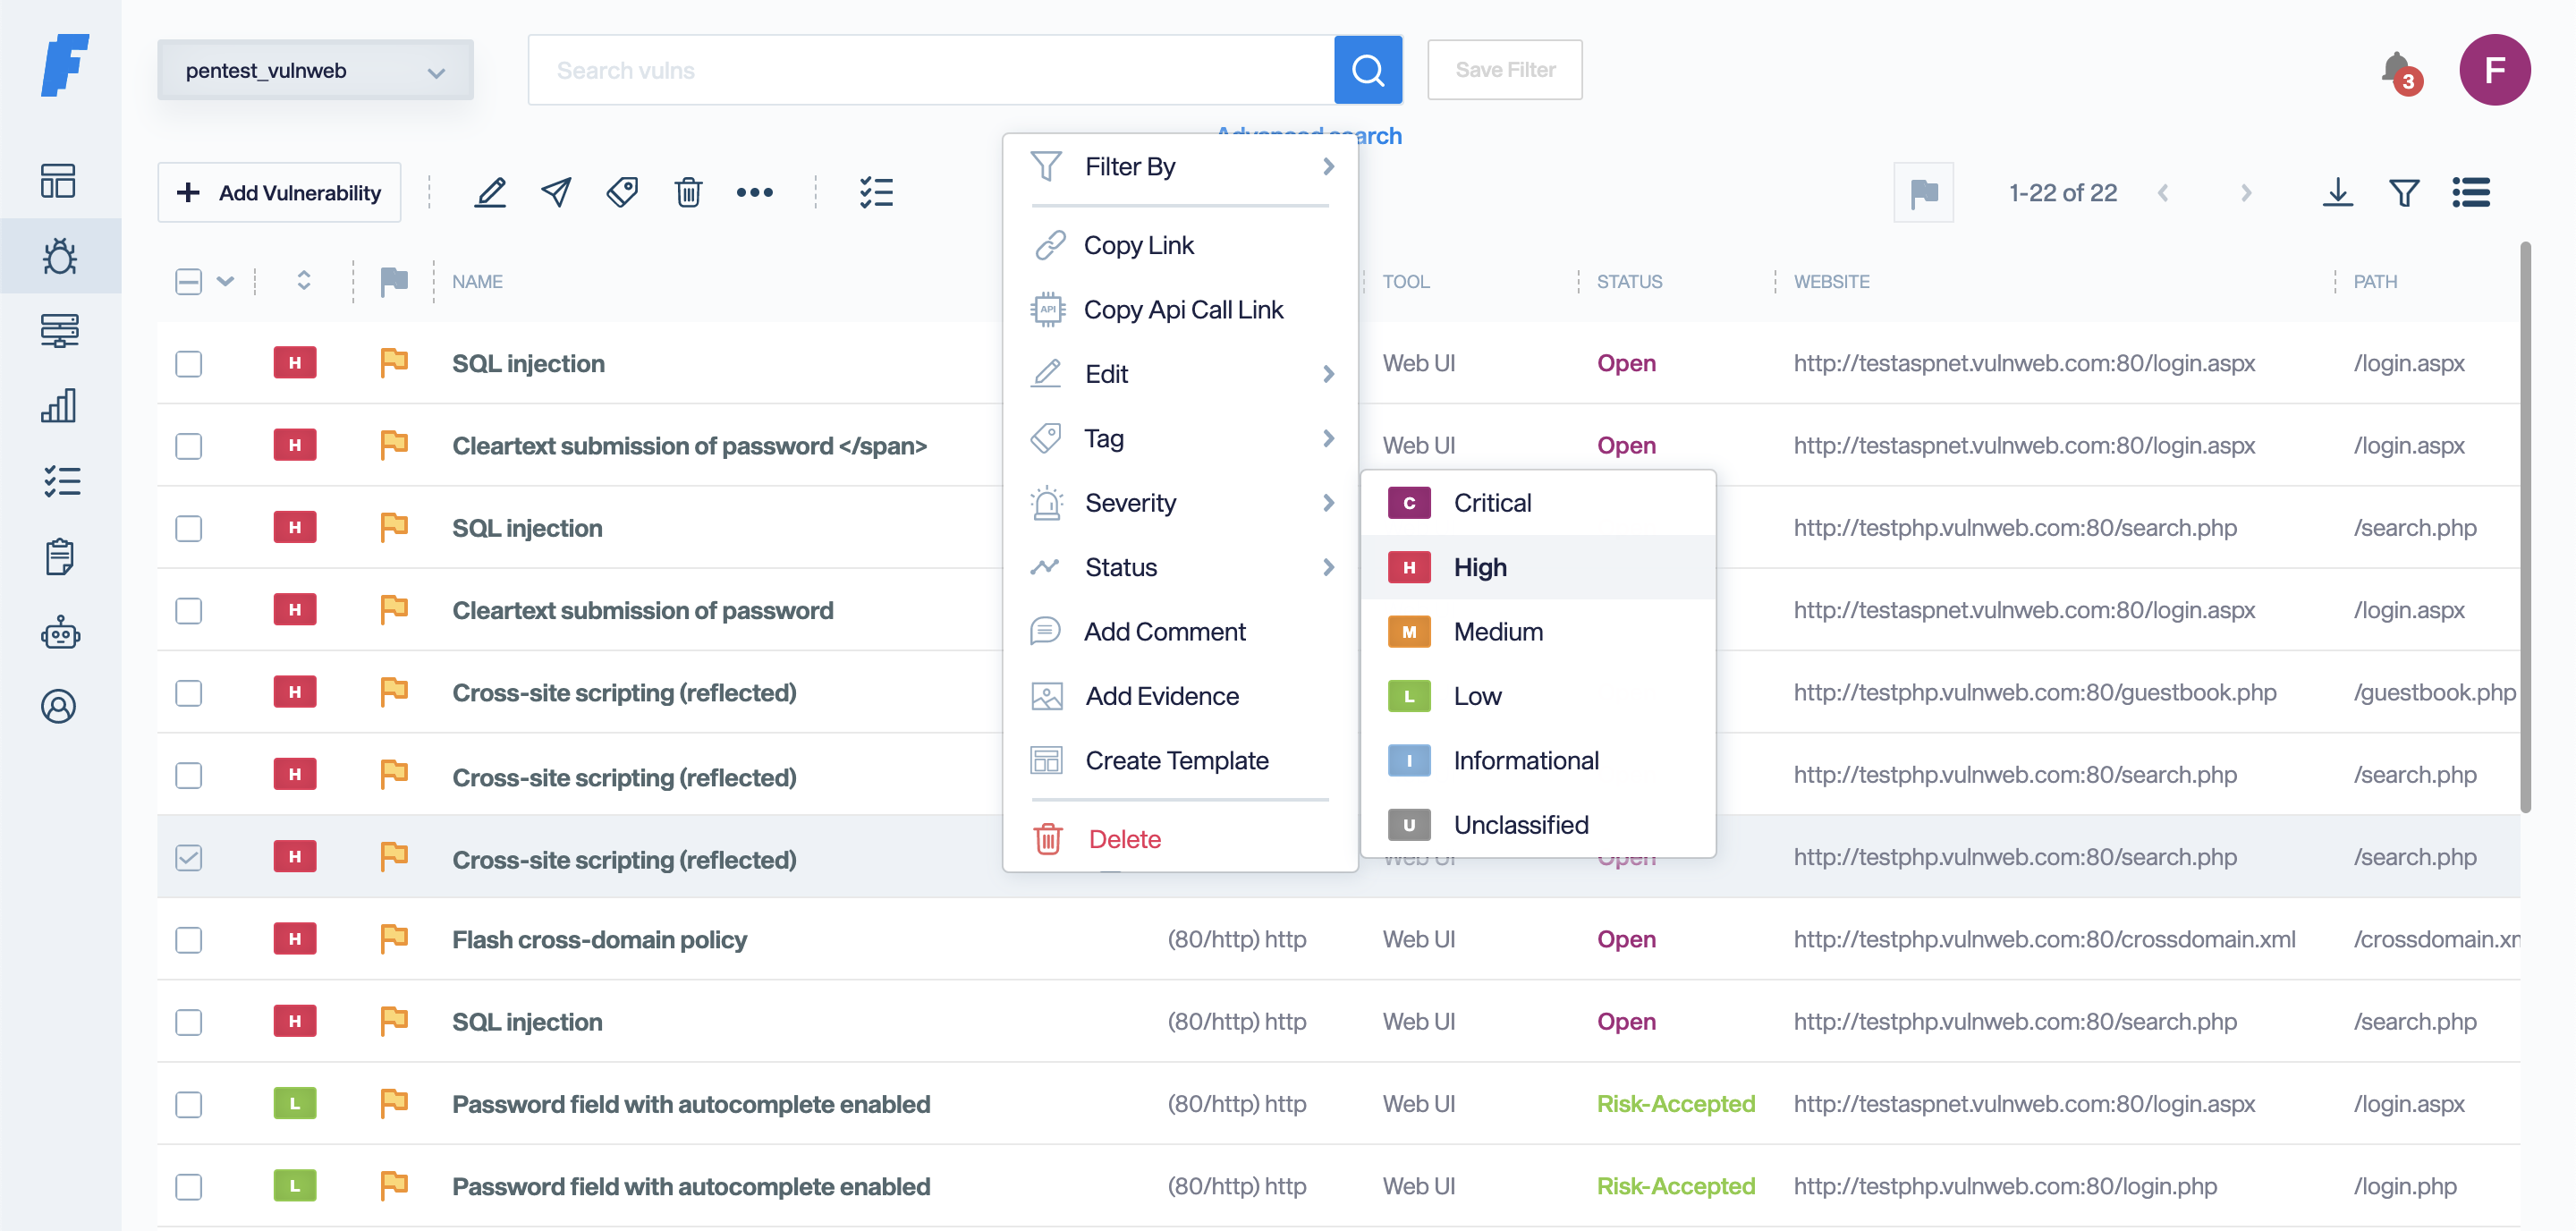
$ docker-compose upManage, classify and triage your results through Faraday’s dashboard, designed with and for pentesters.
Get an overview of your vulnerabilities and ease your work.


By right clicking on any vulnerability, you may filter, tag and classify your results with ease. You may also add comments to vulnerabilities and add evidence with just a few clicks

In the asset tab, information on each asset is presented, for a detailed follow-up on every device in your network. This insight might be especially useful if you hold critical data on certain assets, so the impact of vulnerabilities may be assessed through this information. If responsibilities over each asset are clear, this view helps to organize and follow the work of asset owners too.
Here, you can obtain information about the OS, services, ports and vulnerabilities associated with each of your assets, which will give you a better understanding of your scope and help you to gain an overview of what you are assessing.


Integrate scanners with Faraday Agents Dispatcher. This feature will allow you to orchestrate the most common used security tools and have averything available from your Faraday instance. Once your scan is finished, you will be able to see all the results in the main dashboard.

Choose the scanners that best fit your needs.

Once you’re done, export your results in a CSV format.
Check out some of our features
With Faraday, you may oversee your cybersecurity efforts, prioritize actions and manage your resources from a single platform.
Make sense of today’s overwhelming number of tools. Faraday’s technology aligns +80 key plugins with your current needs, normalizing and deduplicating vulnerabilities.
Save time by automating pivotal steps of Vulnerability Management. Scan, create reports, and schedule pipelines of custom actions, all following your requirements.
Faraday’s intuitive dashboard guides teams through vulnerability management with ease. Scan, analyze, automate, tag, and prioritize, each with just a few clicks.
Get full visibility of your security posture in real-time. Advanced filters, navigation, and analytics help you strategize and focus your work.
Coordinate efforts by sending tickets to Jira, Gitlab, and ServiceNow directly from Faraday.
Manage your security team with Faraday planner. Keep up by communicating with your peers and receiving notifications.
Get your work organized on the run when pentesting with Faraday CLI.
We believe in the power of teams, most of our integrations and core technologies are open source, allowing any team to build custom implementations and integrations.
For more information check out our website www.faradaysec.com

This set of scripts is designed to collect a variety of data from an endpoint thought to be infected, to facilitate the incident response process. This data should not be considered to be a full forensic data collection, but does capture a lot of useful forensic information.
If you want true forensic data, you should really capture a full memory dump and image the entire drive. That is not within the scope of this toolkit.
The script must be run on a live system, not on an image or other forensic data store. It does not strictly require root permissions to run, but it will be unable to collect much of the intended data without.
Data will be collected in two forms. First is in the form of summary files, containing output of shell commands, data extracted from databases, and the like. For example, the browser module will output a browser_extensions.txt file with a summary of all the browser extensions installed for Safari, Chrome, and Firefox.
The second are complete files collected from the filesystem. These are stored in an artifacts subfolder inside the collection folder.
The script is very simple to run. It takes only one parameter, which is required, to pass in a configuration script in JSON format:
./pict.py -c /path/to/config.json
The configuration script describes what the script will collect, and how. It should look something like this:
This specifies the path to store the collected data in. It can be an absolute path or a path relative to the user's home folder (by starting with a tilde). The default path, if not specified, is /Users/Shared.
Data will be collected in a folder created in this location. That folder will have a name in the form PICT-computername-YYYY-MM-DD, where the computer name is the name of the machine specified in System Preferences > Sharing and date is the date of collection.
If true, collects data from all users on the machine whenever possible. If false, collects data only for the user running the script. If not specified, this value defaults to true.
PICT is modular, and can easily be expanded or reduced in scope, simply by changing what Collector modules are used.
The collectors data is a dictionary where the key is the name of a module to load (the name of the Python file without the .py extension) and the value is the name of the Collector subclass found in that module. You can add additional entries for custom modules (see Writing your own modules), or can remove entries to prevent those modules from running. One easy way to remove modules, without having to look up the exact names later if you want to add them again, is to move them into a top-level dictionary named unused.
This dictionary provides global settings.
keepLSData specifies whether the lsregister.txt file - which can be quite large - should be kept. (This file is generated automatically and is used to build output by some other modules. It contains a wealth of useful information, but can be well over 100 MB in size. If you don't need all that data, or don't want to deal with that much data, set this to false and it will be deleted when collection is finished.)
zipIt specifies whether to automatically generate a zip file with the contents of the collection folder. Note that the process of zipping and unzipping the data will change some attributes, such as file ownership.
This dictionary specifies module-specific settings. Not all modules have their own settings, but if a module does allow for its own settings, you can provide them here. In the above example, you can see a boolean setting named collectArtifacts being used with the browser module.
There are also global module settings that are maintained by the Collector class, and that can be set individually for each module.
collectArtifacts specifies whether to collect the file artifacts that would normally be collected by the module. If false, all artifacts will be omitted for that module. This may be needed in cases where storage space is a consideration, and the collected artifacts are large, or in cases where the collected artifacts may represent a privacy issue for the user whose system is being analyzed.
Modules must consist of a file containing a class that is subclassed from Collector (defined in collectors/collector.py), and they must be placed in the collectors folder. A new Collector module can be easily created by duplicating the collectors/template.py file and customizing it for your own use.
def __init__(self, collectionPath, allUsers)This method can be overridden if necessary, but the super Collector.init() must be called in such a case, preferably before your custom code executes. This gives the object the chance to get its properties set up before your code tries to use them.
def printStartInfo(self)This is a very simple method that will be called when this module's collection begins. Its intent is to print a message to stdout to give the user a sense of progress, by providing feedback about what is happening.
def applySettings(self, settingsDict)This gives the module the chance to apply any custom settings. Each module can have its own self-defined settings, but the settingsDict should also be passed to the super, so that the Collection class can handle any settings that it defines.
def collect(self)This method is the core of the module. This is called when it is time for the module to begin collection. It can write as many files as it needs to, but should confine this activity to files within the path self.collectionPath, and should use filenames that are not already taken by other modules.
If you wish to collect artifacts, don't try to do this on your own. Simply add paths to the self.pathsToCollect array, and the Collector class will take care of copying those into the appropriate subpaths in the artifacts folder, and maintaining the metadata (permissions, extended attributes, flags, etc) on the artifacts.
When the method finishes, be sure to call the super (Collector.collect(self)) to give the Collector class the chance to handle its responsibilities, such as collecting artifacts.
Your collect method can use any data collected in the basic_info.txt or lsregister.txt files found at self.collectionPath. These are collected at the beginning by the pict.py script, and can be assumed to be available for use by any other modules. However, you should not rely on output from any other modules, as there is no guarantee that the files will be available when your module runs. Modules may not run in the order they appear in your configuration JSON, since Python dictionaries are unordered.
Thanks to Greg Neagle for FoundationPlist.py, which solved lots of problems with reading binary plists, plists containing date data types, etc.