Espionage is a network packet sniffer that intercepts large amounts of data being passed through an interface. The tool allows users to to run normal and verbose traffic analysis that shows a live feed of traffic, revealing packet direction, protocols, flags, etc. Espionage can also spoof ARP so, all data sent by the target gets redirected through the attacker (MiTM). Espionage supports IPv4, TCP/UDP, ICMP, and HTTP. Espionag e was written in Python 3.8 but it also supports version 3.6. This is the first version of the tool so please contact the developer if you want to help contribute and add more to Espionage. Note: This is not a Scapy wrapper, scapylib only assists with HTTP requests and ARP.
1: git clone https://www.github.com/josh0xA/Espionage.git
2: cd Espionage
3: sudo python3 -m pip install -r requirments.txt
4: sudo python3 espionage.py --help
sudo python3 espionage.py --normal --iface wlan0 -f capture_output.pcapwlan0 with whatever your network interface is.sudo python3 espionage.py --verbose --iface wlan0 -f capture_output.pcapsudo python3 espionage.py --normal --iface wlan0sudo python3 espionage.py --verbose --httpraw --iface wlan0sudo python3 espionage.py --target <target-ip-address> --iface wlan0sudo python3 espionage.py --iface wlan0 --onlyhttpsudo python3 espionage.py --iface wlan0 --onlyhttpsecuresudo python3 espionage.py --iface wlan0 --urlonlyusage: espionage.py [-h] [--version] [-n] [-v] [-url] [-o] [-ohs] [-hr] [-f FILENAME] -i IFACE
[-t TARGET]
optional arguments:
-h, --help show this help message and exit
--version returns the packet sniffers version.
-n, --normal executes a cleaner interception, less sophisticated.
-v, --verbose (recommended) executes a more in-depth packet interception/sniff.
-url, --urlonly only sniffs visited urls using http/https.
-o, --onlyhttp sniffs only tcp/http data, returns urls visited.
-ohs, --onlyhttpsecure
sniffs only https data, (port 443).
-hr, --httpraw displays raw packet data (byte order) recieved or sent on port 80.
(Recommended) arguments for data output (.pcap):
-f FILENAME, --filename FILENAME
name of file to store the output (make extension '.pcap').
(Required) arguments required for execution:
-i IFACE, --iface IFACE
specify network interface (ie. wlan0, eth0, wlan1, etc.)
(ARP Spoofing) required arguments in-order to use the ARP Spoofing utility:
-t TARGET, --target TARGET

A simple medium writeup can be found here:
Click Here For The Official Medium Article
The developer of this program, Josh Schiavone, written the following code for educational and ethical purposes only. The data sniffed/intercepted is not to be used for malicous intent. Josh Schiavone is not responsible or liable for misuse of this penetration testing tool. May God bless you all.
MIT License
Copyright (c) 2024 Josh Schiavone
LTESniffer is An Open-source LTE Downlink/Uplink Eavesdropper
It first decodes the Physical Downlink Control Channel (PDCCH) to obtain the Downlink Control Informations (DCIs) and Radio Network Temporary Identifiers (RNTIs) of all active users. Using decoded DCIs and RNTIs, LTESniffer further decodes the Physical Downlink Shared Channel (PDSCH) and Physical Uplink Shared Channel (PUSCH) to retrieve uplink and downlink data traffic.
LTESniffer supports an API with three functions for security applications and research. Many LTE security research assumes a passive sniffer that can capture privacy-related packets on the air. However, non of the current open-source sniffers satisfy their requirements as they cannot decode protocol packets in PDSCH and PUSCH. We developed a proof-of-concept security API that supports three tasks that were proposed by previous works: 1) Identity mapping, 2) IMSI collecting, and 3) Capability profiling.
Please refer to our paper for more details.
LTESniffer is a tool that can capture the LTE wireless messages that are sent between a cell tower and smartphones connected to it. LTESniffer supports capturing the messages in both directions, from the tower to the smartphones, and from the smartphones back to the cell tower.
LTESniffer CANNOT DECRYPT encrypted messages between the cell tower and smartphones. It can be used for analyzing unencrypted parts of the communication between the cell tower and smartphones. For example, for encrypted messages, it can allow the user to analyze unencrypted parts, such as headers in MAC and physical layers. However, those messages sent in plaintext can be completely analyzable. For example, the broadcast messages sent by the cell tower, or the messages at the beginning of the connection are completely visible.
The main purpose of LTESniffer is to support security and analysis research on the cellular network. Due to the collection of uplink-downlink user data, any use of LTESniffer must follow the local regulations on sniffing the LTE traffic. We are not responsible for any illegal purposes such as intentionally collecting user privacy-related information.
LTESniffer-multi-usrp branch and its README for more details.LTESniffer is implemented on top of FALCON with the help of srsRAN library. LTESniffer supports:
Currently, LTESniffer works stably on Ubuntu 18.04/20.04/22.04.
Achieving real-time decoding of LTE traffic requires a high-performance CPU with multiple physical cores. Especially when the base station has many active users during the peak hour. LTESniffer was able to achieve real-time decoding when running on an Intel i7-9700K PC to decode traffic on a base station with 150 active users.
The following hardware is recommended
LTESniffer requires different SDR for its uplink and downlink sniffing modes.
To sniff only downlink traffic from the base station, LTESniffer is compatible with most SDRs that are supported by the srsRAN library (for example, USRP or BladeRF). The SDR should be connected to the PC via a USB 3.0 port. Also, it should be equipped with GPSDO and two RX antennas to decode downlink messages in transmission modes 3 and 4.
On the other hand, to sniff uplink traffic from smartphones to base stations, LTESniffer needs to listen to two different frequencies (Uplink and Downlink) concurrently. To solve this problem, LTESniffer supports two options:
main branch of LTESniffer.LTESniffer-multi-usrp branch of LTESniffer and its README.Important note: To avoid unexpected errors, please follow the following steps on Ubuntu 18.04/20.04/22.04.
Dependencies
UHD dependencies:
sudo apt update
sudo apt-get install autoconf automake build-essential ccache cmake cpufrequtils doxygen ethtool \
g++ git inetutils-tools libboost-all-dev libncurses5 libncurses5-dev libusb-1.0-0 libusb-1.0-0-dev \
libusb-dev python3-dev python3-mako python3-numpy python3-requests python3-scipy python3-setuptools \
python3-ruamel.yaml
Clone and build UHD from source (make sure that the current branch is higher than 4.0)
git clone https://github.com/EttusResearch/uhd.git
cd <uhd-repo-path>/host
mkdir build
cd build
cmake ../
make -j 4
make test
sudo make install
sudo ldconfig
Download firmwares for USRPs:
sudo uhd_images_downloaderWe use a 10Gb card to connect USRP X310 to PC, refer to UHD Manual [1], [2] to configure USRP X310 and 10Gb card interface. For USRP B210, it should be connected to PC via a USB 3.0 port.
Test the connection and firmware (for USRP X310 only):
sudo sysctl -w net.core.rmem_max=33554432
sudo sysctl -w net.core.wmem_max=33554432
sudo ifconfig <10Gb card interface> mtu 9000
sudo uhd_usrp_probesudo apt-get install build-essential git cmake libfftw3-dev libmbedtls-dev libboost-program-options-dev libconfig++-dev libsctp-devsudo apt-get install libglib2.0-dev libudev-dev libcurl4-gnutls-dev libboost-all-dev qtdeclarative5-dev libqt5charts5-devBuild LTESniffer from source:
git clone https://github.com/SysSec-KAIST/LTESniffer.git
cd LTESniffer
mkdir build
cd build
cmake ../
make -j 4 (use 4 threads)LTESniffer has 3 main functions:
After building from source, LTESniffer is located in <build-dir>/src/LTESniffer
Note that before using LTESniffer on the commercial, one should have to check the local regulations on sniffing LTE traffic, as we explained in the Ethical Consideration.
To figure out the base station and Uplink-Downlink band the test smartphone is connected to, install Cellular-Z app on the test smartphone (the app only supports Android). It will show the cell ID and Uplink-Downlink band/frequency to which the test smartphone is connected. Make sure that LTESniffer also connects to the same cell and frequency.
sudo ./<build-dir>/src/LTESniffer -A 2 -W <number of threads> -f <DL Freq> -C -m 0
example: sudo ./src/LTESniffer -A 2 -W 4 -f 1840e6 -C -m 0
-A: number of antennas
-W: number of threads
-f: downlink frequency
-C: turn on cell search
-m: sniffer mode, 0 for downlink sniffing and 1 for uplink sniffing
Note: to run LTESniffer with USRP B210 in the downlink mode, add option -a "num_recv_frames=512" to the command line. This option extends the receiving buffer for USRP B210 to achieve better synchronization.
sudo ./<build-dir>/src/LTESniffer -A 2 -W <number of threads> -f <DL Freq> -C -m 0 -a "num_recv_frames=512"
example: sudo ./src/LTESniffer -A 2 -W 4 -f 1840e6 -C -m 0 -a "num_recv_frames=512"Note: In the uplink sniffing mode, the test smartphones should be located nearby the sniffer, because the uplink signal power from UE is significantly weaker compared to the downlink signal from the base station.
sudo ./<build-dir>/src/LTESniffer -A 2 -W <number of threads> -f <DL Freq> -u <UL Freq> -C -m 1
example: sudo ./src/LTESniffer -A 2 -W 4 -f 1840e6 -u 1745e6 -C -m 1
-u: uplink frequencysudo ./<build-dir>/src/LTESniffer -A 2 -W <number of threads> -f <DL Freq> -u <UL Freq> -C -m 1 -z 3
example: sudo ./src/LTESniffer -A 2 -W 4 -f 1840e6 -u 1745e6 -C -m 1 -z 3
-z: 3 for turnning on 3 functions of sniffer, which are identity mapping, IMSI collecting, and UECapability profiling.
2 for UECapability profiling
1 for IMSI collecting
0 for identity mappingLTESniffer can sniff on a specific base station by using options -I <Phycial Cell ID (PCI)> -p <number of Physical Resource Block (PRB)>. In this case, LTESniffer does not do the cell search but connects directly to the specified cell.
sudo ./<build-dir>/src/LTESniffer -A 2 -W <number of threads> -f <DL Freq> -I <PCI> -p <PRB> -m 0
sudo ./<build-dir>/src/LTESniffer -A 2 -W <number of threads> -f <DL Freq> -u <UL Freq> -I <PCI> -p <PRB> -m 1
example: sudo ./src/LTESniffer -A 2 -W 4 -f 1840e6 -u 1745e6 -I 379 -p 100 -m 1
The debug mode can be enabled by using option -d. In this case, the debug messages will be printed on the terminal.
LTESniffer provides pcap files in the output. The pcap file can be opened by WireShark for further analysis and packet trace. The name of downlink pcap file: sniffer_dl_mode.pcap, uplink pcap file: sniffer_ul_mode.pcap, and API pcap file: api_collector.pcap. The pcap files are located in the same directory LTESniffer has been executed. To enable the WireShark to analyze the decoded packets correctly, please refer to the WireShark configuration guide here. There are also some examples of pcap files in the link.
Note: The uplink pcap file contains both uplink and downlink messages. On the WireShark, use this filter to monitor only uplink messages: mac-lte.direction == 0; or this filter to monitor only downlink messages: mac-lte.direction == 1.
The effective range for sniffing uplink is limited in LTESniffer due to the capability of the RF front-end of the hardware (i.e. SDR). The uplink signal power from UE is significantly weaker compared to the downlink signal because UE is a handheld device that optimizes battery usage, while the eNB uses sufficient power to cover a large area. To successfully capture the uplink traffic, LTESniffer can increase the strength of the signal power by i) being physically close to the UE, or ii) improving the signal reception capability with specialized hardware, such as a directional antenna, dedicated RF front-end, and signal amplifier.
Downlink Sniffing Mode
Processed 1000/1000 subframes: Number of subframes was processed by LTESniffer last 1 second. There are 1000 LTE subframes per second by design. RNTI: Radio Network Temporary Identifier of UEs. Table: The maximum modulation scheme that is used by smartphones in downlink. LTESniffer supports up to 256QAM in the downlink. Refer to our paper for more details. Active: Number of detected messages of RNTIs. Success: Number of successfully decoded messages over number of detected messages (Active). New TX, ReTX, HARQ, Normal: Statistic of new messages and retransmitted messages. This function is in development. W_MIMO, W_pinfor, Other: Number of messages with wrong radio configuration, only for debugging.
Uplink Sniffing Mode
Max Mod: The maximum modulation scheme that is used by smartphones in uplink. It can be 16/64/256QAM depending on the support of smartphones and the configuration of the network. Refer to our paper for more details. SNR: Signal-to-noise ratio (dB). Low SNR means the uplink signal quality from the smartphone is bad. One possible reason is the smartphone is far from the sniffer. DL-UL_delay: The average of time delay between downlink signal from the base station and uplink signal from the smartphone. Other Info: Information only for debugging.
API Mode
Detected Identity: The name of detected identity. Value: The value of detected identity. From Message: The name of the message that contains the detected identity.
We sincerely appreciate the FALCON and SRS team for making their great softwares available.
Please refer to our paper for more details.
@inproceedings{hoang:ltesniffer,
  title = {{LTESniffer: An Open-source LTE Downlink/Uplink Eavesdropper}},
  author = {Hoang, Dinh Tuan and Park, CheolJun and Son, Mincheol and Oh, Taekkyung and Bae, Sangwook and Ahn, Junho and Oh, BeomSeok and Kim, Yongdae},
  booktitle = {16th ACM Conference on Security and Privacy in Wireless and Mobile Networks (WiSec '23)},
  year = {2023}
}Q: Is it mandatory to use GPSDO with the USRP in order to run LTESniffer?
A: GPSDO is useful for more stable synchronization. However, for downlink sniffing mode, LTESniffer still can synchronize with the LTE signal to decode the packets without GPSDO. For uplink sniffing mode, GPSDO is only required when using 2 USRP B-series, as it is the time and clock reference sources for synchrozation between uplink and downlink channels. Another uplink SDR option, using a single USRP X310, does not require GPSDO.
Q: For downlink traffic, can I use a cheaper SDR?
A: Technically, any SDRs supported by srsRAN library such as Blade RF can be used to run LTESniffer in the downlink sniffing mode. However, we only tested the downlink sniffing function of LTESniffer with USRP B210 and X310.
Q: Is it illegal to use LTESniffer to sniff the LTE traffic?
A: You should have to check the local regulations on sniffing (unencrypted) LTE traffic. Another way to test LTESniffer is setting up a personal LTE network by using srsRAN - an open-source LTE implementation in a Faraday cage.
Q: Can LTESniffer be used to view the content of messages between two users?
A: One can see only the "unencrypted" part of the messages. Note that the air traffic between the base station and users is mostly encrypted.
Q: Is there any device identity exposed in plaintext in the LTE network?
A: Yes, literature shows that there are multiple identities exposed, such as TMSI, GUTI, IMSI, and RNTI. Please refer to the academic literature for more details. e.g. Watching the Watchers: Practical Video Identification Attack in LTE Networks
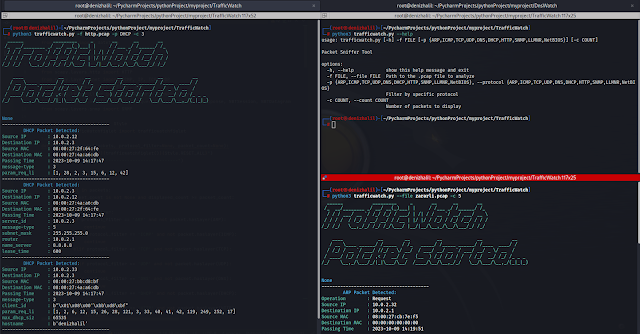
TrafficWatch, a packet sniffer tool, allows you to monitor and analyze network traffic from PCAP files. It provides insights into various network protocols and can help with network troubleshooting, security analysis, and more.
Clone the repository:
git clone https://github.com/HalilDeniz/TrafficWatch.gitNavigate to the project directory:
cd TrafficWatchInstall the required dependencies:
pip install -r requirements.txtpython3 trafficwatch.py --help
usage: trafficwatch.py [-h] -f FILE [-p {ARP,ICMP,TCP,UDP,DNS,DHCP,HTTP,SNMP,LLMNR,NetBIOS}] [-c COUNT]
Packet Sniffer Tool
options:
-h, --help show this help message and exit
-f FILE, --file FILE Path to the .pcap file to analyze
-p {ARP,ICMP,TCP,UDP,DNS,DHCP,HTTP,SNMP,LLMNR,NetBIOS}, --protocol {ARP,ICMP,TCP,UDP,DNS,DHCP,HTTP,SNMP,LLMNR,NetBIOS}
Filter by specific protocol
-c COUNT, --count COUNT
Number of packets to display
To analyze packets from a PCAP file, use the following command:
python trafficwatch.py -f path/to/your.pcapTo specify a protocol filter (e.g., HTTP) and limit the number of displayed packets (e.g., 10), use:
python trafficwatch.py -f path/to/your.pcap -p HTTP -c 10-f or --file: Path to the PCAP file for analysis.-p or --protocol: Filter packets by protocol (ARP, ICMP, TCP, UDP, DNS, DHCP, HTTP, SNMP, LLMNR, NetBIOS).-c or --count: Limit the number of displayed packets.Contributions are welcome! If you want to contribute to TrafficWatch, please follow our contribution guidelines.
If you have any questions, comments, or suggestions about Dosinator, please feel free to contact me:
This project is licensed under the MIT License.
Thank you for considering supporting me! Your support enables me to dedicate more time and effort to creating useful tools like DNSWatch and developing new projects. By contributing, you're not only helping me improve existing tools but also inspiring new ideas and innovations. Your support plays a vital role in the growth of this project and future endeavors. Together, let's continue building and learning. Thank you!"
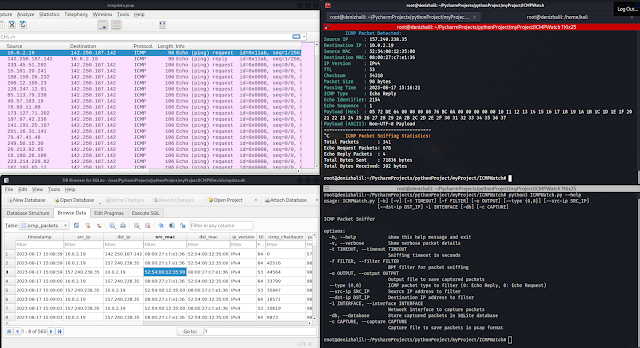
ICMP Packet Sniffer is a Python program that allows you to capture and analyze ICMP (Internet Control Message Protocol) packets on a network interface. It provides detailed information about the captured packets, including source and destination IP addresses, MAC addresses, ICMP type, payload data, and more. The program can also store the captured packets in a SQLite database and save them in a pcap format.
git clone https://github.com/HalilDeniz/ICMPWatch.gitpip install -r requirements.txtpython ICMPWatch.py [-h] [-v] [-t TIMEOUT] [-f FILTER] [-o OUTPUT] [--type {0,8}] [--src-ip SRC_IP] [--dst-ip DST_IP] -i INTERFACE [-db] [-c CAPTURE]
-v or --verbose: Show verbose packet details.-t or --timeout: Sniffing timeout in seconds (default is 300 seconds).-f or --filter: BPF filter for packet sniffing (default is "icmp").-o or --output: Output file to save captured packets.--type: ICMP packet type to filter (0: Echo Reply, 8: Echo Request).--src-ip: Source IP address to filter.--dst-ip: Destination IP address to filter.-i or --interface: Network interface to capture packets (required).-db or --database: Store captured packets in an SQLite database.-c or --capture: Capture file to save packets in pcap format.Press Ctrl+C to stop the sniffing process.
python icmpwatch.py -i eth0python dnssnif.py -i eth0 -o icmp_results.txtpython icmpwatch.py -i eth0 --src-ip 192.168.1.10 --dst-ip 192.168.1.20python icmpwatch.py -i eth0 --type 8python icmpwatch.py -i eth0 -c captured_packets.pcapDNSWatch is a Python-based tool that allows you to sniff and analyze DNS (Domain Name System) traffic on your network. It listens to DNS requests and responses and provides insights into the DNS activity.
git clone https://github.com/HalilDeniz/DNSWatch.gitpip install -r requirements.txtpython dnswatch.py -i <interface> [-v] [-o <output_file>] [-k <target_ip>] [--analyze-dns-types] [--doh]
-i, --interface: Specify the network interface (e.g., eth0).-v, --verbose: Use this flag for more verbose output.-o, --output: Specify the filename to save results.-t, --target-ip: Specify a specific target IP address to monitor.-adt, --analyze-dns-types: Analyze DNS types.--doh: Use DNS over HTTPS (DoH) for resolving DNS requests.-fd, --target-domains: Filter DNS requests by specified domains.-d, --database: Enable database storage for DNS requests.Press Ctrl+C to stop the sniffing process.
python dnswatch.py -i eth0python dnswatch.py -i eth0 -o dns_results.txtpython dnswatch.py -i eth0 -k 192.168.1.100python dnswatch.py -i eth0 --analyze-dns-typespython dnswatch.py -i eth0 --dohpython3 dnswatch.py -i wlan0 --databaseDNSWatch is licensed under the MIT License. See the LICENSE file for details.
This tool is intended for educational and testing purposes only. It should not be used for any malicious activities.