Two men have been arrested for allegedly stealing data from and extorting dozens of companies that used the cloud data storage company Snowflake, but a third suspect — a prolific hacker known as Kiberphant0m — remains at large and continues to publicly extort victims. However, this person’s identity may not remain a secret for long: A careful review of Kiberphant0m’s daily chats across multiple cybercrime personas suggests they are a U.S. Army soldier who is or was recently stationed in South Korea.
Kiberphant0m’s identities on cybercrime forums and on Telegram and Discord chat channels have been selling data stolen from customers of the cloud data storage company Snowflake. At the end of 2023, malicious hackers discovered that many companies had uploaded huge volumes of sensitive customer data to Snowflake accounts that were protected with nothing more than a username and password (no multi-factor authentication required).
After scouring darknet markets for stolen Snowflake account credentials, the hackers began raiding the data storage repositories for some of the world’s largest corporations. Among those was AT&T, which disclosed in July that cybercriminals had stolen personal information, phone and text message records for roughly 110 million people. Wired.com reported in July that AT&T paid a hacker $370,000 to delete stolen phone records.
On October 30, Canadian authorities arrested Alexander Moucka, a.k.a. Connor Riley Moucka of Kitchener, Ontario, on a provisional arrest warrant from the United States, which has since indicted him on 20 criminal counts connected to the Snowflake breaches. Another suspect in the Snowflake hacks, John Erin Binns, is an American who is currently incarcerated in Turkey.
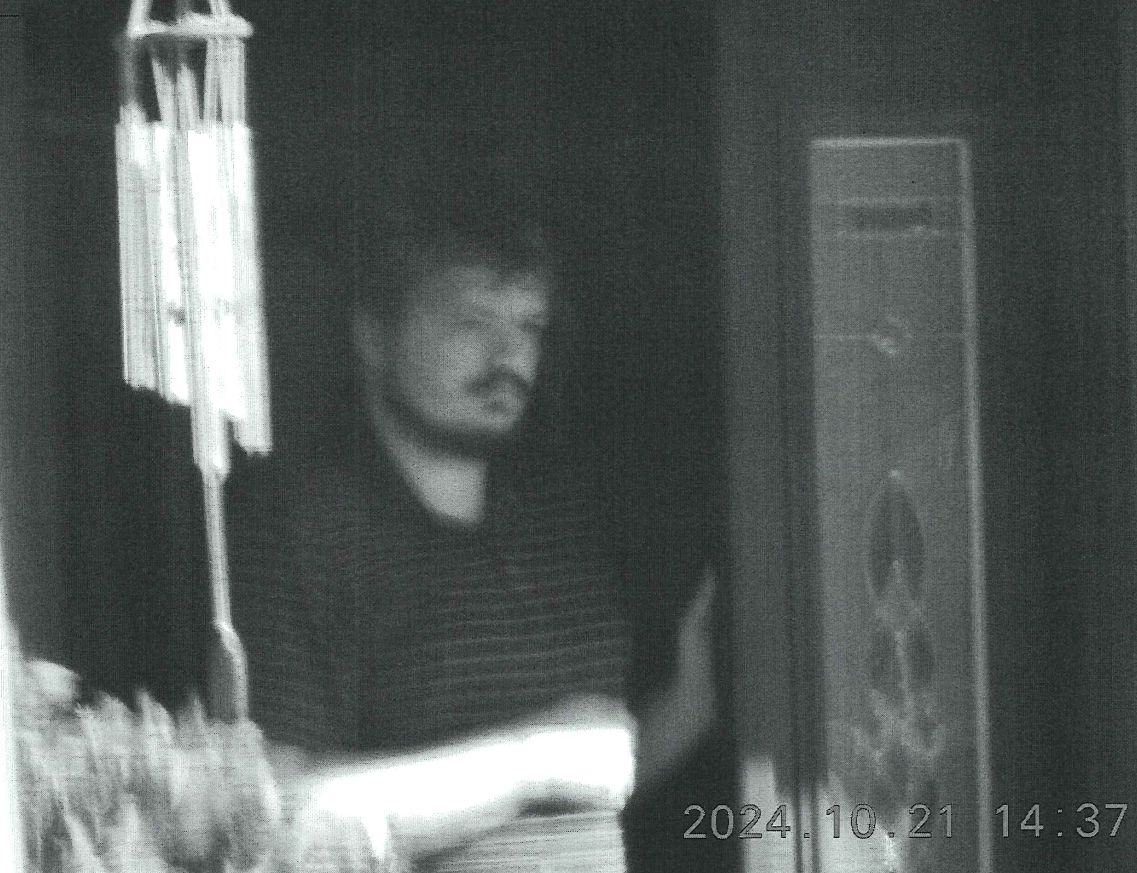
A surveillance photo of Connor Riley Moucka, a.k.a. “Judische” and “Waifu,” dated Oct 21, 2024, 9 days before Moucka’s arrest. This image was included in an affidavit filed by an investigator with the Royal Canadian Mounted Police (RCMP).
Investigators say Moucka, who went by the handles Judische and Waifu, had tasked Kiberphant0m with selling data stolen from Snowflake customers who refused to pay a ransom to have their information deleted. Immediately after news broke of Moucka’s arrest, Kiberphant0m was clearly furious, and posted on the hacker community BreachForums what they claimed were the AT&T call logs for President-elect Donald J. Trump and for Vice President Kamala Harris.
“In the event you do not reach out to us @ATNT all presidential government call logs will be leaked,” Kiberphant0m threatened, signing their post with multiple “#FREEWAIFU” tags. “You don’t think we don’t have plans in the event of an arrest? Think again.”
On the same day, Kiberphant0m posted what they claimed was the “data schema” from the U.S. National Security Agency.
“This was obtained from the ATNT Snowflake hack which is why ATNT paid an extortion,” Kiberphant0m wrote in a thread on BreachForums. “Why would ATNT pay Waifu for the data when they wouldn’t even pay an extortion for over 20M+ SSNs?”
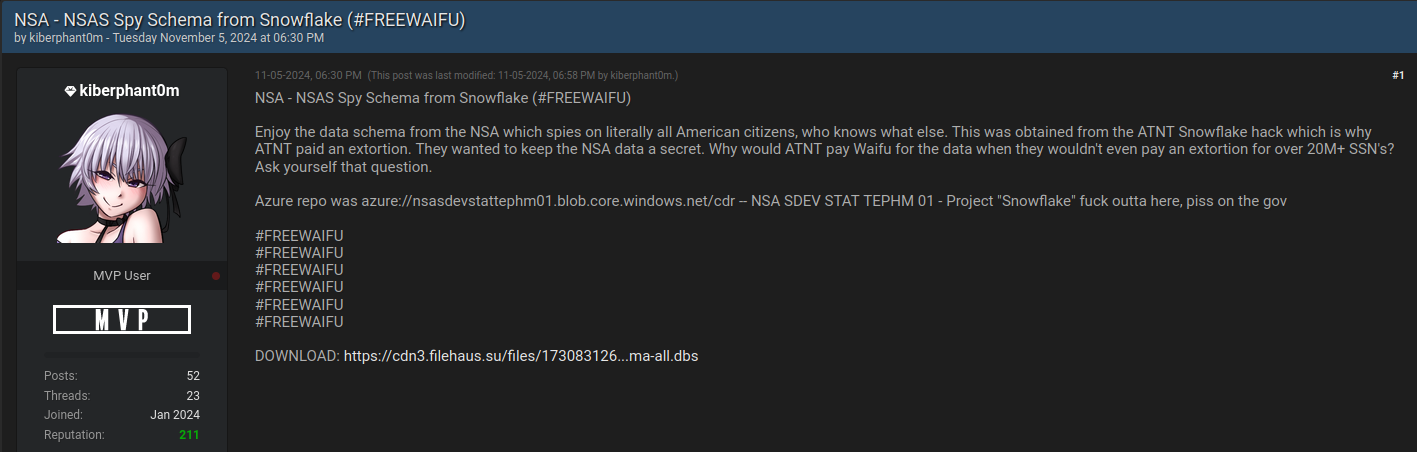
Kiberphant0m posting what he claimed was a “data schema” stolen from the NSA via AT&T.
Also on Nov. 5, Kiberphant0m offered call logs stolen from Verizon’s push-to-talk (PTT) customers — mainly U.S. government agencies and emergency first responders. On Nov. 9, Kiberphant0m posted a sales thread on BreachForums offering a “SIM-swapping” service targeting Verizon PTT customers. In a SIM-swap, fraudsters use credentials that are phished or stolen from mobile phone company employees to divert a target’s phone calls and text messages to a device they control.
Kiberphant0m joined BreachForums in January 2024, but their public utterances on Discord and Telegram channels date back to at least early 2022. On their first post to BreachForums, Kiberphant0m said they could be reached at the Telegram handle @cyb3rph4nt0m.
A review of @cyb3rph4nt0m shows this user has posted more than 4,200 messages since January 2024. Many of these messages were attempts to recruit people who could be hired to deploy a piece of malware that enslaved host machines in an Internet of Things (IoT) botnet.
On BreachForums, Kiberphant0m has sold the source code to “Shi-Bot,” a custom Linux DDoS botnet based on the Mirai malware. Kiberphant0m had few sales threads on BreachForums prior to the Snowflake attacks becoming public in May, and many of those involved databases stolen from companies in South Korea.
On June 5, 2024, a Telegram user by the name “Buttholio” joined the fraud-focused Telegram channel “Comgirl” and claimed to be Kiberphant0m. Buttholio made the claim after being taunted as a nobody by another denizen of Comgirl, referring to their @cyb3rph4nt0m account on Telegram and the Kiberphant0m user on cybercrime forums.
“Type ‘kiberphant0m’ on google with the quotes,” Buttholio told another user. “I’ll wait. Go ahead. Over 50 articles. 15+ telecoms breached. I got the IMSI number to every single person that’s ever registered in Verizon, Tmobile, ATNT and Verifone.”
On Sept. 17, 2023, Buttholio posted in a Discord chat room dedicated to players of the video game Escape from Tarkov. “Come to Korea, servers there is pretty much no extract camper or cheater,” Buttholio advised.
In another message that same day in the gaming Discord, Buttholio told others they bought the game in the United States, but that they were playing it in Asia.
“USA is where the game was purchased from, server location is actual in game servers u play on. I am a u.s. soldier so i bought it in the states but got on rotation so i have to use asian servers,” they shared.
The account @Kiberphant0m was assigned the Telegram ID number 6953392511. A review of this ID at the cyber intelligence platform Flashpoint shows that on January 4, 2024 Kibertphant0m posted to the Telegram channel “Dstat,” which is populated by cybercriminals involved in launching distributed denial-of-service (DDoS) attacks and selling DDoS-for-hire services [Full disclosure: Flashpoint is currently an advertiser on this website].
Immediately after Kiberphant0m logged on to the Dstat channel, another user wrote “hi buttholio,” to which Kiberphant0m replied with an affirmative greeting “wsg,” or “what’s good.” On Nov. 1, Dstat’s website dstat[.]cc was seized as part of “Operation PowerOFF,” an international law enforcement action against DDoS services.
Flashpoint’s data shows that @kiberphant0m told a fellow member of Dstat on April 10, 2024 that their alternate Telegram username was “@reverseshell,” and did the same two weeks later in the Telegram chat The Jacuzzi. The Telegram ID for this account is 5408575119.
Way back on Nov. 15, 2022, @reverseshell told a fellow member of a Telegram channel called Cecilio Chat that they were a soldier in the U.S. Army. This user also shared the following image of someone pictured waist-down in military fatigues, with a camouflaged backpack at their feet:
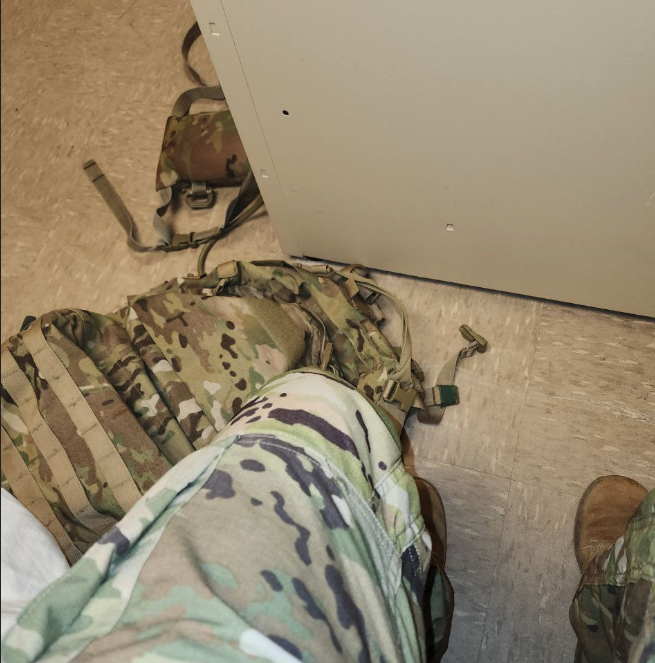
Kiberphant0m’s apparent alias ReverseShell posted this image on a Telegram channel Cecilio Chat, on Nov. 15, 2022. Image: Flashpoint.
In September 2022, Reverseshell was embroiled in an argument with another member who had threatened to launch a DDoS attack against Reverseshell’s Internet address. After the promised attack materialized, Reverseshell responded, “Yall just hit military base contracted wifi.”
In a chat from October 2022, Reverseshell was bragging about the speed of the servers they were using, and in reply to another member’s question said that they were accessing the Internet via South Korea Telecom.
Telegram chat logs archived by Flashpoint show that on Aug. 23, 2022, Reverseshell bragged they’d been using automated tools to find valid logins for Internet servers that they resold to others.
“I’ve hit US gov servers with default creds,” Reverseshell wrote, referring to systems with easy-to-guess usernames and/or passwords. “Telecom control servers, machinery shops, Russian ISP servers, etc. I sold a few big companies for like $2-3k a piece. You can sell the access when you get a big SSH into corporation.”
On July 29, 2023, Reverseshell posted a screenshot of a login page for a major U.S. defense contractor, claiming they had an aerospace company’s credentials to sell.
Flashpoint finds the Telegram ID 5408575119 has used several aliases since 2022, including Reverseshell and Proman557.
A search on the username Proman557 at the cyber intelligence platform Intel 471 shows that a hacker by the name “Proman554” registered on Hackforums in September 2022, and in messages to other users Proman554 said they can be reached at the Telegram account Buttholio.
Intel 471 also finds the Proman557 moniker is one of many used by a person on the Russian-language hacking forum Exploit in 2022 who sold a variety of Linux-based botnet malware.
Proman557 was eventually banned — allegedly for scamming a fellow member out of $350 — and the Exploit moderator warned forum users that Proman557 had previously registered under several other nicknames, including an account called “Vars_Secc.”
Vars_Secc’s thousands of comments on Telegram over two years show this user divided their time between online gaming, maintaining a DDoS botnet, and promoting the sale or renting of their botnets to other users.
“I use ddos for many things not just to be a skid,” Vars_Secc pronounced. “Why do you think I haven’t sold my net?” They then proceeded to list the most useful qualities of their botnet:
-I use it to hit off servers that ban me or piss me off
-I used to ddos certain games to get my items back since the data reverts to when u joined
-I use it for server side desync RCE vulnerabilities
-I use it to sometimes ransom
-I use it when bored as a source of entertainment
Flashpoint shows that in June 2023, Vars_Secc responded to taunting from a fellow member in the Telegram channel SecHub who had threatened to reveal their personal details to the federal government for a reward.
“Man I’ve been doing this shit for 4 years,” Vars_Secc replied nonchalantly. “I highly doubt the government is going to pay millions of dollars for data on some random dude operating a pointless ddos botnet and finding a few vulnerabilities here and there.”
For several months in 2023, Vars_Secc also was an active member of the Russian-language crime forum XSS, where they sold access to a U.S. government server for $2,000. However, Vars_Secc would be banned from XSS after attempting to sell access to the Russian telecommunications giant Rostelecom. [In this, Vars_Secc violated the Number One Rule for operating on a Russia-based crime forum: Never offer to hack or sell data stolen from Russian entities or citizens].
On June 20, 2023, Vars_Secc posted a sales thread on the cybercrime forum Ramp 2.0 titled, “Selling US Gov Financial Access.”
“Server within the network, possible to pivot,” Vars_Secc’s sparse sales post read. “Has 3-5 subroutes connected to it. Price $1,250. Telegram: Vars_Secc.”
Vars_Secc also used Ramp in June 2023 to sell access to a “Vietnam government Internet Network Information Center.”
“Selling access server allocated within the network,” Vars_Secc wrote. “Has some data on it. $500.”
The Vars_Secc identity claimed on Telegram in May 2023 that they made money by submitting reports about software flaws to HackerOne, a company that helps technology firms field reports about security vulnerabilities in their products and services. Specifically, Vars_Secc said they had earned financial rewards or “bug bounties” from reddit.com, the U.S. Department of Defense, and Coinbase, among 30 others.
“I make money off bug bounties, it’s quite simple,” Vars_Secc said when asked what they do for a living. “That’s why I have over 30 bug bounty reports on HackerOne.”
A month before that, Vars_Secc said they’d found a vulnerability in reddit.com.
“I poisoned Reddit’s cache,” they explained. “I’m going to exploit it further, then report it to reddit.”
KrebsOnSecurity sought comment from HackerOne, which said it would investigate the claims. This story will be updated if they respond.
The Vars_Secc telegram handle also has claimed ownership of the BreachForums member “Boxfan,” and Intel 471 shows Boxfan’s early posts on the forum had the Vars_Secc Telegram account in their signature. In their most recent post to BreachForums in January 2024, Boxfan disclosed a security vulnerability they found in Naver, the most popular search engine in South Korea (according to statista.com). Boxfan’s comments suggest they have strong negative feelings about South Korean culture.
“Have fun exploiting this vulnerability,” Boxfan wrote on BreachForums, after pasting a long string of computer code intended to demonstrate the flaw. “Fuck you South Korea and your discriminatory views. Nobody likes ur shit kpop you evil fucks. Whoever can dump this DB [database] congrats. I don’t feel like doing it so I’ll post it to the forum.”
The many identities tied to Kiberphant0m strongly suggest they are or until recently were a U.S. Army soldier stationed in South Korea. Kiberphant0m’s alter egos never mentioned their military rank, regiment, or specialization.
However, it is likely that Kiberphant0m’s facility with computers and networking was noticed by the Army. According to the U.S. Army’s website, the bulk of its forces in South Korea reside within the Eighth Army, which has a dedicated cyber operations unit focused on defending against cyber threats.
On April 1, 2023, Vars_Secc posted to a public Telegram chat channel a screenshot of the National Security Agency’s website. The image indicated the visitor had just applied for some type of job at the NSA.
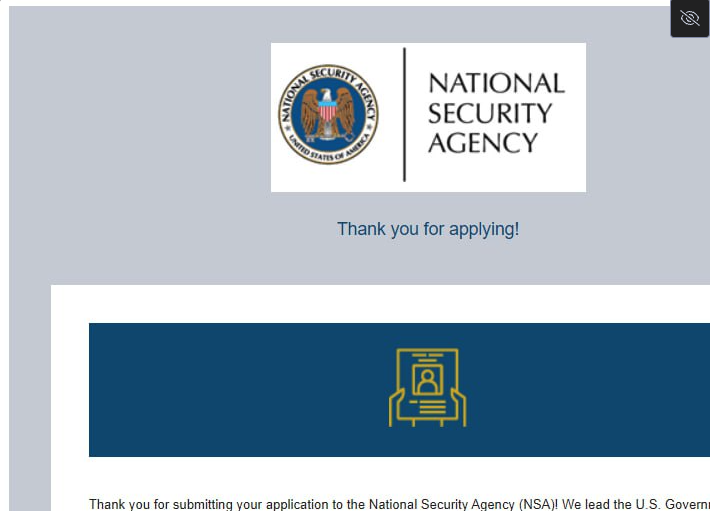
A screenshot posted by Vars_Secc on Telegram on April 1, 2023, suggesting they just applied for a job at the National Security Agency.
The NSA has not yet responded to requests for comment.
Reached via Telegram, Kiberphant0m acknowledged that KrebsOnSecurity managed to unearth their old handles.
“I see you found the IP behind it no way,” Kiberphant0m replied. “I see you managed to find my old aliases LOL.”
Kiberphant0m denied being in the U.S. Army or ever being in South Korea, and said all of that was a lengthy ruse designed to create a fictitious persona. “Epic opsec troll,” they claimed.
Asked if they were at all concerned about getting busted, Kiberphant0m called that an impossibility.
“I literally can’t get caught,” Kiberphant0m said, declining an invitation to explain why. “I don’t even live in the USA Mr. Krebs.”
Below is a mind map that hopefully helps illustrate some of the connections between and among Kiberphant0m’s apparent alter egos.
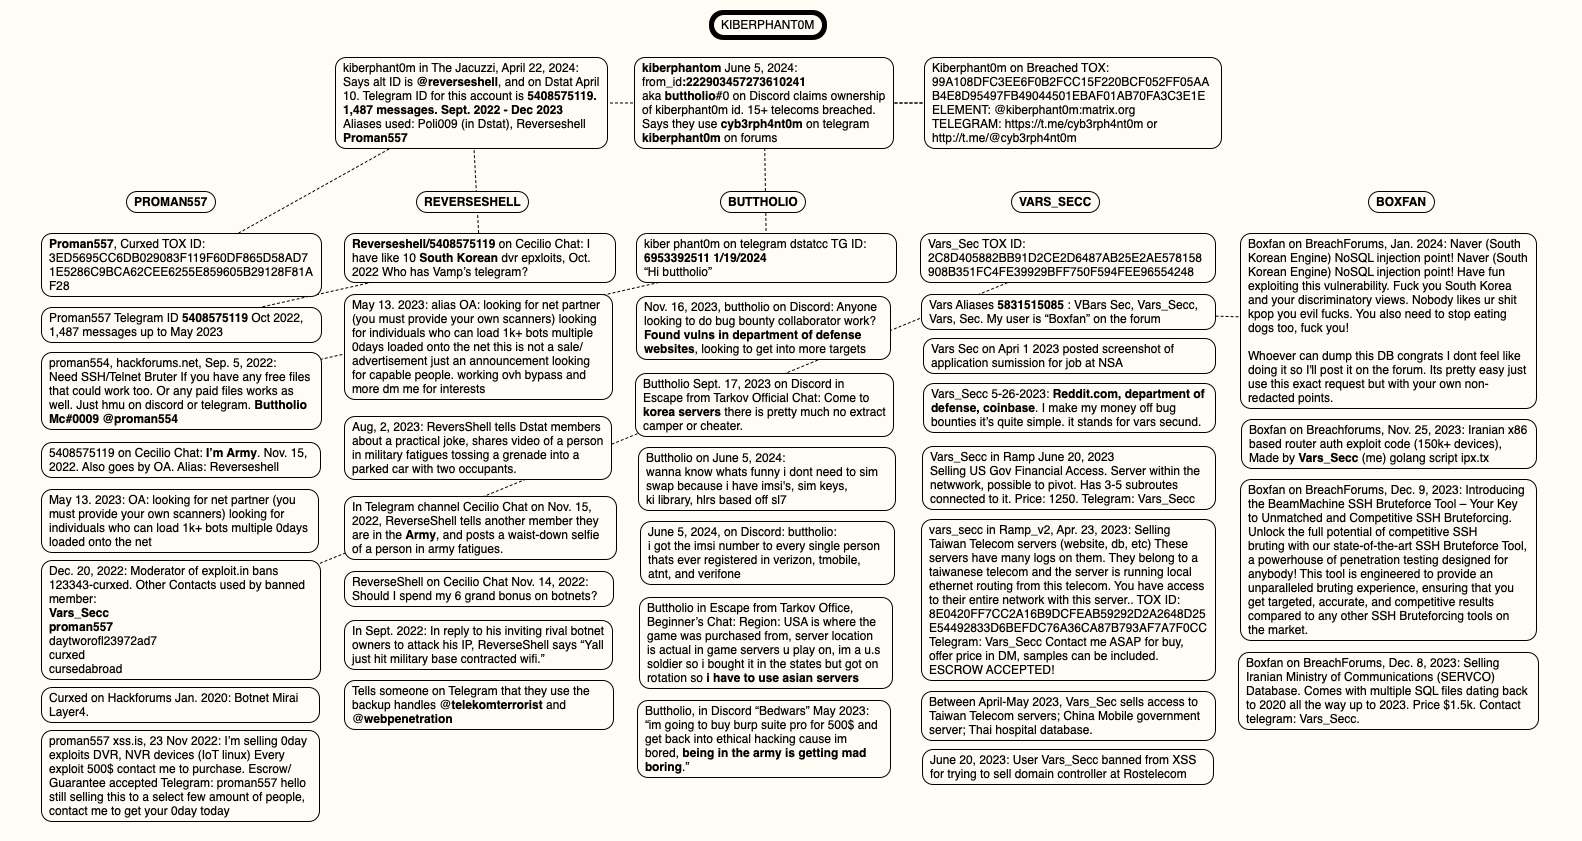
A mind map of the connections between and among the identities apparently used by Kiberphant0m. Click to enlarge.
KrebsOnSecurity would like to extend a special note of thanks to the New York City based security intelligence firm Unit 221B for their assistance in helping to piece together key elements of Kiberphant0m’s different identities.
This tool compilation is carefully crafted with the purpose of being useful both for the beginners and veterans from the malware analysis world. It has also proven useful for people trying their luck at the cracking underworld.
It's the ideal complement to be used with the manuals from the site, and to play with the numbered theories mirror.
To be clear, this pack is thought to be the most complete and robust in existence. Some of the pros are:
It contains all the basic (and not so basic) tools that you might need in a real life scenario, be it a simple or a complex one.
The pack is integrated with an Universal Updater made by us from scratch. Thanks to that, we get to mantain all the tools in an automated fashion.
It's really easy to expand and modify: you just have to update the file bin\updater\tools.ini to integrate the tools you use to the updater, and then add the links for your tools to bin\sendto\sendto, so they appear in the context menus.
The installer sets up everything we might need automatically - everything, from the dependencies to the environment variables, and it can even add a scheduled task to update the whole pack of tools weekly.
You can simply download the stable versions from the release section, where you can also find the installer.
Once downloaded, you can update the tools with the Universal Updater that we specifically developed for that sole purpose.
You will find the binary in the folder bin\updater\updater.exe.
This toolkit is composed by 98 apps that cover everything we might need to perform reverse engineering and binary/malware analysis.
Every tool has been downloaded from their original/official websites, but we still recommend you to use them with caution, specially those tools whose official pages are forum threads. Always exercise common sense.
You can check the complete list of tools here.
Pull Requests are welcome. If you'd want to propose big changes, you should first create an Issue about it, so we all can analyze and discuss it. The tools are compressed with 7-zip, and the format used for nomenclature is {name} - {version}.7z

Noia is a web-based tool whose main aim is to ease the process of browsing mobile applications sandbox and directly previewing SQLite databases, images, and more. Powered by frida.re.
Please note that I'm not a programmer, but I'm probably above the median in code-savyness. Try it out, open an issue if you find any problems. PRs are welcome.
npm install -g noia
noia
Explore third-party applications files and directories. Noia shows you details including the access permissions, file type and much more.
View custom binary files. Directly preview SQLite databases, images, and more.
Search application by name.
Search files and directories by name.
Navigate to a custom directory using the ctrl+g shortcut.
Download the application files and directories for further analysis.
Basic iOS support
and more
Noia is available on npm, so just type the following command to install it and run it:
npm install -g noia
noia
Noia is powered by frida.re, thus requires Frida to run.
See: * https://frida.re/docs/android/ * https://frida.re/docs/ios/
Security Warning
This tool is not secure and may include some security vulnerabilities so make sure to isolate the webpage from potential hackers.
MIT

Mobile Helper Framework is a tool that automates the process of identifying the framework/technology used to create a mobile application. Additionally, it assists in finding sensitive information or provides suggestions for working with the identified platform.
The tool searches for files associated with the technologies used in mobile application development, such as configuration files, resource files, and source code files.
Search files:
index.html
cordova.js
cordova_plugins.js
Search file
Andorid files:

libreactnativejni.so
index.android.bundle

iOS files:

main.jsbundle
❗A minimum of Java 8 is required to run Apktool.
pip install -r requirements.txt
python3 mhf.py app.apk|ipa|aab
python3 mobile_helper_framework.py file.apk

[+] App was written in React Native

Do you want analizy the application (y/n) y

Output directory already exists. Skipping decompilation.

Beauty the react code? (y/n) n

Search any info? (y/n) y

==>>Searching possible internal IPs in the file

results.........

==>>Searching possible emails in the file

results.........

==>>Searching possible interesting words in the file

results.........

==>>Searching Private Keys in the file

results.........

==>>Searching high confidential secrets

results.........

==>>Searching possible sensitive URLs in js files

results.........

==>>Searching possible endpoints in js files results.........
This tool uses Apktool for decompilation of Android applications.
This tool renames the .ipa file of iOS applications to .zip and extracts the contents.
| Feature | Note | Cordova | React Native | Native JavaScript | Flutter | Xamarin |
|---|---|---|---|---|---|---|
| JavaScript beautifier | Use this for the first few occasions to see better results. | ✅ | ✅ | ✅ | ||
| Identifying multiple sensitive information | IPs, Private Keys, API Keys, Emails, URLs | ✅ | ✅ | ✅ | ❌ | |
| Cryptographic Functions | ✅ | ✅ | ✅ | ❌ | ❌ | |
| Endpoint extractor | ✅ | ✅ | ✅ | ❌ | ❌ | |
| Automatically detects if the code has been beautified. | ❌ | ❌ | ❌ | |||
| Extracts automatically apk of devices/emulator | ❌ | ❌ | ❌ | ❌ | ❌ | |
| Patching apk | ✅ | |||||
| Extract an APK from a bundle file. | ✅ | ✅ | ✅ | ✅ | ✅ | |
| Detect if JS files are encrypted | ❌ | ❌ | ||||
| Detect if the resources are compressed. | ❌ | Hermes✅ | ❌ | ❌ | XALZ✅ | |
| Detect if the app is split | ❌ | ❌ | ❌ | ❌ | ❌ |
What is patching apk: This tool uses Reflutter, a framework that assists with reverse engineering of Flutter apps using a patched version of the Flutter library.
More information: https://github.com/Impact-I/reFlutter
Split APKs is a technique used by Android to reduce the size of an application and allow users to download and use only the necessary parts of the application.
Instead of downloading a complete application in a single APK file, Split APKs divide the application into several smaller APK files, each of which contains only a part of the application such as resources, code libraries, assets, and configuration files.
adb shell pm path com.package
package:/data/app/com.package-NW8ZbgI5VPzvSZ1NgMa4CQ==/base.apk
package:/data/app/com.package-NW8ZbgI5VPzvSZ1NgMa4CQ==/split_config.arm64_v8a.apk
package:/data/app/com.package-NW8ZbgI5VPzvSZ1NgMa4CQ==/split_config.en.apk
package:/data/app/com.package-NW8ZbgI5VPzvSZ1NgMa4CQ==/split_config.xxhdpi.apk
For example, in Flutter if the application is a Split it's necessary patch split_config.arm64_v8a.apk, this file contains libflutter.so

secbutler is a utility tool made for pentesters, bug-bounty hunters and security researchers that contains all the most used and tedious stuff commonly used while performing cybersecurity activities (like installing sec-related tools, retrieving commands for revshells, serving common payloads, obtaining a working proxy, managing wordlists and so forth).
The goal is to obtain a tool that meets the requirements of the community, therefore suggestions and PRs are very welcome!
secbutler -h
This will display the help for the tool
                   __          __  __
   ________  _____/ /_  __  __/ /_/ /__  _____
  / ___/ _ \/ ___/ __ \/ / / / __/ / _ \/ ___/
 (__  )  __/ /__/ /_/ / /_/ / /_/ /  __/ /
/____/\___/\___/_.___/\__,_/\__/_/\___/_/

v0.1.9 - https://github.com/groundsec/secbutler

Essential utilities for pentester, bug-bounty hunters and security researchers

Usage:
  secbutler [flags]
  secbutler [command]

Available Commands:
cheatsheet  Read common cheatsheets & payloads
  help        Help about any command
  listener    Obtain the command to start a reverse shell listener
  payloads    Obtain and serve common payloads
  proxy       Obtain a random proxy from FreeProxy
  revshell    Obtain the command for a reverse shell
  tools       Generate a install script for the most common cybersecurity tools
  version     Print the current version
  wordlists   Generate a download script for the most common wordlists

Flags:
  -h, --help   help for secbutler

Use "secbutler [command] --help" for more information about a command.
Run the following command to install the latest version:
go install github.com/groundsec/secbutler@latest
Or you can simply grab an executable from the Releases page.
secbutler is made with 🖤 by the GroundSec team and released under the MIT LICENSE.
Rayder is a command-line tool designed to simplify the orchestration and execution of workflows. It allows you to define a series of modules in a YAML file, each consisting of commands to be executed. Rayder helps you automate complex processes, making it easy to streamline repetitive modules and execute them parallelly if the commands do not depend on each other.
To install Rayder, ensure you have Go (1.16 or higher) installed on your system. Then, run the following command:
go install github.com/devanshbatham/rayder@v0.0.4Rayder offers a straightforward way to execute workflows defined in YAML files. Use the following command:
rayder -w path/to/workflow.yamlA workflow is defined in a YAML file with the following structure:
vars:
  VAR_NAME: value
  # Add more variables...

parallel: true|false
modules:
  - name: task-name
    cmds:
      - command-1
      - command-2
      # Add more commands...
    silent: true|false
# Add more modules...Rayder allows you to use variables in your workflow configuration, making it easy to parameterize your commands and achieve more flexibility. You can define variables in the vars section of your workflow YAML file. These variables can then be referenced within your command strings using double curly braces ({{}}).
To define variables, add them to the vars section of your workflow YAML file:
vars:
  VAR_NAME: value
  ANOTHER_VAR: another_value
# Add more variables...You can reference variables within your command strings using double curly braces ({{}}). For example, if you defined a variable OUTPUT_DIR, you can use it like this:
modules:
  - name: example-task
    cmds:
- echo "Output directory {{OUTPUT_DIR}}"You can also supply values for variables via the command line when executing your workflow. Use the format VARIABLE_NAME=value to provide values for specific variables. For example:
rayder -w path/to/workflow.yaml VAR_NAME=new_value ANOTHER_VAR=updated_valueIf you don't provide values for variables via the command line, Rayder will automatically apply default values defined in the vars section of your workflow YAML file.
Remember that variables supplied via the command line will override the default values defined in the YAML configuration.
Here's an example of how you can define, reference, and supply variables in your workflow configuration:
vars:
  ORG: "example.org"
  OUTPUT_DIR: "results"

modules:
  - name: example-task
    cmds:
      - echo "Organization {{ORG}}"
      - echo "Output directory {{OUTPUT_DIR}}"
When executing the workflow, you can provide values for ORG and OUTPUT_DIR via the command line like this:
rayder -w path/to/workflow.yaml ORG=custom_org OUTPUT_DIR=custom_results_dirThis will override the default values and use the provided values for these variables.
Here's an example workflow configuration tailored for reverse whois recon and processing the root domains into subdomains, resolving them and checking which ones are alive:
vars:
  ORG: "Acme, Inc"
  OUTPUT_DIR: "results-dir"

parallel: false
modules:
  - name: reverse-whois
    silent: false
    cmds:
      - mkdir -p {{OUTPUT_DIR}}
      - revwhoix -k "{{ORG}}" > {{OUTPUT_DIR}}/root-domains.txt

  - name: finding-subdomains
    cmds:
      - xargs -I {} -a {{OUTPUT_DIR}}/root-domains.txt echo "subfinder -d {} -o {}.out" | quaithe -workers 30
    silent: false

  - name: cleaning-subdomains
    cmds:
      -  cat *.out > {{OUTPUT_DIR}}/root-subdomains.txt
      -  rm *.out
    silent: true

  - name: resolving-subdomains
    cmds:
      - cat {{OUTPUT_DIR}}/root-subdomains.txt | dnsx -silent -threads 100 -o {{OUTPUT_DIR}}/resolved-subdomains.txt
    silent: false

  - name: checking-alive-subdomains
    cmds:
      - cat {{OUTPUT_DIR}}/resolved-subdomains.txt | httpx -silent -threads 100   0 -o {{OUTPUT_DIR}}/alive-subdomains.txt
    silent: false
To execute the above workflow, run the following command:
rayder -w path/to/reverse-whois.yaml ORG="Yelp, Inc" OUTPUT_DIR=resultsThe parallel field in the workflow configuration determines whether modules should be executed in parallel or sequentially. Setting parallel to true allows modules to run concurrently, making it suitable for modules with no dependencies. When set to false, modules will execute one after another.
Explore a collection of sample workflows and examples in the Rayder workflows repository. Stay tuned for more additions!
Inspiration of this project comes from Awesome taskfile project.
Reverse shell that can bypass windows defender detection
$ apt install nim
nim c -d:mingw --app:gui nimshell.nim
Change the IP address and port number you want to listen to in the nimshell.nim file according to your device.
$ nc -nvlp 4444

C2 Search Netlas is a Java utility designed to detect Command and Control (C2) servers using the Netlas API. It provides a straightforward and user-friendly CLI interface for searching C2 servers, leveraging the Netlas API to gather data and process it locally.
To utilize this terminal utility, you'll need a Netlas API key. Obtain your key from the Netlas website.
After acquiring your API key, execute the following command to search servers:
c2detect -t <TARGET_DOMAIN> -p <TARGET_PORT> -s <API_KEY> [-v]Replace <TARGET_DOMAIN> with the desired IP address or domain, <TARGET_PORT> with the port you wish to scan, and <API_KEY> with your Netlas API key. Use the optional -v flag for verbose output. For example, to search at the google.com IP address on port 443 using the Netlas API key 1234567890abcdef, enter:
c2detect -t google.com -p 443 -s 1234567890abcdefTo download a release of the utility, follow these steps:
java -jar c2-search-netlas-<version>.jar -t <ip-or-domain> -p <port> -s <your-netlas-api-key>To build and start the Docker container for this project, run the following commands:
docker build -t c2detect .
docker run -it --rm \
  c2detect \
  -s "your_api_key" \
  -t "your_target_domain" \
  -p "your_target_port" \
-vTo use this utility, you need to have a Netlas API key. You can get the key from the Netlas website. Now you can build the project and run it using the following commands:
./gradlew build
java -jar app/build/libs/c2-search-netlas-1.0-SNAPSHOT.jar --help
This will display the help message with available options. To search for C2 servers, run the following command:
java -jar app/build/libs/c2-search-netlas-1.0-SNAPSHOT.jar -t <ip-or-domain> -p <port> -s <your-netlas-api-key>This will display a list of C2 servers found in the given IP address or domain.
| Name | Support |
|---|---|
| Metasploit | ✅ |
| Havoc | ❓ |
| Cobalt Strike | ✅ |
| Bruteratel | ✅ |
| Sliver | ✅ |
| DeimosC2 | ✅ |
| PhoenixC2 | ✅ |
| Empire | ❌ |
| Merlin | ✅ |
| Covenant | ❌ |
| Villain | ✅ |
| Shad0w | ❌ |
| PoshC2 | ✅ |
Legend:
If you'd like to contribute to this project, please feel free to create a pull request.
This project is licensed under the License - see the LICENSE file for details.

BREAD (BIOS Reverse Engineering & Advanced Debugging) is an 'injectable' real-mode x86 debugger that can debug arbitrary real-mode code (on real HW) from another PC via serial cable.
BREAD emerged from many failed attempts to reverse engineer legacy BIOS. Given that the vast majority -- if not all -- BIOS analysis is done statically using disassemblers, understanding the BIOS becomes extremely difficult, since there's no way to know the value of registers or memory in a given piece of code.
Despite this, BREAD can also debug arbitrary code in real-mode, such as bootable code or DOS programs too.
This debugger is divided into two parts: the debugger (written entirely in assembly and running on the hardware being debugged) and the bridge, written in C and running on Linux.
The debugger is the injectable code, written in 16-bit real-mode, and can be placed within the BIOS ROM or any other real-mode code. When executed, it sets up the appropriate interrupt handlers, puts the processor in single-step mode, and waits for commands on the serial port.
The bridge, on the other hand, is the link between the debugger and GDB. The bridge communicates with GDB via TCP and forwards the requests/responses to the debugger through the serial port. The idea behind the bridge is to remove the complexity of GDB packets and establish a simpler protocol for communicating with the machine. In addition, the simpler protocol enables the final code size to be smaller, making it easier for the debugger to be injectable into various different environments.
As shown in the following diagram:
    +---------+ simple packets +----------+   GDB packets  +---------+
    |         |--------------->|          |--------------->|         |
    |   dbg   |                |  bridge  |                |   gdb   |
    |(real HW)|<---------------| (Linux)  |<---------------| (Linux) |
+---------+ serial +----------+ TCP +---------+By implementing the GDB stub, BREAD has many features out-of-the-box. The following commands are supported:
How many? Yes. Since the code being debugged is unaware that it is being debugged, it can interfere with the debugger in several ways, to name a few:
Protected-mode jump: If the debugged code switches to protected-mode, the structures for interrupt handlers, etc. are altered and the debugger will no longer be invoked at that point in the code. However, it is possible that a jump back to real mode (restoring the full previous state) will allow the debugger to work again.
IDT changes: If for any reason the debugged code changes the IDT or its base address, the debugger handlers will not be properly invoked.
Stack: BREAD uses a stack and assumes it exists! It should not be inserted into locations where the stack has not yet been configured.
For BIOS debugging, there are other limitations such as: it is not possible to debug the BIOS code from the very beggining (bootblock), as a minimum setup (such as RAM) is required for BREAD to function correctly. However, it is possible to perform a "warm-reboot" by setting CS:EIP to F000:FFF0. In this scenario, the BIOS initialization can be followed again, as BREAD is already properly loaded. Please note that the "code-path" of BIOS initialization during a warm-reboot may be different from a cold-reboot and the execution flow may not be exactly the same.
Building only requires GNU Make, a C compiler (such as GCC, Clang, or TCC), NASM, and a Linux machine.
The debugger has two modes of operation: polling (default) and interrupt-based:
Polling mode is the simplest approach and should work well in a variety of environments. However, due the polling nature, there is a high CPU usage:
$ git clone https://github.com/Theldus/BREAD.git
$ cd BREAD/
$ makeThe interrupt-based mode optimizes CPU utilization by utilizing UART interrupts to receive new data, instead of constantly polling for it. This results in the CPU remaining in a 'halt' state until receiving commands from the debugger, and thus, preventing it from consuming 100% of the CPU's resources. However, as interrupts are not always enabled, this mode is not set as the default option:
$ git clone https://github.com/Theldus/BREAD.git
$ cd BREAD/
$ make UART_POLLING=noUsing BREAD only requires a serial cable (and yes, your motherboard has a COM header, check the manual) and injecting the code at the appropriate location.
To inject, minimal changes must be made in dbg.asm (the debugger's src). The code's 'ORG' must be changed and also how the code should return (look for ">> CHANGE_HERE <<" in the code for places that need to be changed).
Using an AMI legacy as an example, where the debugger module will be placed in the place of the BIOS logo (0x108200 or FFFF:8210) and the following instructions in the ROM have been replaced with a far call to the module:
...
00017EF2  06                push es
00017EF3  1E                push ds
00017EF4  07                pop es
00017EF5  8BD8              mov bx,ax     -┐ replaced by: call 0xFFFF:0x8210 (dbg.bin)
00017EF7  B8024F            mov ax,0x4f02 -┘
00017EFA  CD10              int 0x10
00017EFC  07                pop es
00017EFD  C3                ret
...
the following patch is sufficient:
diff --git a/dbg.asm b/dbg.asm
index caedb70..88024d3 100644
--- a/dbg.asm
+++ b/dbg.asm
@@ -21,7 +21,7 @@
 ; SOFTWARE.

 [BITS 16]
-[ORG 0x0000] ; >> CHANGE_HERE <<
+[ORG 0x8210] ; >> CHANGE_HERE <<

 %include "constants.inc"

@@ -140,8 +140,8 @@ _start:

 	; >> CHANGE_HERE <<
 	; Overwritten BIOS instructions below (if any)
-	nop
-	nop
+	mov ax, 0x4F02
+	int 0x10
 	nop
 	nop
It is important to note that if you have altered a few instructions within your ROM to invoke the debugger code, they must be restored prior to returning from the debugger.
The reason for replacing these two instructions is that they are executed just prior to the BIOS displaying the logo on the screen, which is now the debugger, ensuring a few key points:
Finding a good location to call the debugger (where the BIOS has already initialized enough, but not too late) can be challenging, but it is possible.
After this, dbg.bin is ready to be inserted into the correct position in the ROM.
Debugging DOS programs with BREAD is a bit tricky, but possible:
dbg.asm so that DOS understands it as a valid DOS program:times)int 0x20)The following patch addresses this:
diff --git a/dbg.asm b/dbg.asm
index caedb70..b042d35 100644
--- a/dbg.asm
+++ b/dbg.asm
@@ -21,7 +21,10 @@
 ; SOFTWARE.

 [BITS 16]
-[ORG 0x0000] ; >> CHANGE_HERE <<
+[ORG 0x100]
+
+times 40*1024 db 0x90 ; keep some distance,
+                      ; 40kB should be enough

 %include "constants.inc"

@@ -140,7 +143,7 @@ _start:

 	; >> CHANGE_HERE <<
 	; Overwritten BIOS instructions below (if any)
-	nop
+	int 0x20 ; DOS interrupt to exit process
nopCreate a bootable FreeDOS (or DOS) floppy image containing just the kernel and the terminal: KERNEL.SYS and COMMAND.COM. Also add to this floppy image the program to be debugged and the DBG.COM (dbg.bin).
The following steps should be taken after creating the image:
bridge already opened (refer to the next section for instructions).DBG.COM.DBG.COM process to continue until it finishes.It is important to note that DOS does not erase the process image after it exits. As a result, the debugger can be configured like any other DOS program and the appropriate breakpoints can be set. The beginning of the debugger is filled with NOPs, so it is anticipated that the new process will not overwrite the debugger's memory, allowing it to continue functioning even after it appears to be "finished". This allows BREaD to debug other programs, including DOS itself.
Bridge is the glue between the debugger and GDB and can be used in different ways, whether on real hardware or virtual machine.
Its parameters are:
Usage: ./bridge [options]
Options:
  -s Enable serial through socket, instead of device
  -d <path> Replaces the default device path (/dev/ttyUSB0)
            (does not work if -s is enabled)
  -p <port> Serial port (as socket), default: 2345
  -g <port> GDB port, default: 1234
  -h This help

If no options are passed the default behavior is:
  ./bridge -d /dev/ttyUSB0 -g 1234

Minimal recommended usages:
  ./bridge -s (socket mode, serial on 2345 and GDB on 1234)
  ./bridge    (device mode, serial on /dev/ttyUSB0 and GDB on 1234)
To use it on real hardware, just invoke it without parameters. Optionally, you can change the device path with the -d parameter:
./bridge or ./bridge -d /path/to/device)Single-stepped, you can now connect GDB! and then launch GDB: gdb.For use in a virtual machine, the execution order changes slightly:
./bridge or ./bridge -d /path/to/device)make bochs or make qemu)Single-stepped, you can now connect GDB! and then launch GDB: gdb.In both cases, be sure to run GDB inside the BRIDGE root folder, as there are auxiliary files in this folder for GDB to work properly in 16-bit.
BREAD is always open to the community and willing to accept contributions, whether with issues, documentation, testing, new features, bugfixes, typos, and etc. Welcome aboard.
BREAD is licensed under MIT License. Written by Davidson Francis and (hopefully) other contributors.
Breakpoints are implemented as hardware breakpoints and therefore have a limited number of available breakpoints. In the current implementation, only 1 active breakpoint at a time! ↩
Hardware watchpoints (like breakpoints) are also only supported one at a time. ↩
Please note that debug registers do not work by default on VMs. For bochs, it needs to be compiled with the --enable-x86-debugger=yes flag. For Qemu, it needs to run with KVM enabled: --enable-kvm (make qemu already does this). ↩

This Ghidra Toolkit is a comprehensive suite of tools designed to streamline and automate various tasks associated with running Ghidra in Headless mode. This toolkit provides a wide range of scripts that can be executed both inside and alongside Ghidra, enabling users to perform tasks such as Vulnerability Hunting, Pseudo-code Commenting with ChatGPT and Reporting with Data Visualization on the analyzed codebase. It allows user to load and save their own script and interract with the built-in API of the script.
Headless Mode Automation: The toolkit enables users to seamlessly launch and run Ghidra in Headless mode, allowing for automated and batch processing of code analysis tasks.
Script Repository/Management: The toolkit includes a repository of pre-built scripts that can be executed within Ghidra. These scripts cover a variety of functionalities, empowering users to perform diverse analysis and manipulation tasks. It allows users to load and save their own scripts, providing flexibility and customization options for their specific analysis requirements. Users can easily manage and organize their script collection.
Flexible Input Options: Users can utilize the toolkit to analyze individual files or entire folders containing multiple files. This flexibility enables efficient analysis of both small-scale and large-scale codebases.
Before using this project, make sure you have the following software installed:
pip install sekiryu.In order to use the script you can simply run it against a binary with the options that you want to execute.
sekiryu [-F FILE][OPTIONS]Please note that performing a binary analysis with Ghidra (or any other product) is a relatively slow process. Thus, expect the binary analysis to take several minutes depending on the host performance. If you run Sekiryu against a very large application or a large amount of binary files, be prepared to WAIT
proxy.send_data Scripts are saved in the folder /modules/scripts/ you can simply copy your script there. In the ghidra_pilot.py file you can find the following function which is responsible to run a headless ghidra script:
def exec_headless(file, script):
	"""
	Execute the headless analysis of ghidra
	"""
	path = ghidra_path + 'analyzeHeadless'
	# Setting variables
	tmp_folder = "/tmp/out"
	os.mkdir(tmp_folder)
	cmd = ' ' + tmp_folder + ' TMP_DIR -import'+ ' '+ file + ' '+ "-postscript "+ script +" -deleteProject"

	# Running ghidra with specified file and script
	try:
		p = subprocess.run([str(path + cmd)], shell=True, capture_output=True)
		os.rmdir(tmp_folder)

	except KeyError as e:
		print(e)
		os.rmdir(tmp_folder)
The usage is pretty straight forward, you can create your own script then just add a function in the ghidra_pilot.py such as:
def yourfunction(file):
	try:
		# Setting script
		script = "modules/scripts/your_script.py"

		# Start the exec_headless function in a new thread
		thread = threading.Thread(target=exec_headless, args=(file, script))
		thread.start()
		thread.join()
	except Exception as e:
		print(str(e))
The file cli.py is responsible for the command-line-interface and allows you to add argument and command associated like this:
analysis_parser.add_argument('[-ShortCMD]', '[--LongCMD]', help="Your Help Message", action="store_true")The xmlrpc.server module is not secure against maliciously constructed data. If you need to parse
untrusted or unauthenticated data see XML vulnerabilities.
A lot of people encouraged me to push further on this tool and improve it. Without you all this project wouldn't have been
the same so it's time for a proper shout-out:
- @JeanBedoul @McProustinet @MilCashh @Aspeak @mrjay @Esbee|sandboxescaper @Rosen @Cyb3rops @RussianPanda @Dr4k0nia
- @Inversecos @Vs1m @djinn @corelanc0d3r @ramishaath @chompie1337
Thanks for your feedback, support, encouragement, test, ideas, time and care.
For more information about Bushido Security, please visit our website: https://www.bushido-sec.com/.
HTTP-Shell is Multiplatform Reverse Shell. This tool helps you to obtain a shell-like interface on a reverse connection over HTTP. Unlike other reverse shells, the main goal of the tool is to use it in conjunction with Microsoft Dev Tunnels, in order to get a connection as close as possible to a legitimate one.
This shell is not fully interactive, but displays any errors on screen (both Windows and Linux), is capable of uploading and downloading files, has command history, terminal cleanup (even with CTRL+L), automatic reconnection and movement between directories.
It is recommended to clone the complete repository or download the zip file. You can do this by running the following command:
git clone https://github.com/JoelGMSec/HTTP-Shell
https://darkbyte.net/obteniendo-shells-con-microsoft-dev-tunnels
This project is licensed under the GNU 3.0 license - see the LICENSE file for more details.
This tool has been created and designed from scratch by Joel Gámez Molina (@JoelGMSec).
This software does not offer any kind of guarantee. Its use is exclusive for educational environments and / or security audits with the corresponding consent of the client. I am not responsible for its misuse or for any possible damage caused by it.
For more information, you can find me on Twitter as @JoelGMSec and on my blog darkbyte.net.
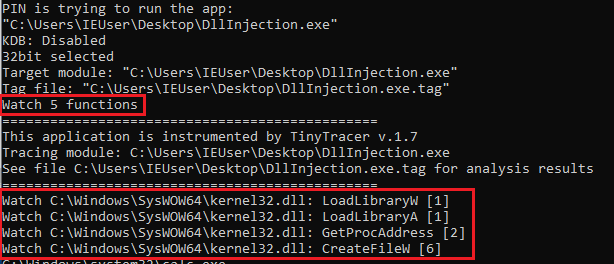
A Pin Tool for tracing:
Bypasses the anti-tracing check based on RDTSC.
Generates a report in a .tag format (which can be loaded into other analysis tools):
RVA;traced eventi.e.
345c2;section: .text
58069;called: C:\Windows\SysWOW64\kernel32.dll.IsProcessorFeaturePresent
3976d;called: C:\Windows\SysWOW64\kernel32.dll.LoadLibraryExW
3983c;called: C:\Windows\SysWOW64\kernel32.dll.GetProcAddress
3999d;called: C:\Windows\SysWOW64\KernelBase.dll.InitializeCriticalSectionEx
398ac;called: C:\Windows\SysWOW64\KernelBase.dll.FlsAlloc
3995d;called: C:\Windows\SysWOW64\KernelBase.dll.FlsSetValue
49275;called: C:\Windows\SysWOW64\kernel32.dll.LoadLibraryExW
4934b;called: C:\Windows\SysWOW64\kernel32.dll.GetProcAddress
...To compile the prepared project you need to use Visual Studio >= 2012. It was tested with Intel Pin 3.28.
Clone this repo into \source\tools that is inside your Pin root directory. Open the project in Visual Studio and build. Detailed description available here.
To build with Intel Pin < 3.26 on Windows, use the appropriate legacy Visual Studio project.
For now the support for Linux is experimental. Yet it is possible to build and use Tiny Tracer on Linux as well. Please refer tiny_runner.sh for more information. Detailed description available here.
Details about the usage you will find on the project's Wiki.
install32_64 you can find a utility that checks if Kernel Debugger is disabled (kdb_check.exe, source), and it is used by the Tiny Tracer's .bat scripts. This utilty sometimes gets flagged as a malware by Windows Defender (it is a known false positive). If you encounter this issue, you may need to exclude the installation directory from Windows Defender scans.Questions? Ideas? Join Discussions!
How PurpleOps is different:
# Clone this repository
$ git clone https://github.com/CyberCX-STA/PurpleOps

# Go into the repository
$ cd PurpleOps

# Alter PurpleOps settings (if you want to customize anything but should work out the box)
$ nano .env

# Run the app with docker
$ sudo docker compose up

# PurpleOps should now by available on http://localhost:5000, it is recommended to add a reverse proxy such as nginx or Apache in front of it if you want to expose this to the outside world.

# Alternatively
$ sudo docker run --name mongodb -d -p 27017:27017 mongo
$ pip3 install -r requirements.txt
$ python3 seeder.py
$ python3 purpleops.pyWe would love to hear back from you, if something is broken or have and idea to make it better add a ticket or ping us pops@purpleops.app | @_w_m__


